German construction sector still in recession, civil engineering only bright spot

i3 Verticals Inc. (NASDAQ:IIIV) released its Q3 Fiscal Year 2025 supplemental information showing continued year-over-year growth across key metrics, though with some sequential moderation from the previous quarter. The company reported a 12% increase in revenue compared to the same period last year, while adjusted earnings per share jumped significantly from $0.02 to $0.23 year-over-year.
Quarterly Performance Highlights
i3 Verticals generated total revenue of $51.9 million for the quarter ended June 30, 2025, representing a 12% increase from $46.2 million in the same quarter of fiscal 2024. The company’s adjusted EBITDA reached $12.7 million, up 18% year-over-year, with an adjusted EBITDA margin of 25%, compared to 23% in the prior year period.
As shown in the following quarterly performance breakdown:
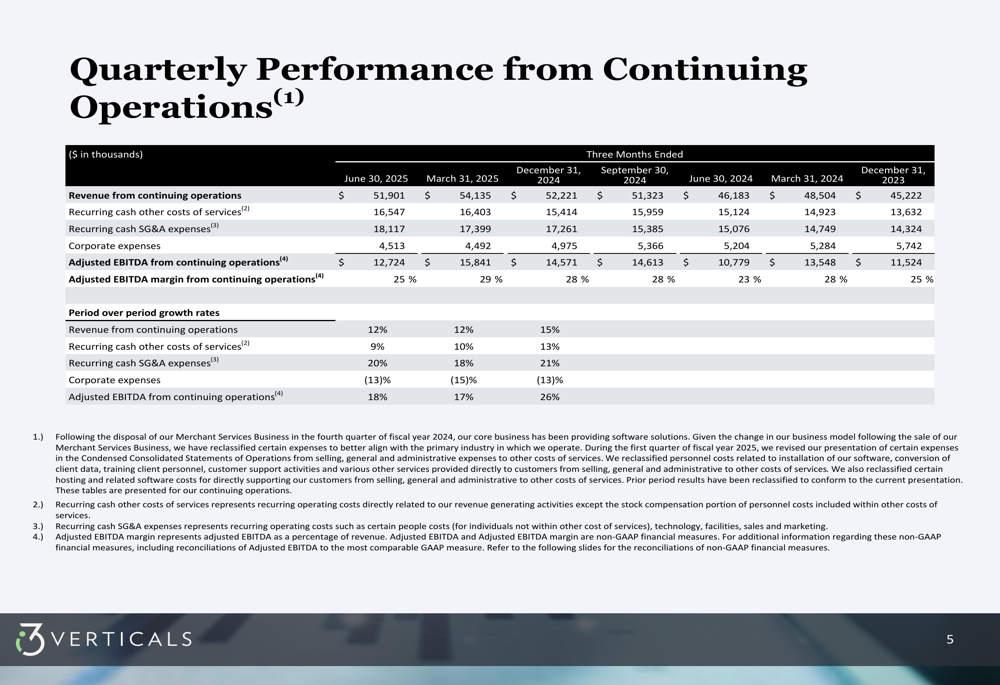
Notably, while the year-over-year comparisons show strong growth, the sequential comparison to Q2 FY2025 indicates some moderation. Based on the company’s previous earnings report, Q3 revenue of $51.9 million represents a 4% sequential decline from the $54.1 million reported in Q2.
Detailed Financial Analysis
The company’s revenue composition reveals a continued shift toward software and related services, with SaaS revenue growing 24% year-over-year to $9.3 million. Total (EPA:TTEF) software and related service revenue reached $36.2 million, representing approximately 70% of total revenue and growing 13% compared to the prior year.
The detailed revenue breakdown shows strength across multiple categories:
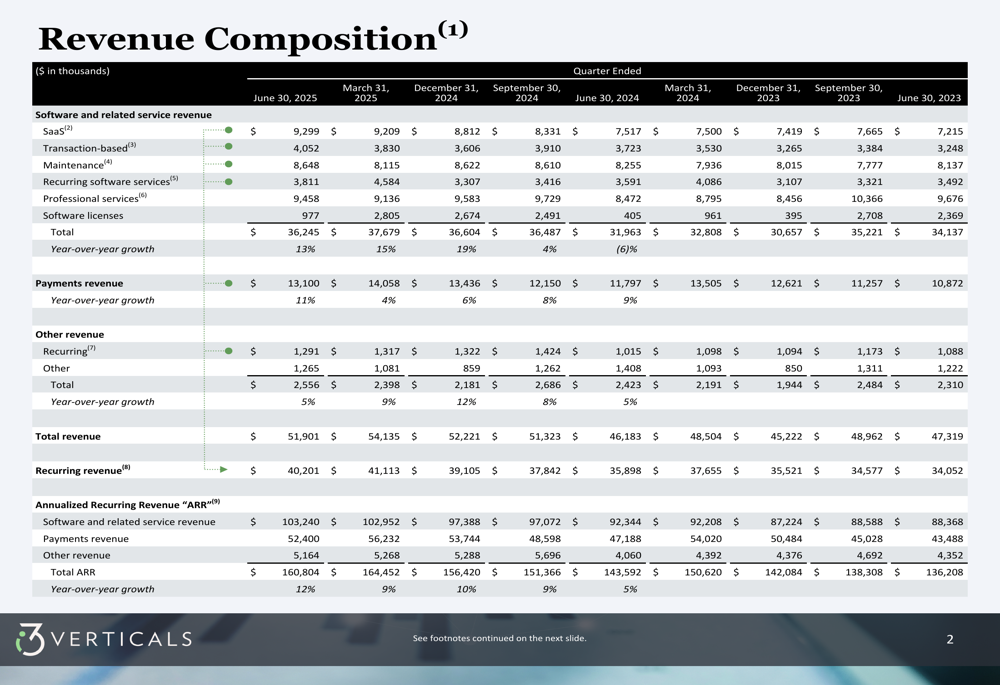
Recurring revenue remains a cornerstone of i3 Verticals’ business model, accounting for 77% of total revenue at $40.2 million. The company’s Annualized Recurring Revenue (ARR) reached $160.8 million, a 12% increase from the prior year, highlighting the stability of its revenue streams.
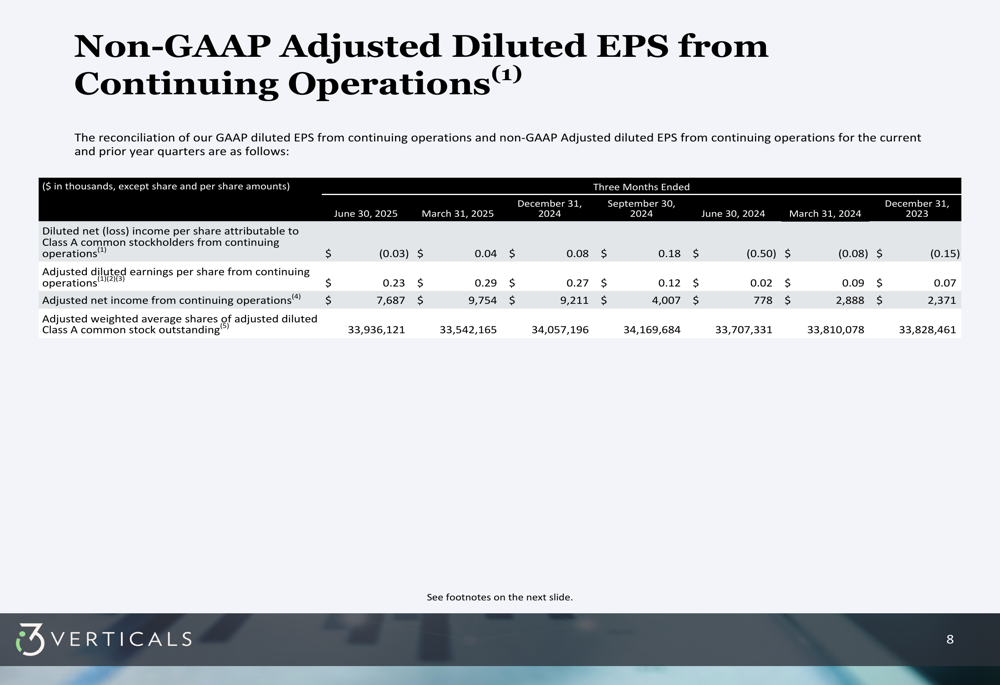
The company’s adjusted diluted earnings per share from continuing operations showed remarkable improvement, reaching $0.23 for Q3 FY2025, compared to just $0.02 in the same period last year. This represents a more than tenfold increase year-over-year, though it marks a sequential decline from the $0.32 reported in Q2 FY2025.
The EPS improvement is illustrated in the following chart:
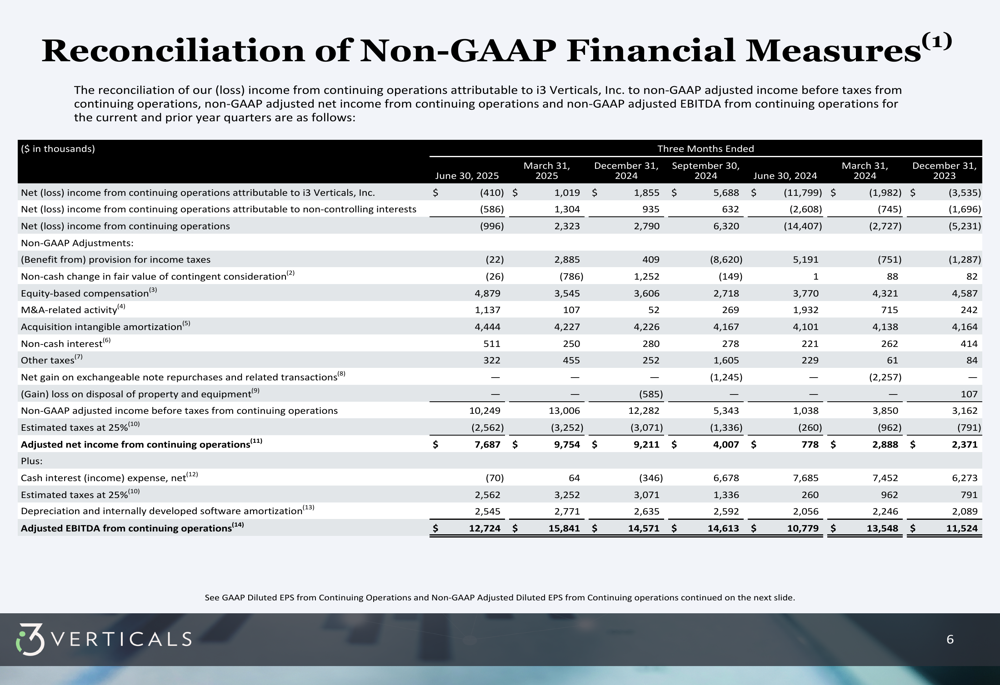
Despite the strong year-over-year performance, i3 Verticals reported a GAAP loss from operations of $4.8 million for Q3 FY2025, compared to a loss of $1.3 million in Q3 FY2024. This widening gap between GAAP and non-GAAP results highlights the impact of various adjustments, including acquisition-related expenses and amortization.
The reconciliation between GAAP and non-GAAP measures shows:
Strategic Focus and Cost Management
The presentation reveals that i3 Verticals has maintained its strategic focus on public sector verticals, which aligns with commentary from the company’s previous earnings call where CEO Greg Daily expressed enthusiasm about the company’s "streamlined focus on public sector verticals."
The company demonstrated effective cost management with corporate expenses decreasing by 13% year-over-year to $4.5 million in Q3 FY2025. However, recurring cash SG&A expenses increased 20% to $18.1 million, outpacing revenue growth and potentially contributing to the sequential decline in adjusted EBITDA margin from 29% in Q2 to 25% in Q3.
Market Context
i3 Verticals’ stock closed at $28.50 on August 7, 2025, near the higher end of its 52-week range of $20.42 to $30.10. The stock has shown resilience despite the sequential decline in performance metrics from Q2 to Q3, suggesting investor confidence in the company’s long-term strategy and growth trajectory.
The company’s emphasis on recurring revenue and continued expansion in the public sector vertical appears to be resonating with investors, as evidenced by the stock’s performance. With 77% of revenue now coming from recurring sources and ARR growing at 12% year-over-year, i3 Verticals has established a stable foundation for future growth despite quarterly fluctuations.
While the presentation doesn’t provide explicit forward guidance, the company’s previous outlook for FY2025 included RemainCo revenue between $207 million and $217 million, with adjusted EBITDA projected between $56 million and $61 million. Based on year-to-date performance through Q3, achieving these targets would require continued strength in the final quarter of the fiscal year.
Full presentation:
This article was generated with the support of AI and reviewed by an editor. For more information see our T&C.