US stock futures inch lower after Wall St marks fresh records on tech gains

Introduction & Market Context
Intercontinental Exchange (NYSE:ICE) delivered record financial results in the first quarter of 2025, according to the company’s earnings presentation released on May 1, 2025. The global market infrastructure and data provider reported strong performance across all key metrics, with particularly robust growth in its energy markets and transaction-based revenues.
The company’s shares closed at $167.97 on April 30, 2025, and were trading up 0.57% in pre-market activity following the earnings release. ICE has maintained its position as a leading provider of market infrastructure, data services, and technology solutions across global financial and energy markets.
Quarterly Performance Highlights
ICE reported record net revenues of $2.47 billion in Q1 2025, representing an 8% increase compared to the same period last year. This growth was driven by a 14% surge in transaction revenues, which reached $1.24 billion, while recurring revenues grew by 3% to $1.24 billion.
The company achieved record adjusted operating income of $1.51 billion, up 11% year-over-year on a constant currency basis. Adjusted operating margin expanded to 61%, a 2 percentage point improvement from Q1 2024. Adjusted diluted earnings per share grew 16% to reach a record $1.72.
As shown in the following comprehensive financial performance summary:
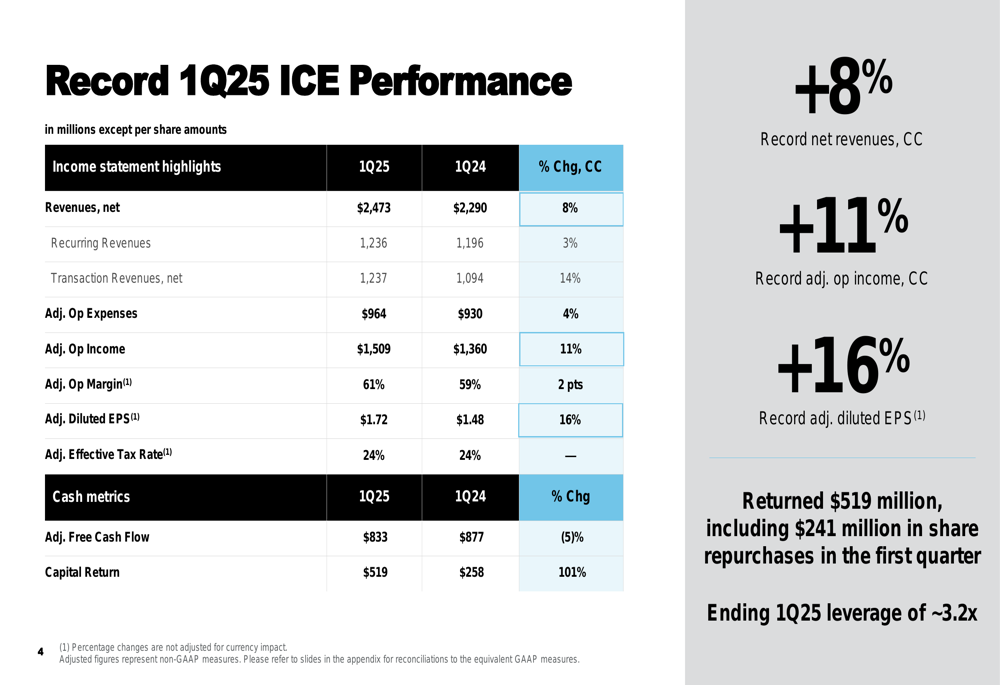
ICE returned $519 million to shareholders during the quarter, including $241 million in share repurchases, representing a 101% increase in capital return compared to Q1 2024. The company maintained its financial discipline with an adjusted debt-to-EBITDA leverage ratio of approximately 3.2x.
Segment Analysis
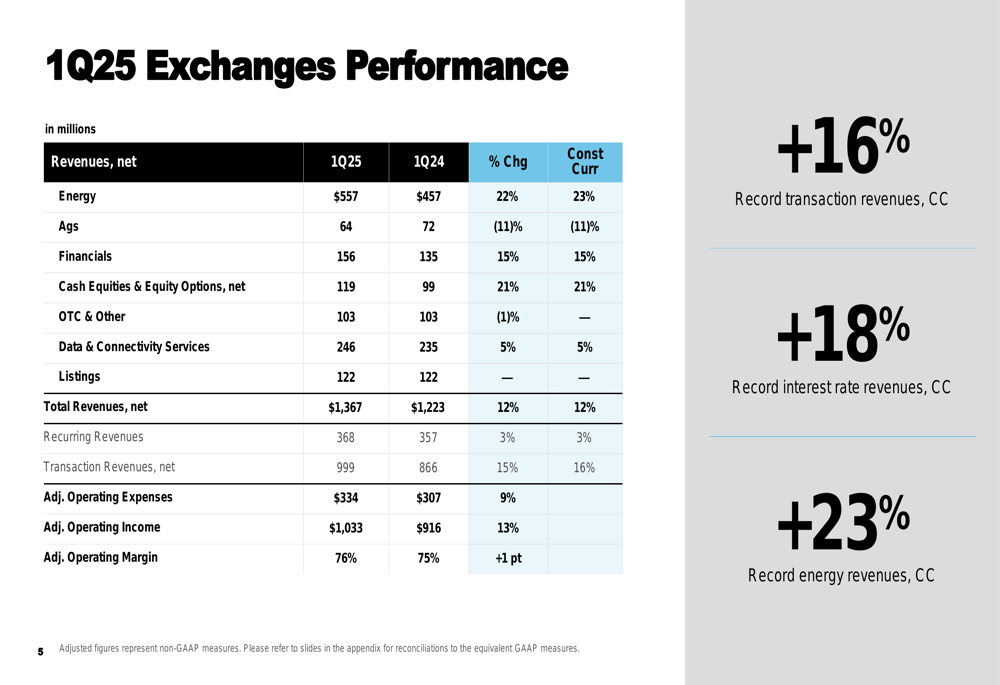
The Exchanges segment was a standout performer, with net revenues increasing 12% year-over-year to $1.37 billion. This growth was fueled by record transaction revenues, which rose 16% on a constant currency basis. Energy markets were particularly strong, with revenues increasing 23% to $557 million, while interest rate revenues grew 18%.
The following breakdown illustrates the strong performance across the Exchanges segment:
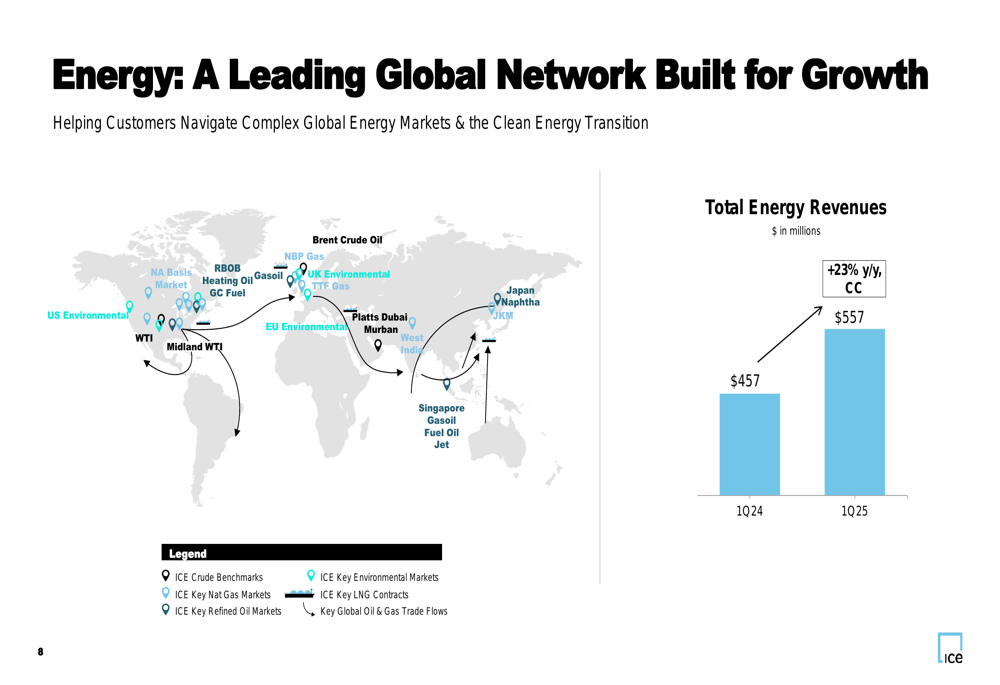
The energy business continues to be a key growth driver for ICE, with the company leveraging its global network across crude oil, natural gas, refined products, and environmental markets. The company’s presentation highlighted its strategic positioning in key energy hubs worldwide:
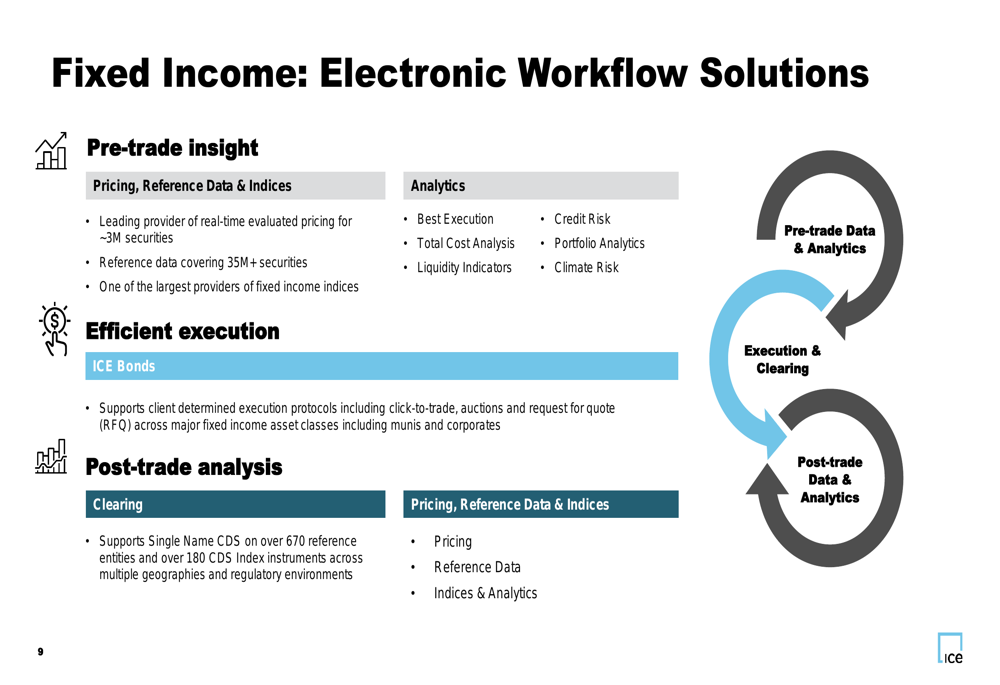
The Fixed Income & Data Services segment reported revenues of $596 million, a 5% increase compared to Q1 2024. Growth was balanced across both recurring and transaction revenues, with notable strength in ICE Bonds (up 16%) and Index revenues (up 14%). The segment’s annual subscription value (ASV) grew 5% on a constant currency basis.
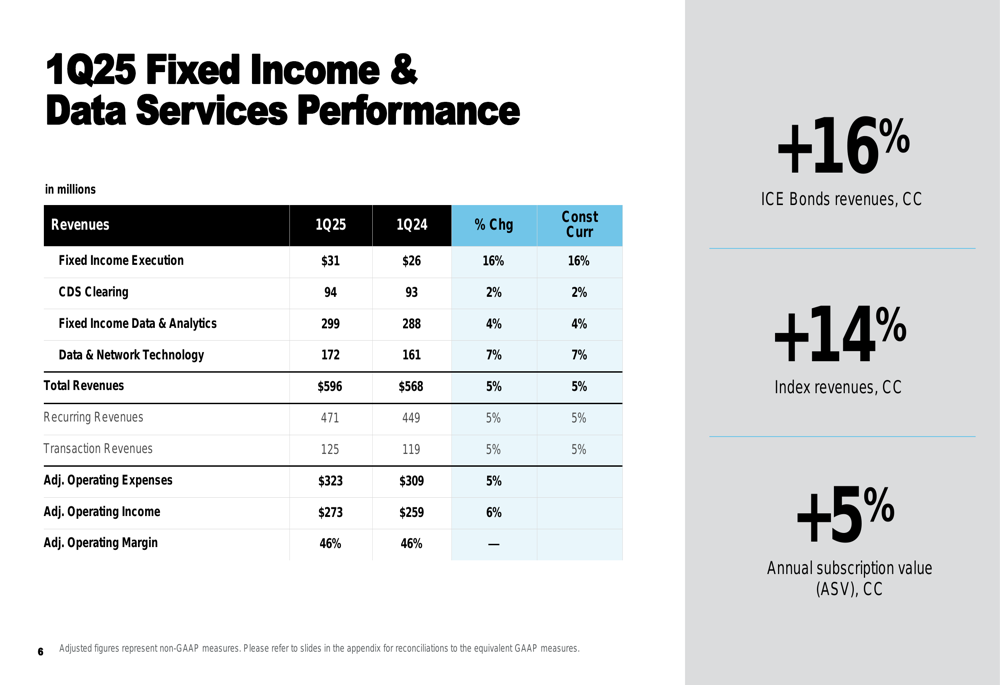
ICE’s fixed income business provides comprehensive electronic workflow solutions spanning pre-trade insights, efficient execution, and post-trade analysis:
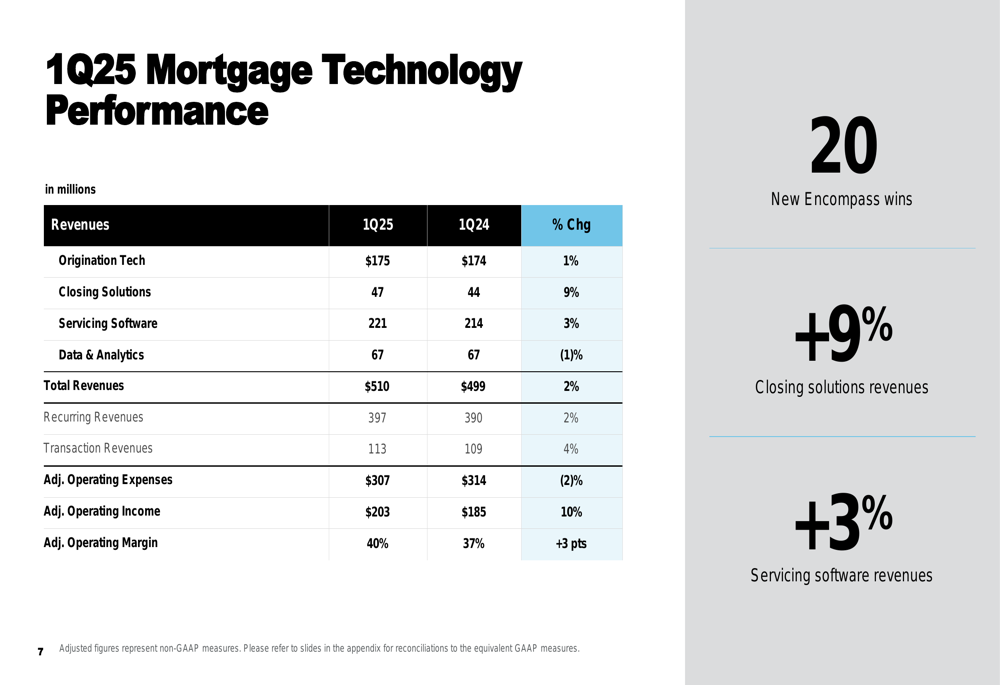
The Mortgage Technology segment generated revenues of $510 million, up 2% year-over-year, with both recurring and transaction revenues showing growth. The segment’s adjusted operating income increased 10% to $203 million, with operating margin expanding 3 percentage points to 40%. The company reported 20 new Encompass wins during the quarter, highlighting continued market adoption of its mortgage origination platform.
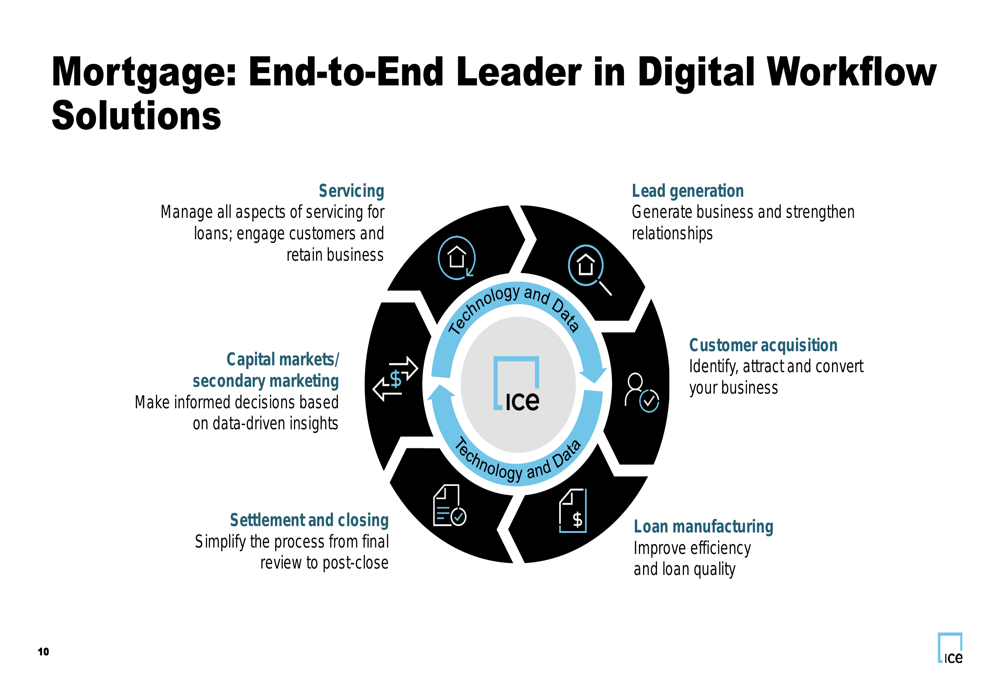
ICE’s mortgage technology business provides end-to-end digital workflow solutions across the mortgage lifecycle:
Strategic Positioning & Long-Term Growth
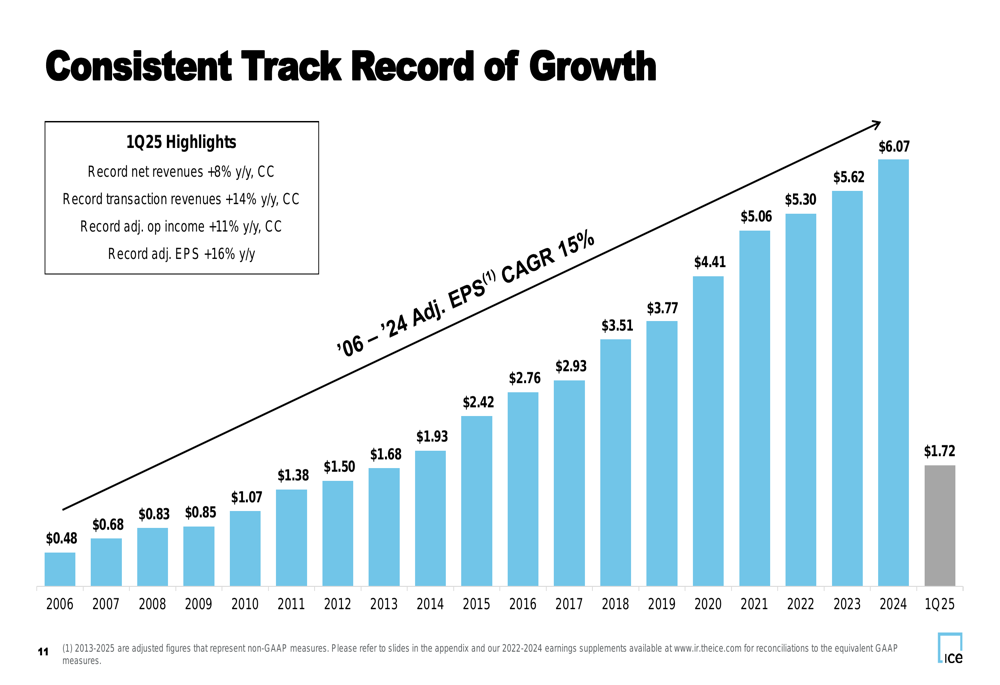
ICE has maintained a consistent track record of growth, with a 15% compound annual growth rate (CAGR) in adjusted earnings per share from 2006 to 2024. The Q1 2025 results continue this trajectory with record performance across key metrics.
The following chart illustrates ICE’s long-term growth trajectory:
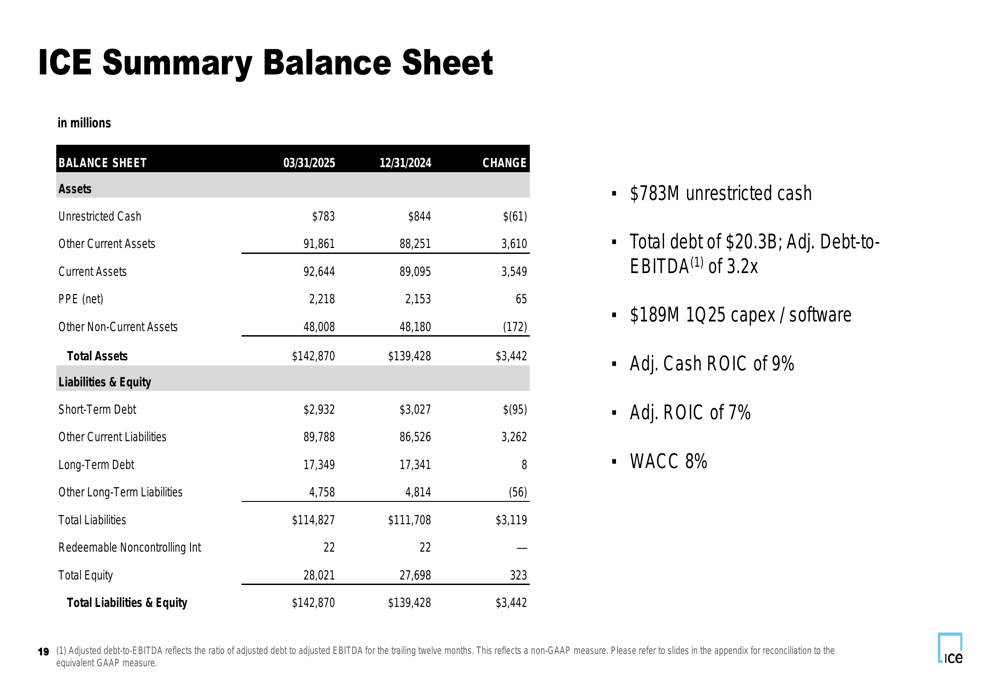
The company’s balance sheet remains strong, with $783 million in unrestricted cash and total debt of $20.3 billion as of March 31, 2025. ICE reported an adjusted cash return on invested capital of 9% and an adjusted return on invested capital of 7%, compared to a weighted average cost of capital of 8%.
Forward-Looking Statements
For the full year 2025, ICE maintained its guidance for low-single-digit growth in Exchanges recurring revenues, mid-single-digit growth in Fixed Income & Data Services recurring revenues, and low-to-mid single-digit growth in total Mortgage Technology revenues.
The company expects adjusted operating expenses for 2025 to be between $3.915 billion and $3.965 billion, with second-quarter adjusted expenses projected at $980-990 million. The effective tax rate is expected to remain between 24% and 26% for the full year.
ICE’s consistent performance and strategic positioning across global financial markets, energy trading, and mortgage technology solutions continue to drive its growth trajectory. The company’s ability to generate strong transaction revenues while building recurring revenue streams demonstrates the resilience of its business model in varying market conditions.
Full presentation:
This article was generated with the support of AI and reviewed by an editor. For more information see our T&C.