Williams Wesley Hastie sells $328k in Cipher Mining shares

Introduction & Market Context
ICG Enterprise Trust PLC (LON:ICGT) presented its results for the 12 months to January 31, 2025, on Thursday, May 8, highlighting solid performance across its private equity portfolio. The trust’s share price closed at 1,182 pence on May 7, up 0.34% ahead of the results announcement.
The presentation revealed a continued focus on resilient private companies with established market positions, particularly in developed markets across North America and Europe. Despite ongoing economic uncertainties, ICG Enterprise Trust maintained its disciplined approach to portfolio management while increasing shareholder distributions.
Executive Summary
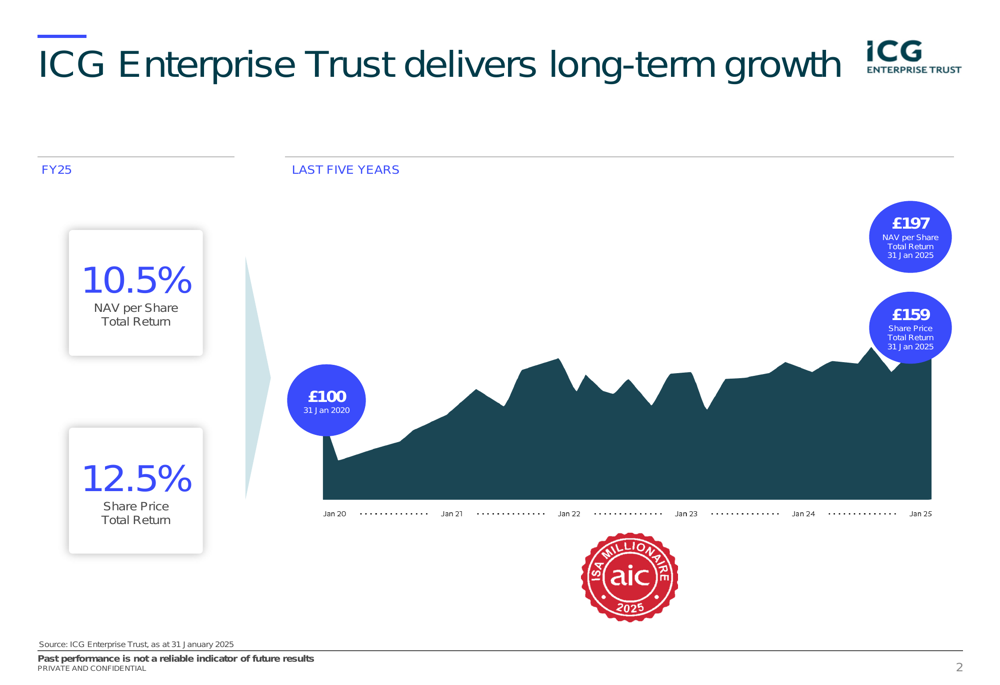
ICG Enterprise Trust delivered a NAV per Share Total (EPA:TTEF) Return of 10.5% and a Share Price Total Return of 12.5% for FY25, continuing its track record of delivering long-term growth for investors. The trust’s portfolio companies demonstrated strong operational performance with LTM EBITDA growth of 15.3%, outpacing the previous year’s 14.2%.
As shown in the following chart, ICG Enterprise Trust has maintained consistent long-term growth performance, with an investment of £100 in January 2020 growing to £197 in NAV per Share Total Return by January 2025:
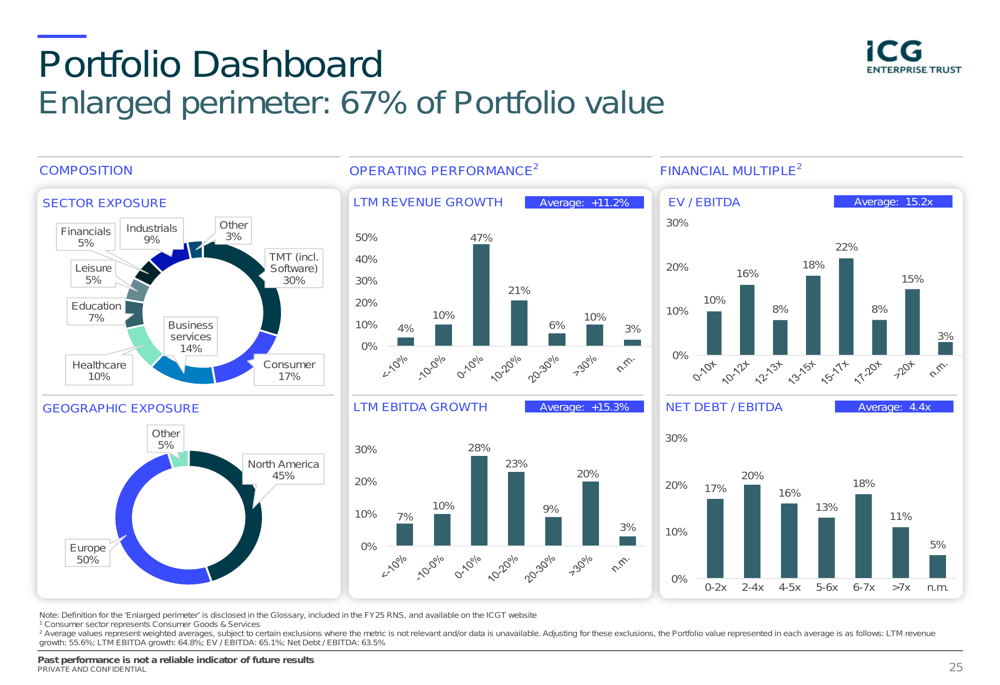
The trust maintained a globally diversified portfolio with 48% exposure to Europe, 46% to North America, and 6% to other regions. By sector, the portfolio maintained significant allocations to TMT (30%), Consumer Goods & Services (18%), and Business Services (12%), positioning it well in growth sectors.
Portfolio Performance Highlights
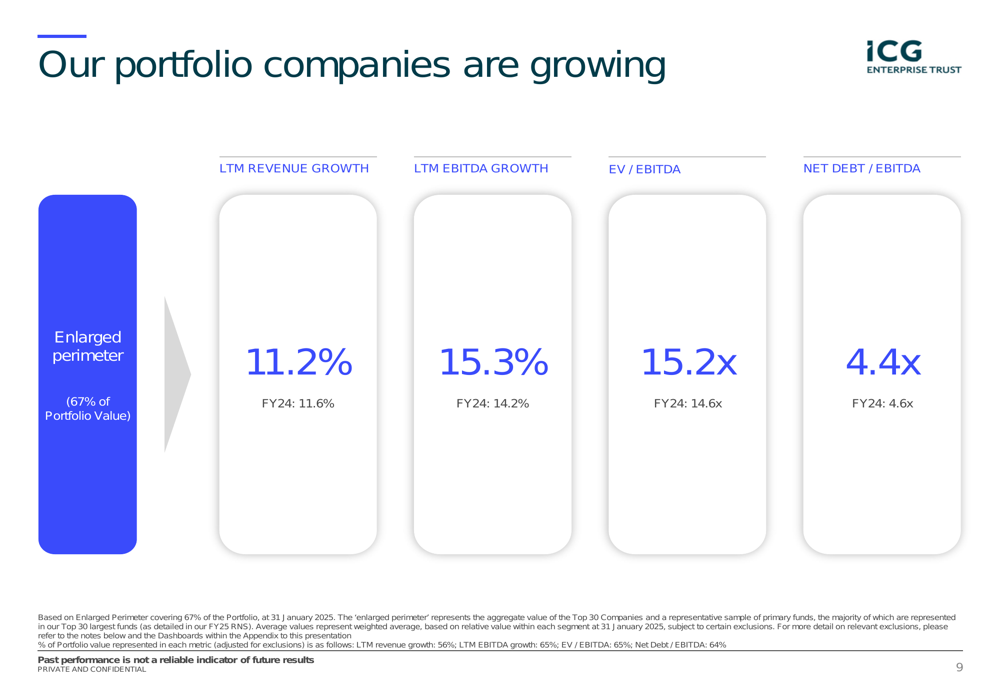
ICG Enterprise Trust’s portfolio companies demonstrated robust operational performance in FY25. Revenue growth reached 11.2%, slightly below the 11.6% reported in FY24, while EBITDA growth accelerated to 15.3% from 14.2% in the previous year. This indicates improving profitability and operational efficiency across the portfolio.
The portfolio valuation metrics showed slight changes, with EV/EBITDA increasing to 15.2x from 14.6x in FY24, while Net Debt/EBITDA improved to 4.4x from 4.6x, suggesting a strengthening balance sheet position across portfolio companies.
The following slide illustrates the key portfolio company growth metrics:
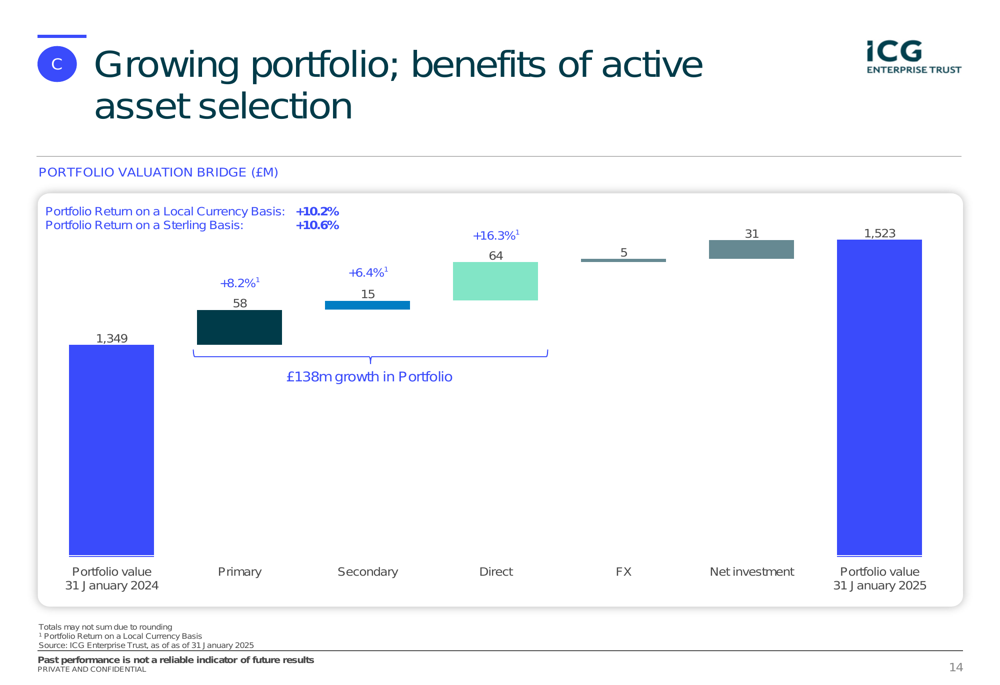
Portfolio growth analysis shows that the portfolio value increased from £1,349 million on January 31, 2024, to £1,523 million on January 31, 2025. This growth was driven by strong performance across all investment routes, with Direct investments contributing the highest return at 16.3%, followed by Primary investments at 8.2% and Secondary investments at 6.4%.
The portfolio valuation bridge below demonstrates how various factors contributed to the overall portfolio growth:
Investment Strategy and Activity
During FY25, ICG Enterprise Trust committed £83 million to new funds, down from £153 million in FY24, reflecting a more selective approach in the current market environment. Total new investments increased to £181 million from £137 million in the previous year.
The trust made commitments to seven funds, including Oak Hill Capital Partners (WA:CPAP), LEEDS Equity Partners, and THOMABRAVO, maintaining its focus on top-tier managers. One commitment was made to ICG-managed funds, totaling $25 million.
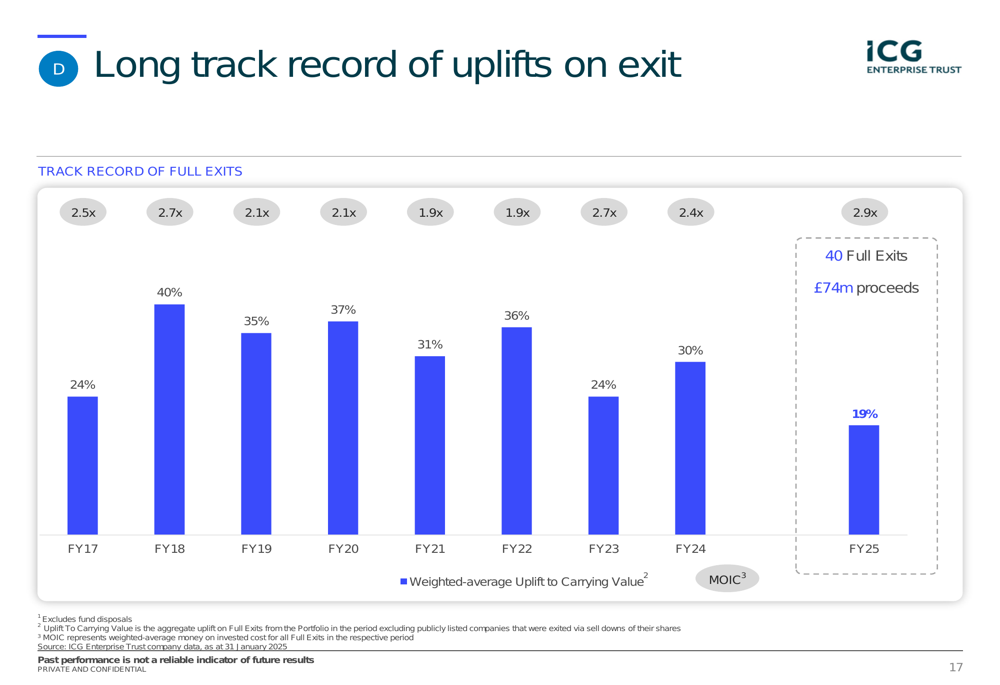
Realizations remained active with total proceeds of £151 million, compared to £239 million in FY24 (which included £68 million from a secondary sale). The 40 full exits achieved during the year generated a weighted average uplift to carrying value of 19%, demonstrating the trust’s ability to create value through its investment cycle.
As shown in the following chart, ICG Enterprise Trust has consistently achieved significant uplifts on exit over time:
The trust continued to actively manage its portfolio through secondary sales, executing a transaction involving eight mature primary fund investments at a 5.5% discount, generating £62 million in net cash proceeds and crystallizing a return of 1.6x invested cost (15% IRR).
Shareholder Returns and Capital Allocation
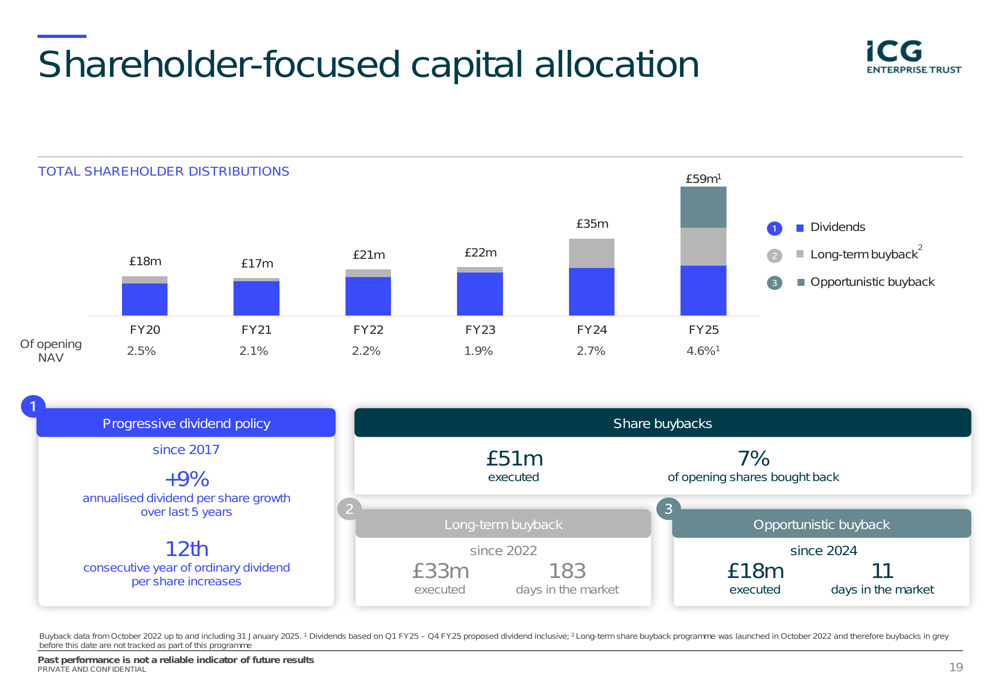
ICG Enterprise Trust maintained its shareholder-focused capital allocation strategy in FY25, with total shareholder distributions reaching £59 million, equivalent to 4.6% of opening NAV. This represents a significant increase from £35 million (2.7% of opening NAV) in FY24.
The trust continued its progressive dividend policy, marking the twelfth consecutive year of ordinary dividend per share increases, with 9% annualized dividend per share growth over the last five years.
Share buybacks were a key component of the capital return strategy, with £51 million executed during the year, representing 7% of opening shares. This approach enhanced NAV per Share by adding 54p, increased trading liquidity, and reduced volatility.
The following chart illustrates the trust’s shareholder distribution strategy over time:
Balance Sheet and Outlook
ICG Enterprise Trust maintained a robust balance sheet position at the end of FY25, with total available liquidity of £232 million, above the five-year average of £179 million. The overcommitment ratio stood at 23%, slightly below the five-year average of 25%, while net gearing remained low at 2%.
This strong balance sheet position provides the trust with flexibility to navigate the current environment and capitalize on potential opportunities, particularly in the secondaries market.
Looking ahead, ICG Enterprise Trust highlighted that it is well-positioned for a wide range of potential outcomes, with its sector positioning, strong origination network, and robust balance sheet providing competitive advantages. The trust’s Investment Committee, with over 60 years of combined industry experience, provides a proven track record of navigating various market cycles.
The portfolio dashboard below provides a detailed overview of the trust’s positioning across sectors and performance metrics:
ICG Enterprise Trust’s focus on resilient companies with established market positions, pricing power, and high-margin business models positions it well to continue delivering value to shareholders in the coming years, despite potential market uncertainties.
Full presentation:
This article was generated with the support of AI and reviewed by an editor. For more information see our T&C.