Bets on October rate-cut overblown as Fed a ’reluctant dove,’ Macquarie warns

Introduction & Market Context
Intercos Spa (BIT:ICOS) presented its first quarter 2025 results on May 7, showing strong revenue and profitability growth despite a challenging market environment. The Italian beauty product manufacturer’s shares closed down 3.12% at €13.48 following the presentation, suggesting investors may have expected even stronger results or were concerned about other factors not directly addressed in the earnings slides.
The company’s Q1 performance builds on its modest revenue beat in Q4 2024, when it slightly exceeded market forecasts with revenue of $284 million. The latest quarterly results show accelerating growth across most business segments and geographic regions.
Quarterly Performance Highlights
Intercos reported Q1 2025 revenue of €250.8 million, representing a 13.4% increase compared to €221.1 million in Q1 2024 at both reported and constant exchange rates. More impressively, adjusted EBITDA jumped 40.6% to €29.3 million from €20.8 million in the prior-year period, with adjusted EBITDA margin expanding 225 basis points to 11.7%.
As shown in the following financial overview chart, the company’s last twelve months (LTM) adjusted EBITDA has steadily increased from €128.5 million in Q1 2024 to €151.8 million in Q1 2025, demonstrating consistent improvement in profitability:
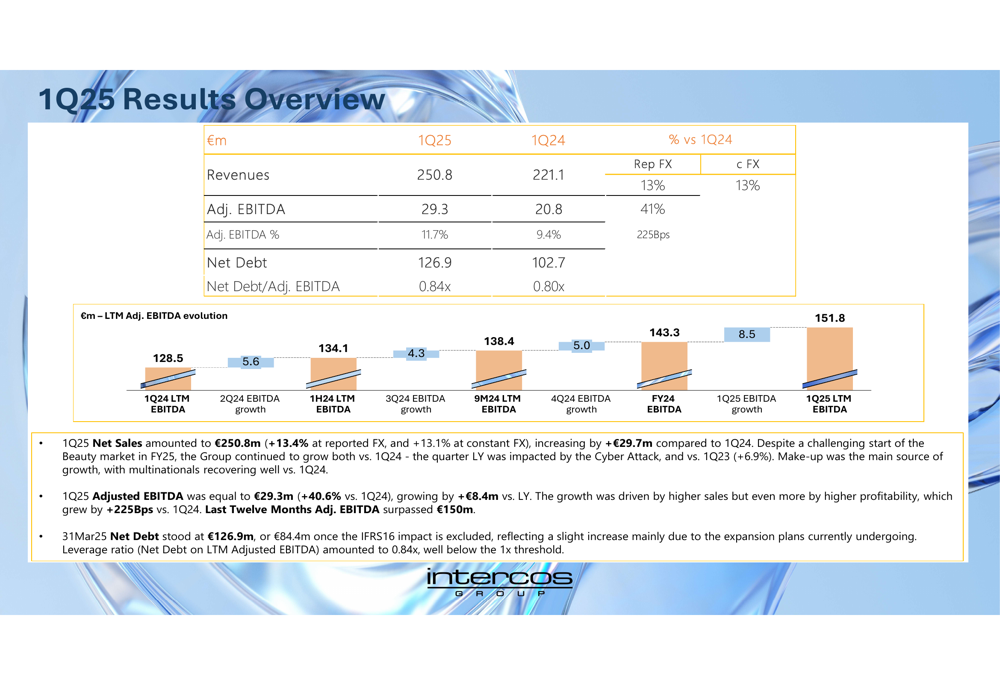
The company’s net debt position increased to €126.9 million as of March 31, 2025, compared to €102.7 million a year earlier. The net debt to adjusted EBITDA ratio remained relatively stable at 0.84x versus 0.80x in Q1 2024, still below the 1.0x threshold and indicating a manageable leverage position. This represents a change from the "below €100 million" net debt level reported at the end of 2024, suggesting increased investments or working capital requirements in the first quarter.
Segment and Regional Analysis
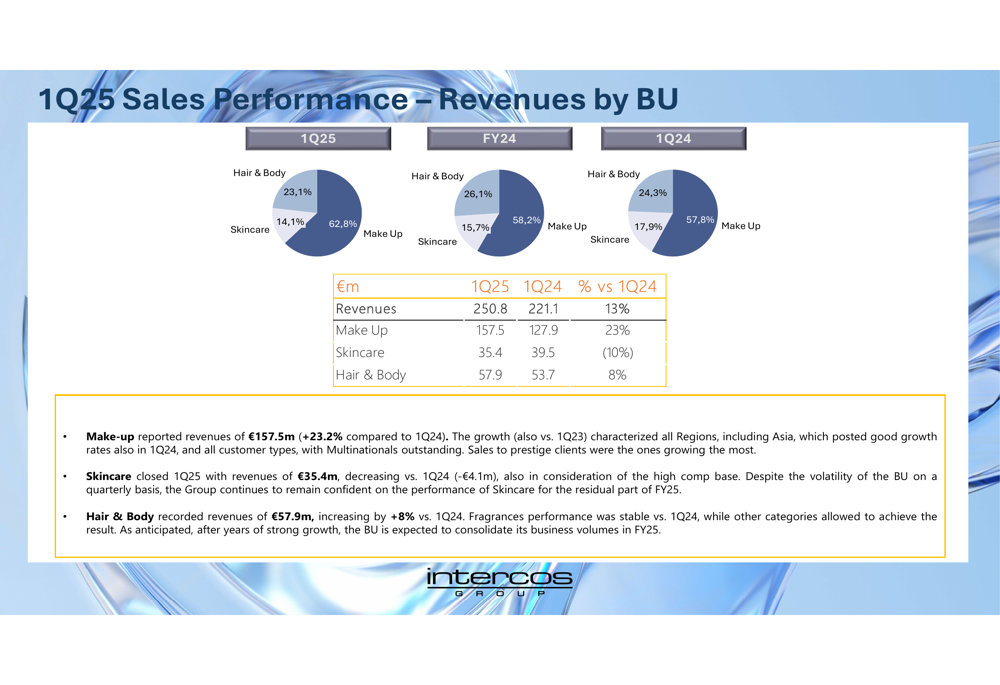
Intercos’s business unit performance showed significant variation across segments. The Make Up division, which accounts for the largest portion of revenue, delivered exceptional growth of 23.2% year-over-year, reaching €157.5 million in Q1 2025. The Hair & Body segment also performed well with 8% growth to €57.9 million. However, the Skincare segment experienced a 10% decline to €35.4 million compared to Q1 2024.
The following breakdown illustrates the revenue contribution from each business unit:
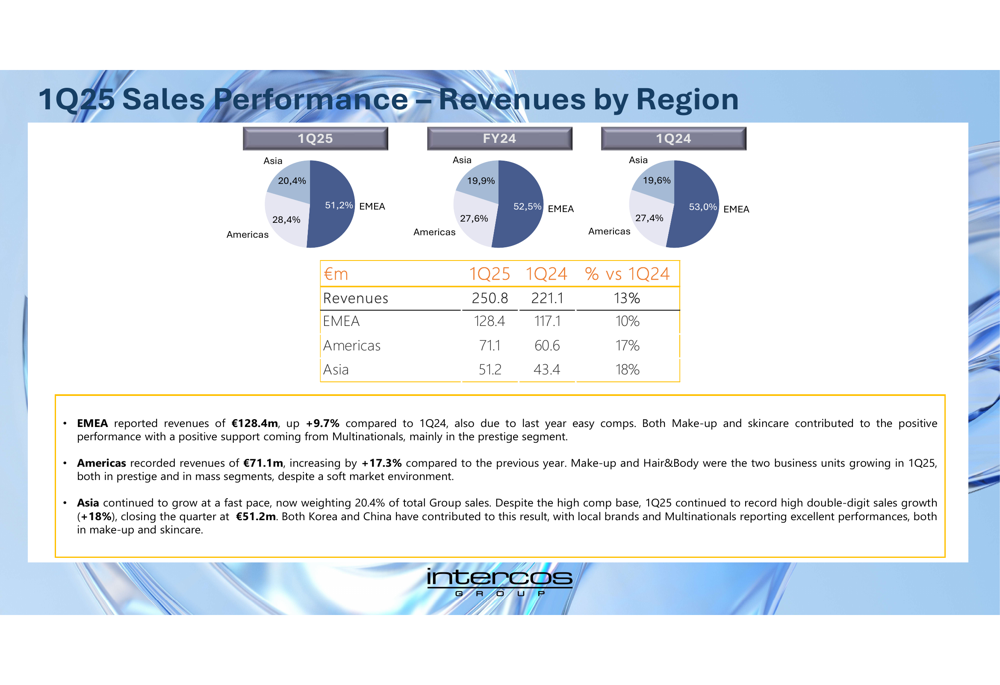
From a geographic perspective, Intercos achieved growth across all major regions, with Asia and the Americas leading the way. The Americas region grew 17.3% to €71.1 million, while Asia increased 18% to €51.2 million. The EMEA region, which represents the largest portion of revenue, grew 9.7% to €128.4 million.
This regional performance is particularly noteworthy given the challenges in the Chinese market mentioned in the company’s previous earnings report. The strong growth in Asia suggests either improvement in the Chinese market or compensatory growth in other Asian countries.
The geographic revenue breakdown is illustrated in the following chart:
Customer Diversification
One of the most striking aspects of Intercos’s Q1 performance was the significant growth in sales to multinational customers, which increased 28.2% year-over-year to €129.1 million. This segment now represents the largest portion of the company’s revenue. Meanwhile, sales to retailers grew 15.5% to €16.1 million, while revenue from emerging brands remained relatively stable at €105.6 million, a slight 1% decrease from Q1 2024.
The following chart shows the revenue breakdown by customer type:
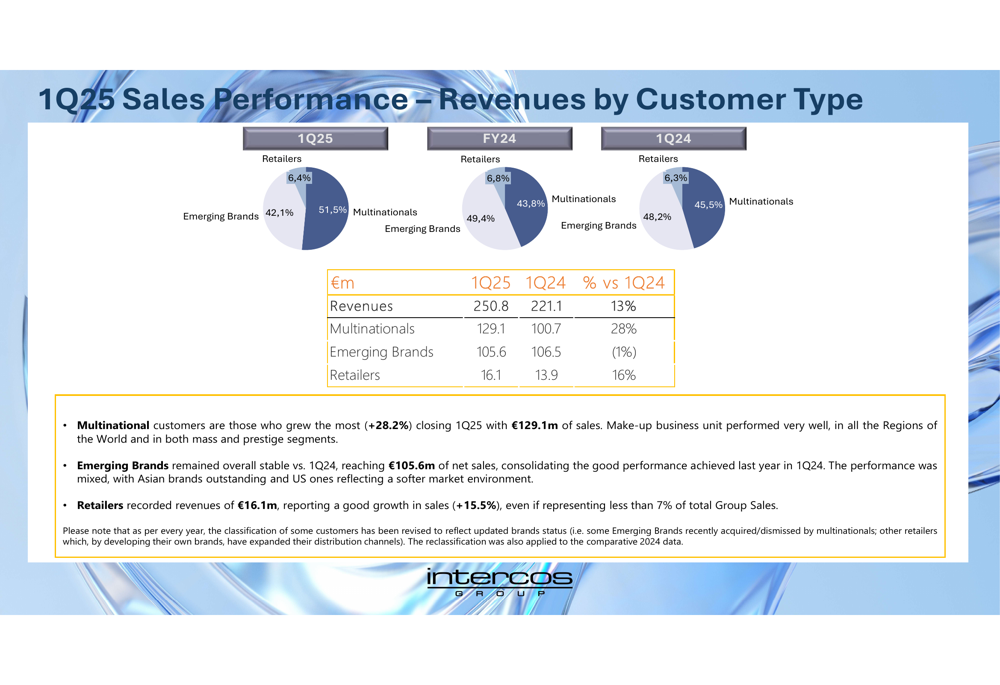
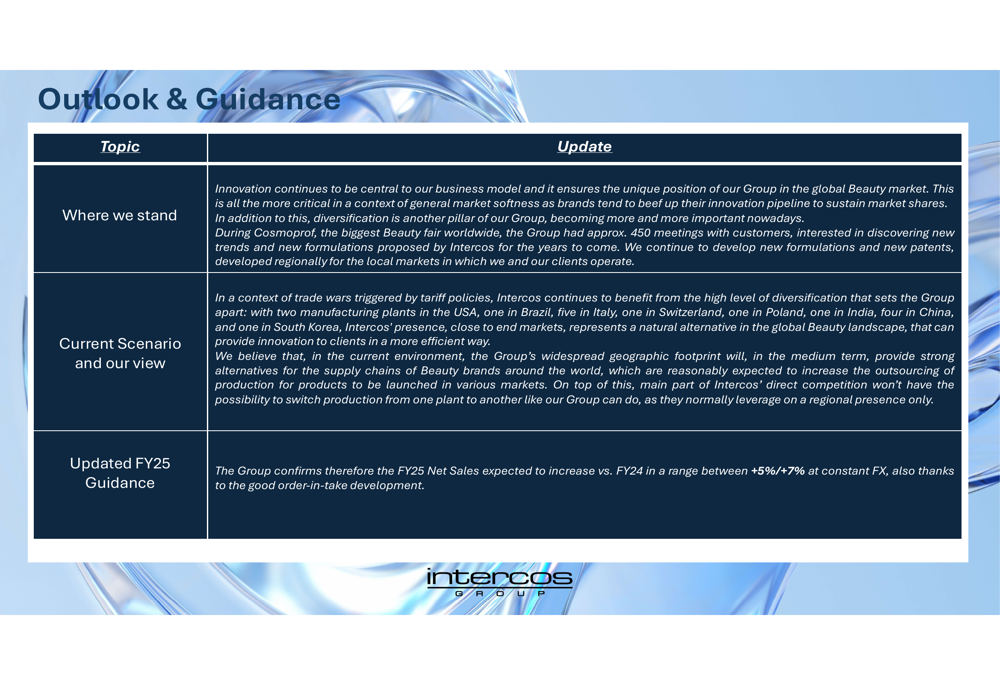
This customer diversification aligns with the company’s strategy of maintaining a balanced portfolio to mitigate risks. As noted in the outlook section of the presentation, "In a context of trade wars triggered by tariff policies, Intercos continues to benefit from the high level of diversification that sets the Group apart."
Forward-Looking Statements
Despite the strong Q1 results, Intercos maintained its previous guidance for fiscal year 2025, projecting net sales growth of 5-7% at constant exchange rates compared to FY 2024. This relatively conservative outlook may have contributed to the negative stock price reaction on the day of the presentation.
The company emphasized that innovation continues to be central to its business model, which aligns with CEO Renato Semerari’s previous statement that "During crisis periods, clients look for innovation even more."
The outlook and guidance section highlights the company’s strategic focus:
While the presentation doesn’t specifically address the challenges in the Chinese market and declining U.S. retail volumes mentioned in the previous earnings report, the strong performance in both Asia and the Americas regions suggests these issues may be less severe than previously anticipated or have been offset by growth in other areas.
Overall, Intercos’s Q1 2025 results demonstrate robust performance across most segments and regions, with particularly strong growth in the Make Up division and sales to multinational customers. The significant expansion in EBITDA margin indicates improved operational efficiency, though the increase in net debt and conservative full-year guidance may warrant attention from investors in the coming quarters.
Full presentation:
This article was generated with the support of AI and reviewed by an editor. For more information see our T&C.