Raymond James raises Fulgent Genetics stock price target to $36 on strong performance

Introduction & Market Context
Intercos (BIT:ICOS) presented its third quarter and nine-month 2025 results on November 6, highlighting a continued focus on profitability amid challenging market conditions. The cosmetics manufacturer saw its stock price decline by 1.06% following the announcement, closing at €11.32, significantly below its 52-week high of €15.26.
The presentation revealed a company navigating a complex global beauty market, with volatility in the U.S., promotional dependency in China, and a strategic pivot toward higher-margin business segments. Despite these headwinds, Intercos maintained its full-year guidance and emphasized operational improvements that supported margin expansion.
Quarterly Performance Highlights
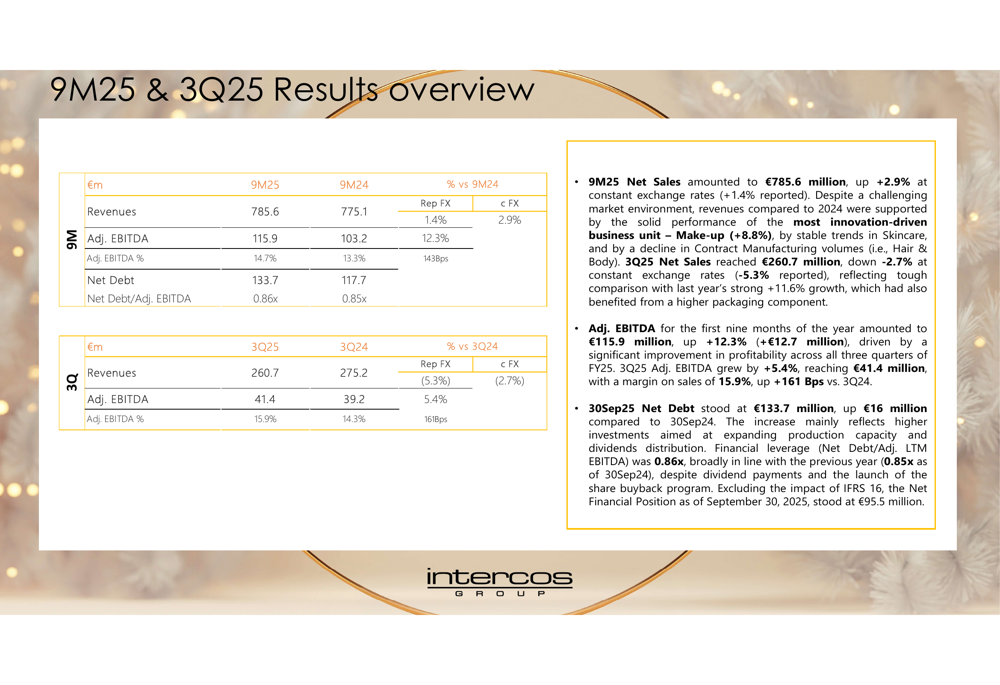
Intercos reported mixed results for Q3 2025, with revenues declining by 5.3% on a reported basis (2.7% at constant exchange rates) to €260.7 million. However, the company’s profitability metrics showed improvement, with Adjusted EBITDA increasing by 5.4% to €41.4 million and EBITDA margin expanding to 15.9%.
For the nine-month period, the company delivered more balanced results with revenues reaching €785.6 million, representing growth of 1.4% reported and 2.9% at constant exchange rates. Adjusted EBITDA for the nine-month period showed strong improvement, increasing by 12.3% to €115.9 million compared to €103.2m in the same period of 2024.
As shown in the following overview of 9M25 profitability trends:
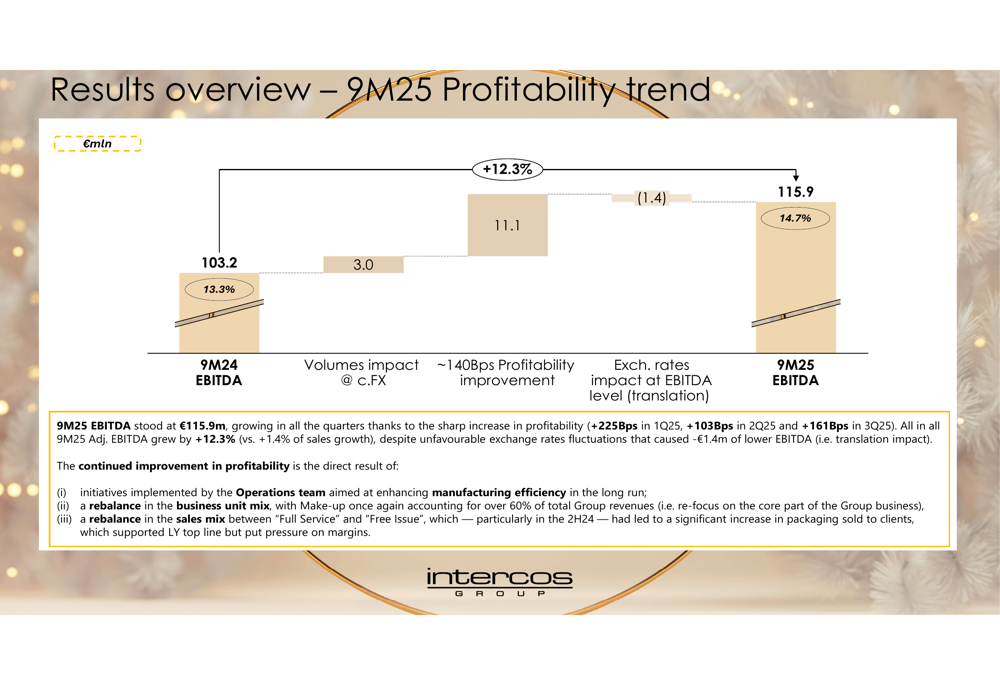
The company attributed its EBITDA improvement to several factors, including operational initiatives, a more favorable business unit mix with Make-up now accounting for over 60% of revenue, and a rebalanced sales mix between "Full Service" and "Free Issue" offerings. Volume impacts contributed €3.0 million to profitability, while exchange rates had a negative impact of €1.4 million.
The comprehensive financial results for both the quarter and nine-month period are detailed in this table:
Business Unit Performance
Intercos’s business unit performance revealed significant shifts in its revenue composition. The Make-up segment emerged as the clear growth driver, increasing by 8.8% in the first nine months of 2025 to reach €495.0 million, now representing 63.0% of total revenue compared to 58.7% in the same period of 2024.
In contrast, the Hair & Body segment experienced a substantial decline of 13.1% in 9M25, with revenues falling to €169.4 million and its share of total revenue decreasing from 25.1% to 21.6%. The Skincare segment also contracted slightly, with revenues of €121.2 million representing a 15.4% share of total revenue.
The following breakdown illustrates these shifts in business unit performance:
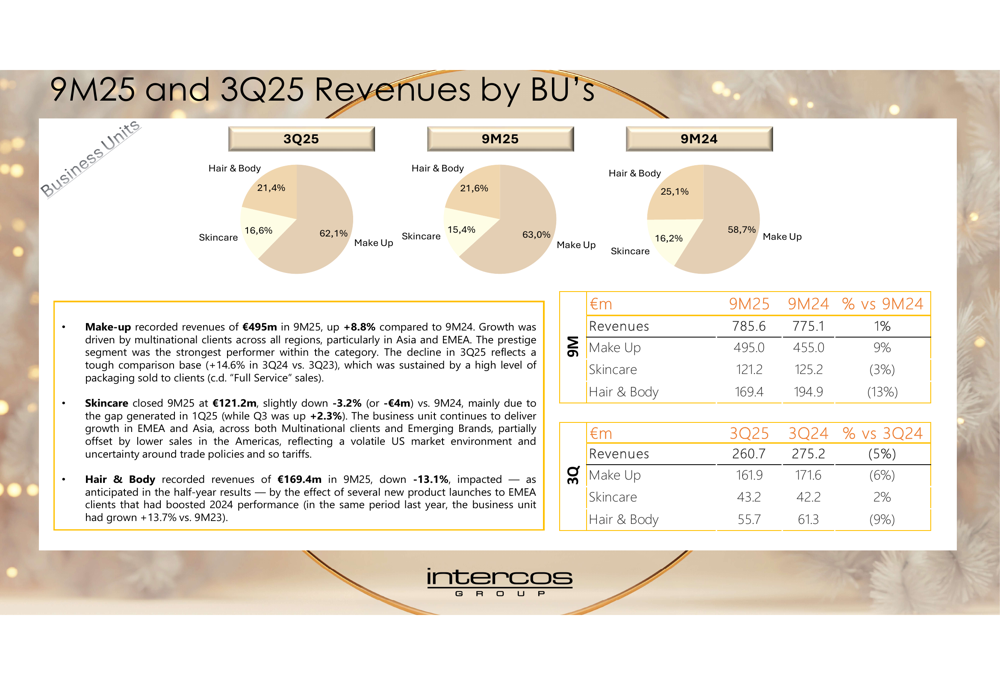
This rebalancing toward the Make-up segment aligns with the company’s strategic focus on higher-margin categories, as mentioned in the earnings call where CEO Renato Semerari emphasized a return to profitability levels comparable to 2019.
Geographic and Customer Analysis
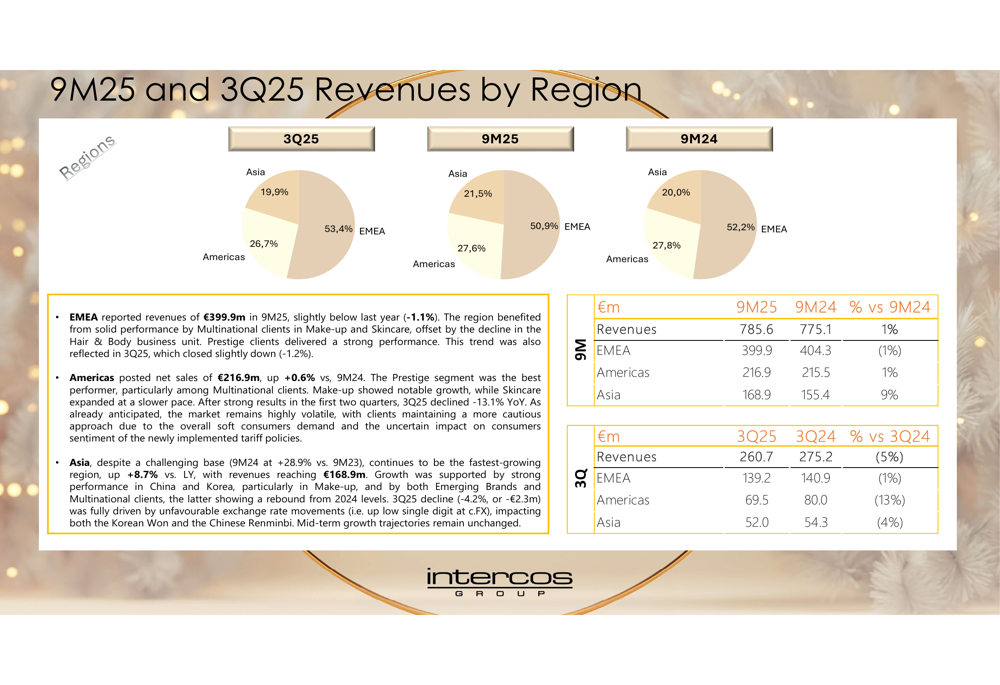
From a geographic perspective, Asia continued to be Intercos’s fastest-growing region with 9M25 revenue increasing by 8.7% to €168.9 million, now representing 21.5% of total revenue compared to 20.0% in the same period of 2024. This growth comes despite what the company described as a challenging base from the previous year.
The EMEA region remained the largest contributor to revenue at €399.9 million (50.9% of total), though this represented a slight decline from the previous year. The Americas region showed modest growth, reaching €216.9 million or 27.6% of total revenue.
The regional revenue distribution is visualized in the following chart:
Equally significant was the shift in customer mix, with Multinational customers showing strong growth of 12.6% in 9M25 to reach €392.6 million, now accounting for 50.0% of total revenue compared to 45.0% in the prior year. Conversely, revenue from Emerging Brands declined by 9.9% to €341.1 million, reducing their share from 48.9% to 43.4% of total revenue.
The following breakdown illustrates this customer segment shift:
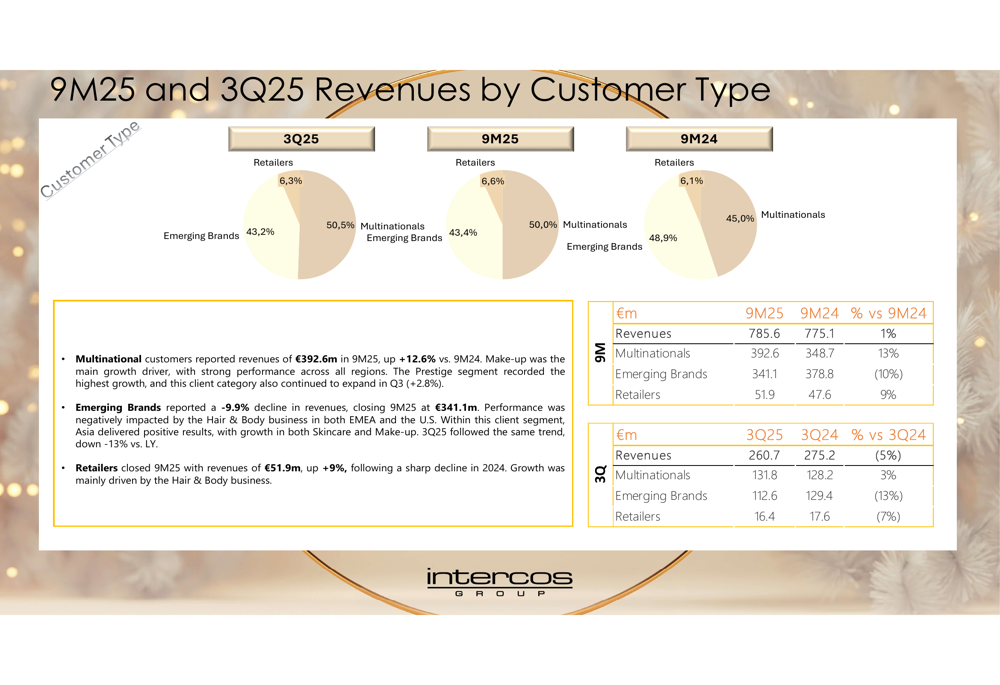
This rebalancing toward Multinational customers may reflect a strategic pivot toward more stable, larger clients in an uncertain economic environment, though the company did not explicitly state this rationale in the presentation.
Strategic Initiatives & Outlook
Intercos highlighted several strategic initiatives in its presentation, including expansion of manufacturing capacity in Asia. The company doubled the size of its South Korean plant and expanded one of its Chinese facilities, underscoring its commitment to the Asian market despite current challenges.
The company also launched a share buyback program, though specific details were not provided in the presentation materials.
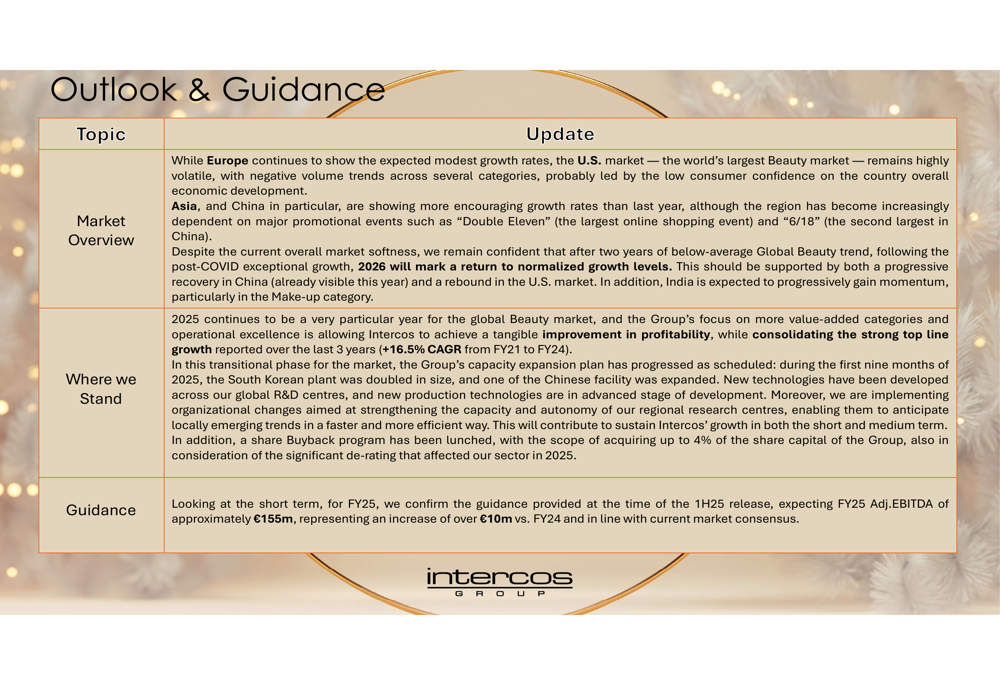
Looking forward, Intercos confirmed its full-year guidance for FY25, projecting Adjusted EBITDA of approximately €155 million. The company expressed confidence in a return to normalized growth levels in 2026, while acknowledging that 2025 remains a "specific year" with continued focus on value-added categories and operational excellence.
The company’s outlook is summarized in the following slide:
Forward-Looking Statements
Intercos characterized the current market environment as challenging but with signs of improvement. The U.S. market remains volatile, while Asia—particularly China—shows encouraging growth, albeit heavily reliant on promotional events.
The company’s guidance suggests flat sales for 2025 but maintained EBITDA margins, consistent with CEO Semerari’s comments during the earnings call about prioritizing profitability over revenue growth. His statement that "The era of extreme globalization is over" indicates a strategic shift toward more targeted regional approaches and potentially more localized supply chains.
With a net debt of €133.7 million and a Net Debt/Adjusted EBITDA ratio of 0.86x, Intercos maintains a relatively strong balance sheet position to weather current market challenges while investing in strategic growth areas, particularly in Asia.
The company’s focus on operational excellence and margin improvement appears to be yielding results, as evidenced by the 140 basis point improvement in EBITDA margin despite revenue headwinds. Investors will likely be watching closely to see if this profitability focus can be maintained while returning to revenue growth in 2026 as the company projects.
Full presentation:
This article was generated with the support of AI and reviewed by an editor. For more information see our T&C.