Nvidia’s results, Indian tariffs, French markets - what’s moving markets

Introduction & Market Context
JOST Werke SE (FRA:JST) presented its Q1 2025 earnings results on May 15, showing significant growth driven primarily by its recent acquisition of Hyva. The company reported a 25% increase in sales to €374 million, though organic sales declined by 9% compared to Q1 2024 due to challenging market conditions.
The quarter was marked by contrasting regional performance, with signs of market stabilization in Europe and Asia, while the Americas region faced headwinds from uncertain tariff and trade regulations. The company’s January 31st completion of the Hyva acquisition has substantially transformed JOST’s business profile, expanding its presence in the hydraulics segment and increasing its exposure to the APAC region.
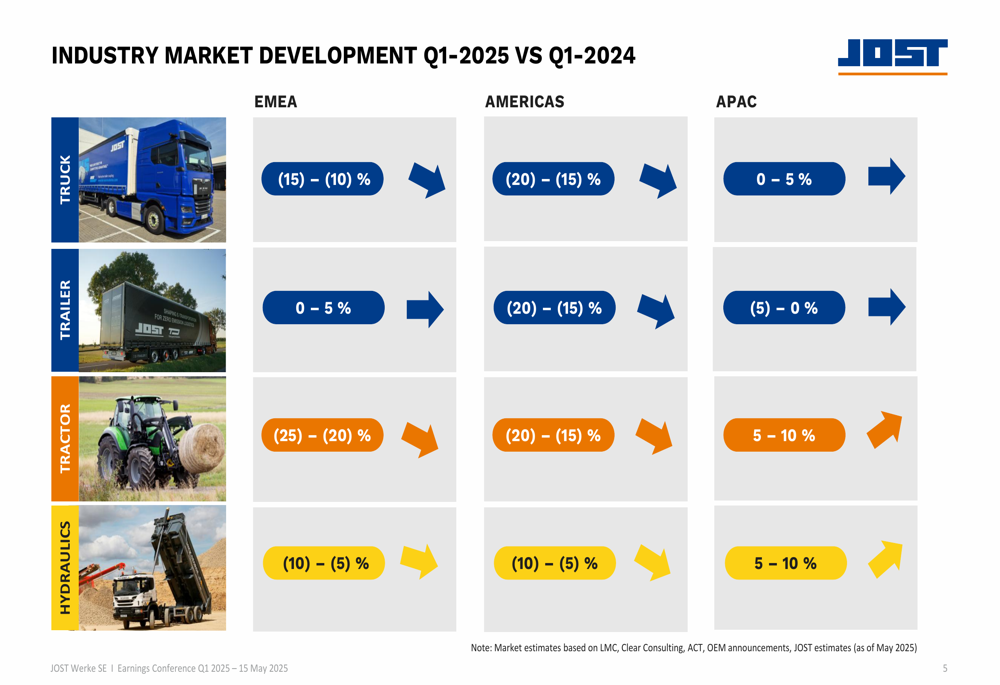
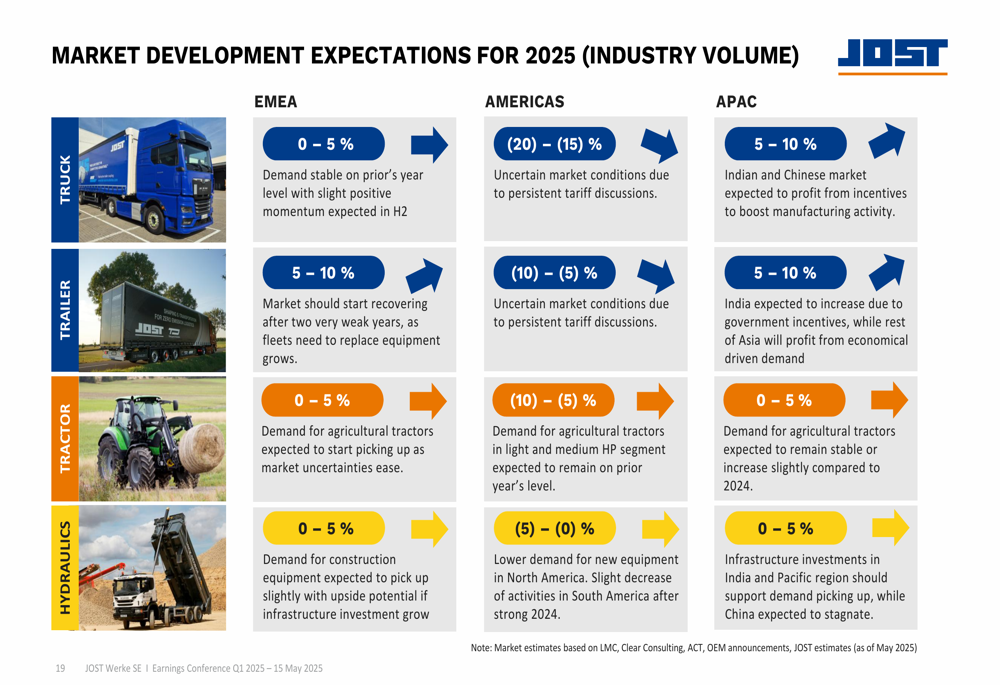
As shown in the following chart of industry market development, JOST faced varying conditions across different regions and product categories in Q1 2025:
Quarterly Performance Highlights
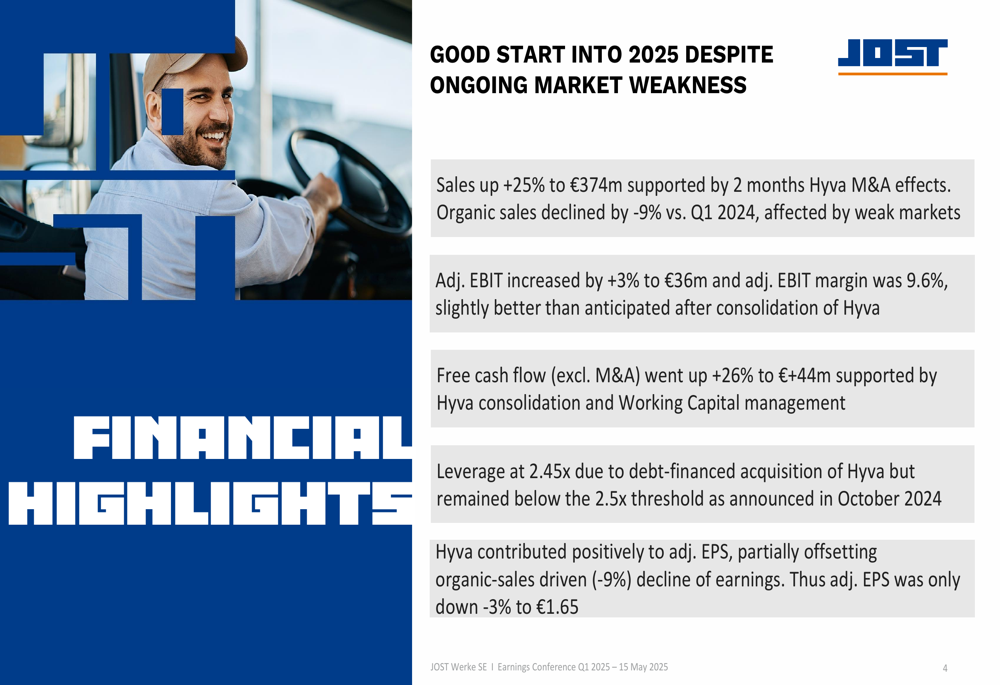
Despite organic sales challenges, JOST managed to increase its adjusted EBIT by 3% to €36 million, with an adjusted EBIT margin of 9.6%. Free cash flow (excluding M&A) grew by 26% to €44 million, supported by the Hyva consolidation and effective working capital management.
The company’s financial highlights for the quarter demonstrate the significant impact of the Hyva acquisition on overall performance:
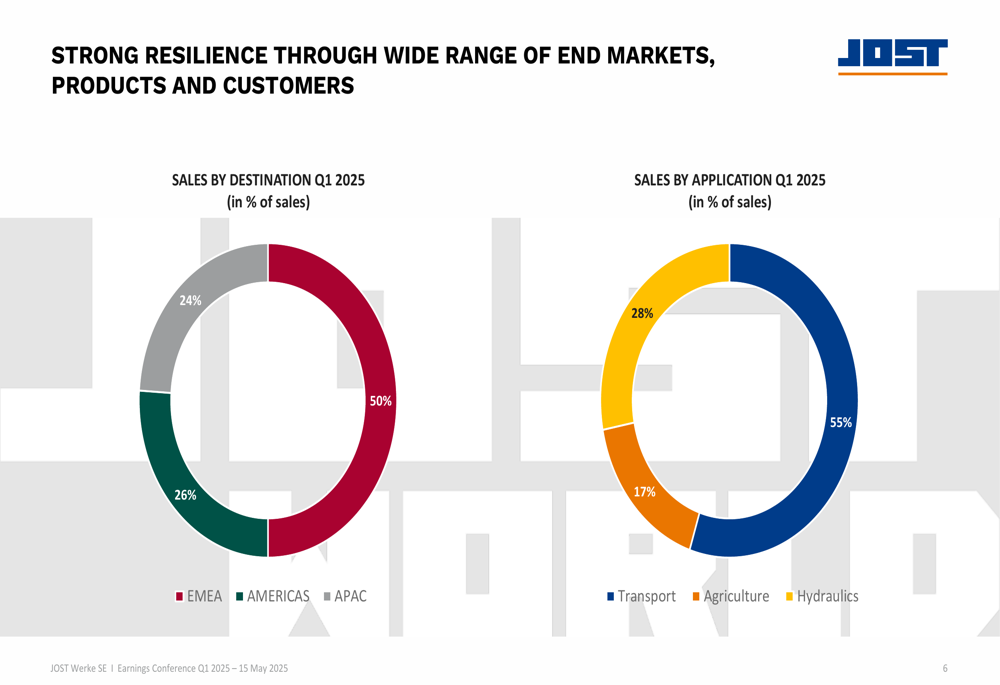
The acquisition has dramatically shifted JOST’s sales distribution, with APAC now representing 50% of sales by destination, followed by Americas (26%) and EMEA (24%). By application, transport remains the largest segment at 55%, followed by agriculture (28%) and hydraulics (17%).
The following chart illustrates this new sales distribution:
Regional Performance Analysis
JOST’s performance varied significantly across its three main regions:
In EMEA, sales increased by 15% to €188 million, driven by a €34 million contribution from Hyva. However, organic sales declined by 5.7%, and adjusted EBIT fell by 23.7% to €11.4 million, resulting in a margin of 6.1%. The company noted slight momentum in order intake and signs of market stabilization, particularly in the trailer sub-segment.
The Americas region saw sales grow by 8.4% to €98 million, with Hyva contributing €22 million. Organic sales declined by 15.8%, but adjusted EBIT increased by 14% to €10.6 million, with margins improving to 10.8%. This strong profitability was attributed to significant growth in aftermarket sales, which offset the decline in OEM business.
APAC experienced the most dramatic growth, with sales nearly doubling (up 97.3%) to €87 million. Hyva contributed €47 million, while organic sales declined by 7.5%. Adjusted EBIT increased by 50.7% to €12.8 million, though the margin decreased to 14.9% from 19.1% in Q1 2024.
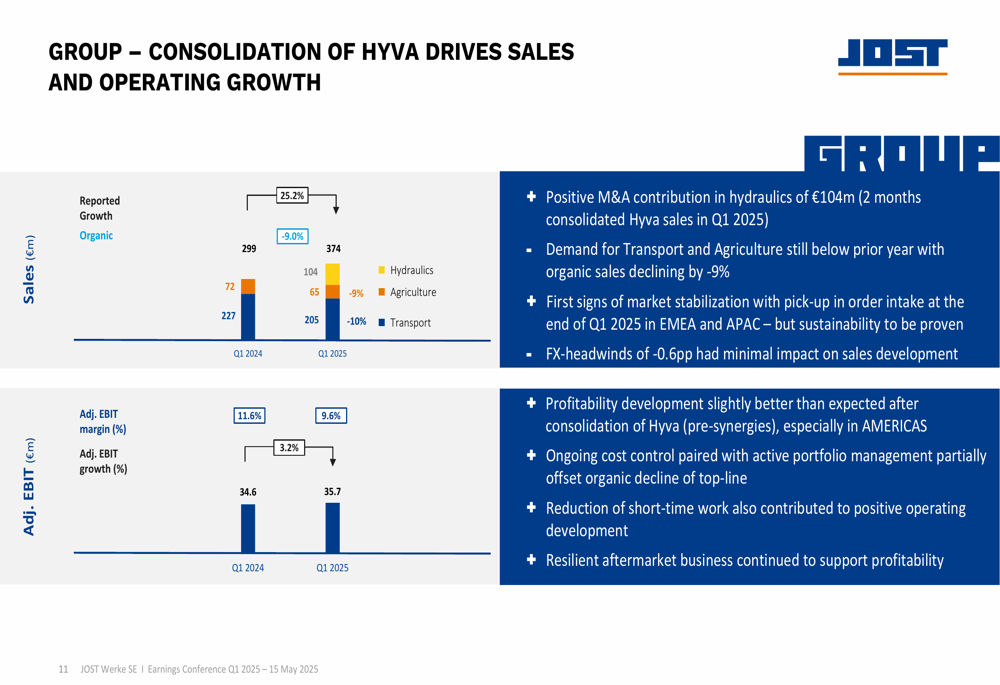
The following chart provides a comprehensive overview of the group’s performance:
Hyva Integration Progress
JOST reported that the post-merger integration of Hyva is proceeding according to plan. The company has identified €27 million in annual EBIT synergies with high confidence and noted positive customer and market response to the acquisition.
The integration involves 30 PMI teams with 270 people worldwide, with one-off integration costs expected to range between €12-24 million. The company highlighted strong R&D potential for digital solutions as a result of the combined expertise.
On the financing front, JOST successfully replaced the bridge financing for the Hyva acquisition with a €320 million promissory note loan issued on April 30, 2025. The loan was oversubscribed and placed at the lower end of the offered margin, with tranches having terms of 3, 5, and 7 years, creating a balanced maturity profile.
Despite the debt-financed acquisition, JOST’s leverage ratio stood at 2.45x, remaining below the 2.5x threshold announced in October 2024. The company’s net debt increased from €128 million at the end of 2024 to €451 million as of March 31, 2025.
Financial Position and Outlook
JOST’s adjusted net income remained relatively stable at €25 million (Q1 2024:€25 million), with adjusted EPS of €1.65 (Q1 2024:€1.70). The slight decline of 3% in adjusted EPS was attributed to the organic sales decrease, partially offset by Hyva’s positive contribution.
The company’s cash flow performance was strong, with a cash conversion rate of 1.8 (Q1 2024:1.4), well above the long-term target of ≥1. Capital expenditure was maintained at 1.8% of sales.
As shown in the following chart, JOST has confirmed its outlook for fiscal year 2025:
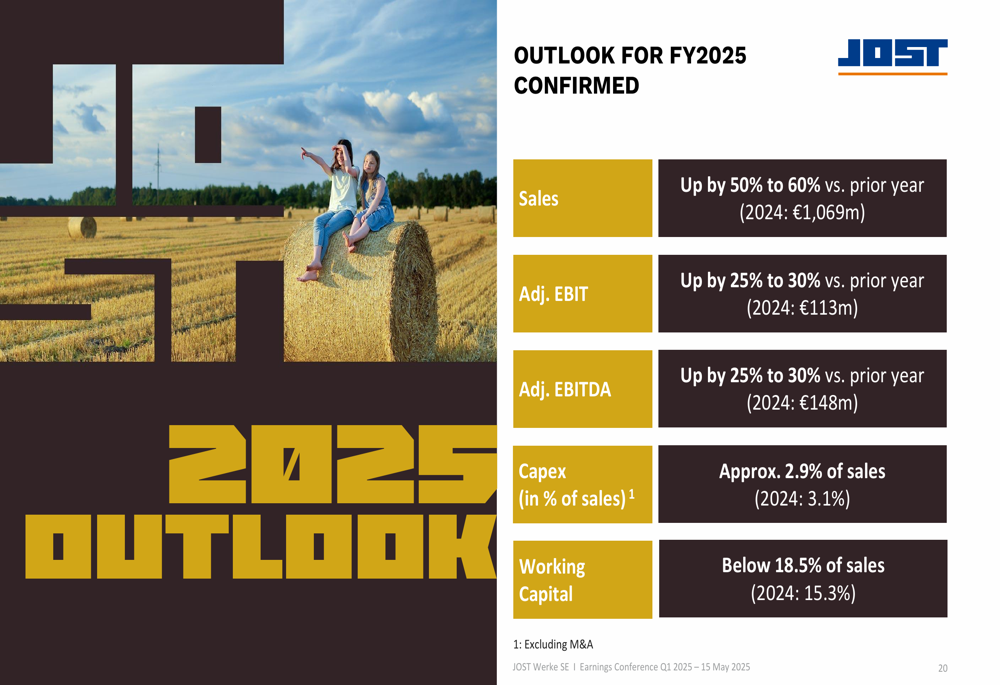
The company expects market conditions to improve across most regions and product categories for the remainder of 2025, with the exception of the Americas, where uncertainties related to tariffs continue to impact market sentiment:
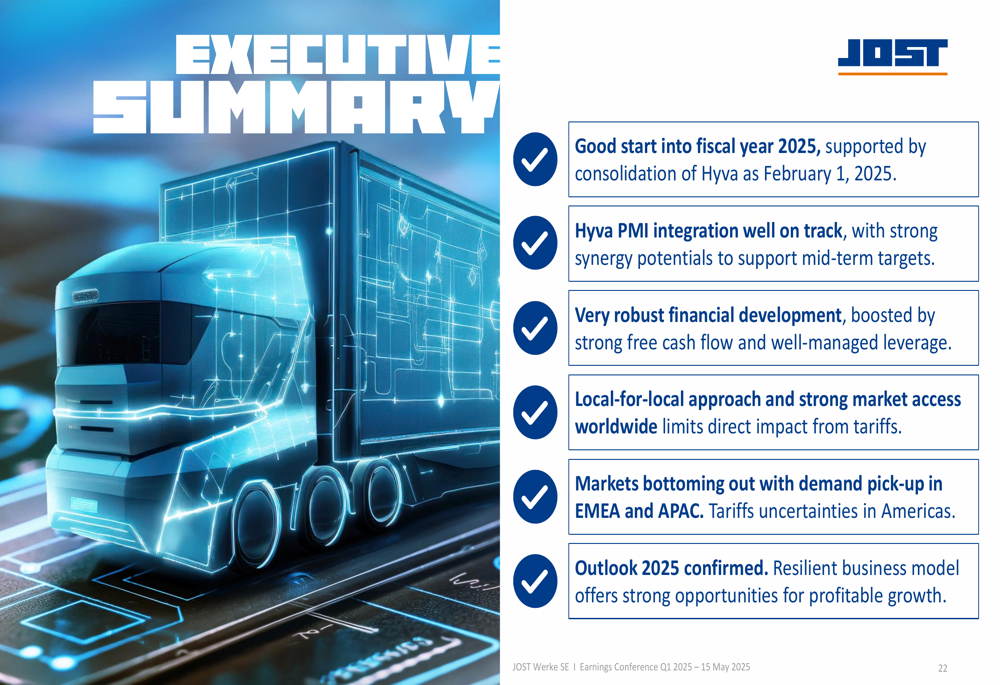
In its executive summary, JOST emphasized its resilient business model and strong opportunities for profitable growth, highlighting that its local-for-local approach and strong market access worldwide limits direct impact from tariffs:
JOST Werke shares closed at €54.60 on May 14, 2025, down 1.44% ahead of the earnings presentation. The stock has traded between €37.55 and €55.80 over the past 52 weeks.
Full presentation:
This article was generated with the support of AI and reviewed by an editor. For more information see our T&C.