Raymond James raises Fulgent Genetics stock price target to $36 on strong performance

Introduction & Market Context
Kimball Electronics (NASDAQ:KE) presented its first quarter fiscal 2026 results on November 6, 2025, revealing a company navigating sector-specific challenges while successfully improving profitability metrics. Despite reporting a 2% year-over-year revenue decline, the company significantly outperformed earnings expectations with adjusted EPS of $0.49, nearly doubling the $0.27 analyst forecast.
The market response was unexpectedly negative, with KE shares falling 7.83% following the announcement, closing at $30.38. This reaction came despite the company’s improved margins, reduced debt levels, and seventh consecutive quarter of positive cash flow.
Quarterly Performance Highlights
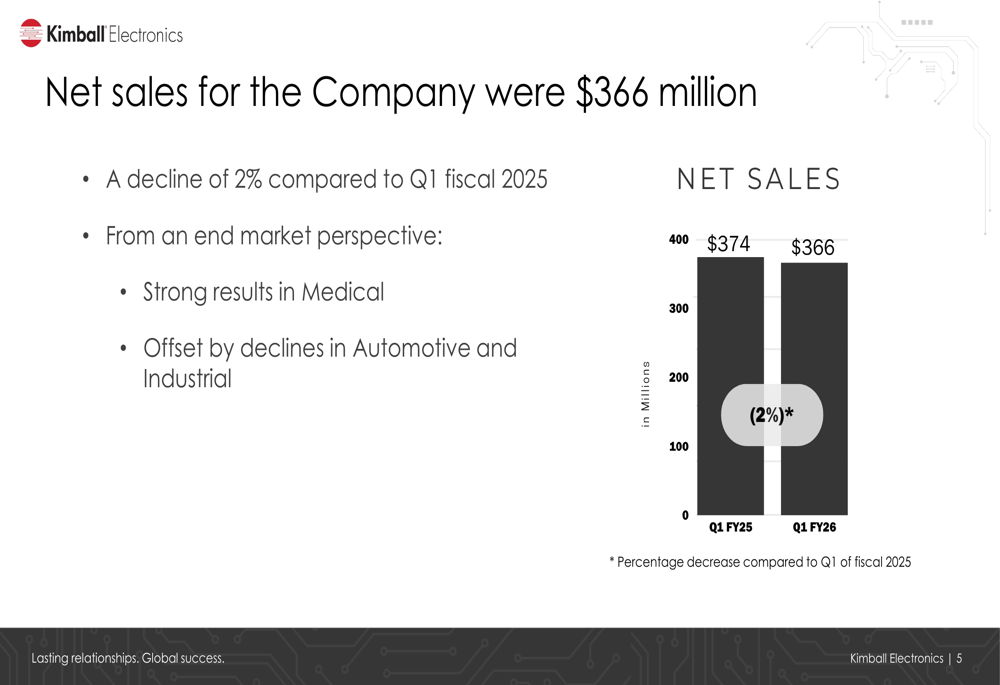
Kimball Electronics reported Q1 FY2026 net sales of $366 million, representing a 2% decline from the $374 million reported in the same period last year. However, the company’s profitability metrics showed marked improvement.
As shown in the following chart of quarterly revenue:
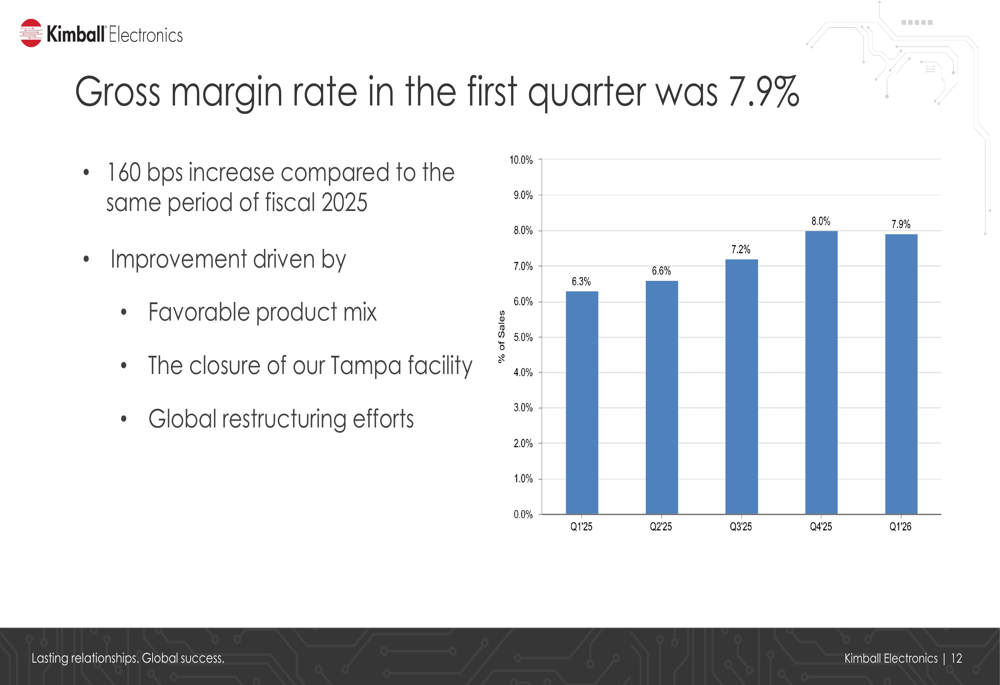
Gross margin expanded significantly to 7.9%, a 160 basis point increase compared to Q1 FY2025. This improvement was driven by a favorable product mix, the closure of the Tampa facility, and ongoing global restructuring efforts.
The following chart illustrates this margin improvement:
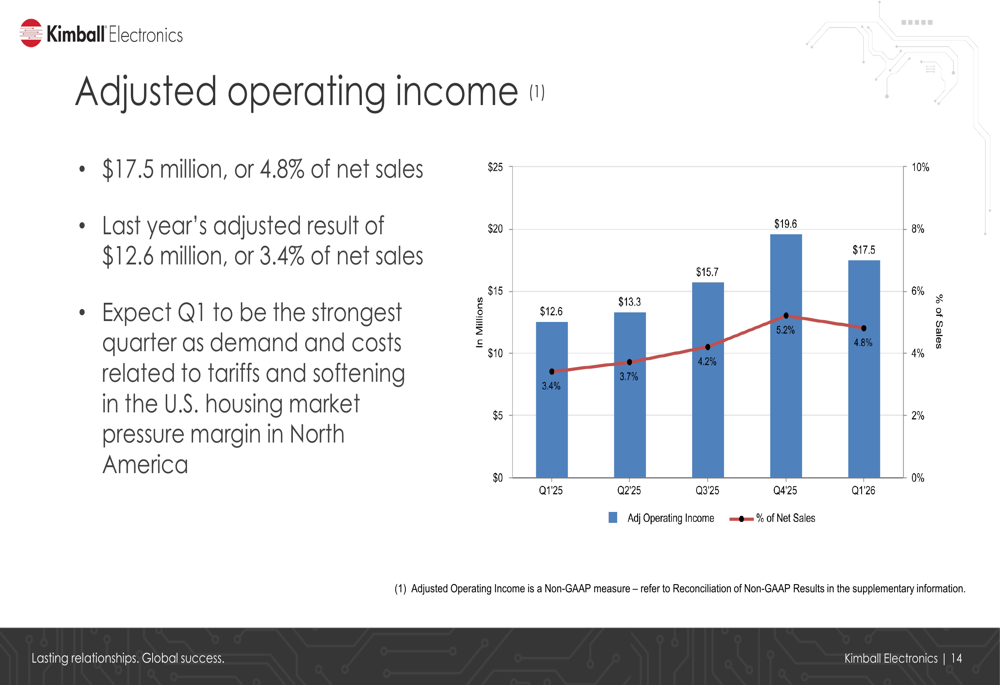
Adjusted operating income reached $17.5 million or 4.8% of net sales, compared to $12.6 million or 3.4% of net sales in the prior year period, demonstrating the company’s enhanced operational efficiency.
This operating income trend is visualized below:
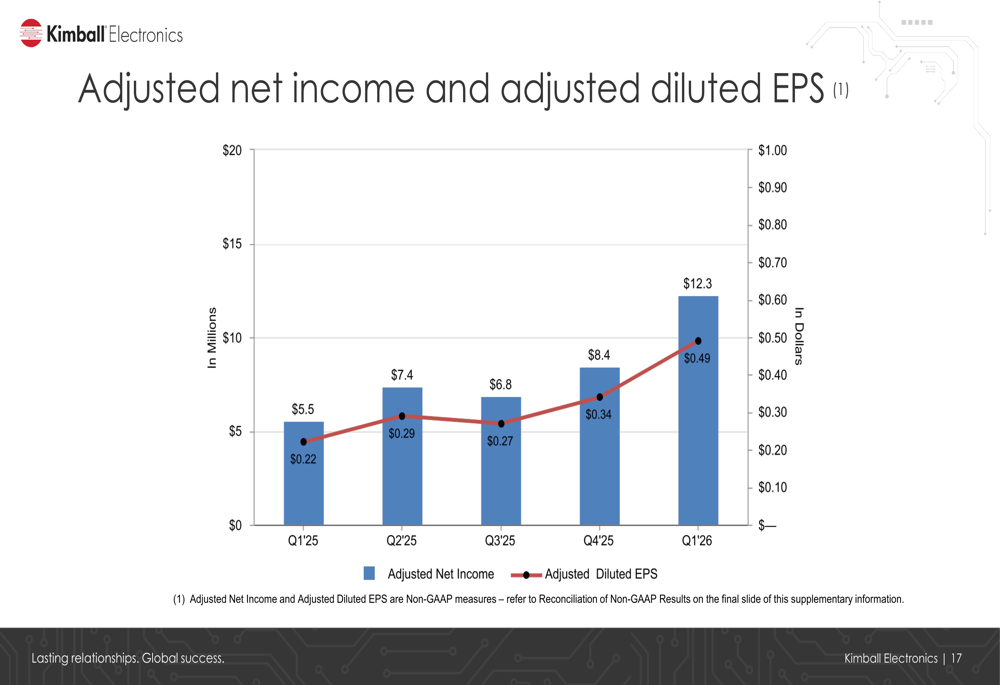
Adjusted net income and diluted EPS also showed substantial growth, with EPS reaching $0.49 compared to $0.22 in Q1 FY2025:
Segment Analysis
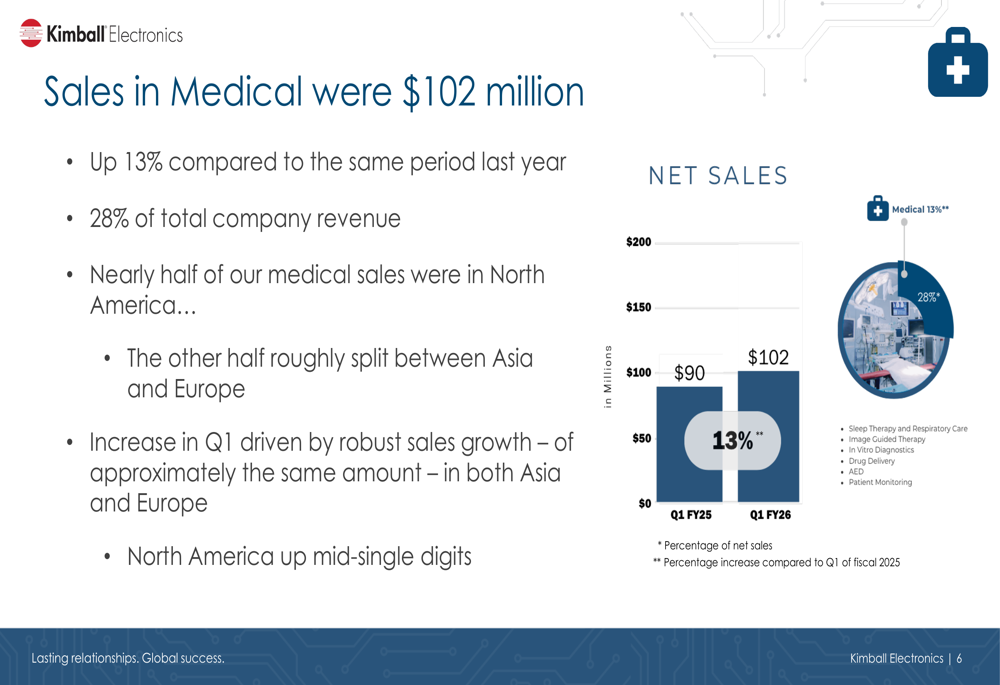
The medical segment emerged as the standout performer, with sales reaching $102 million, a robust 13% increase year-over-year. This vertical now represents 28% of Kimball’s total revenue, with growth distributed across geographic regions.
The following chart details the medical segment’s performance:
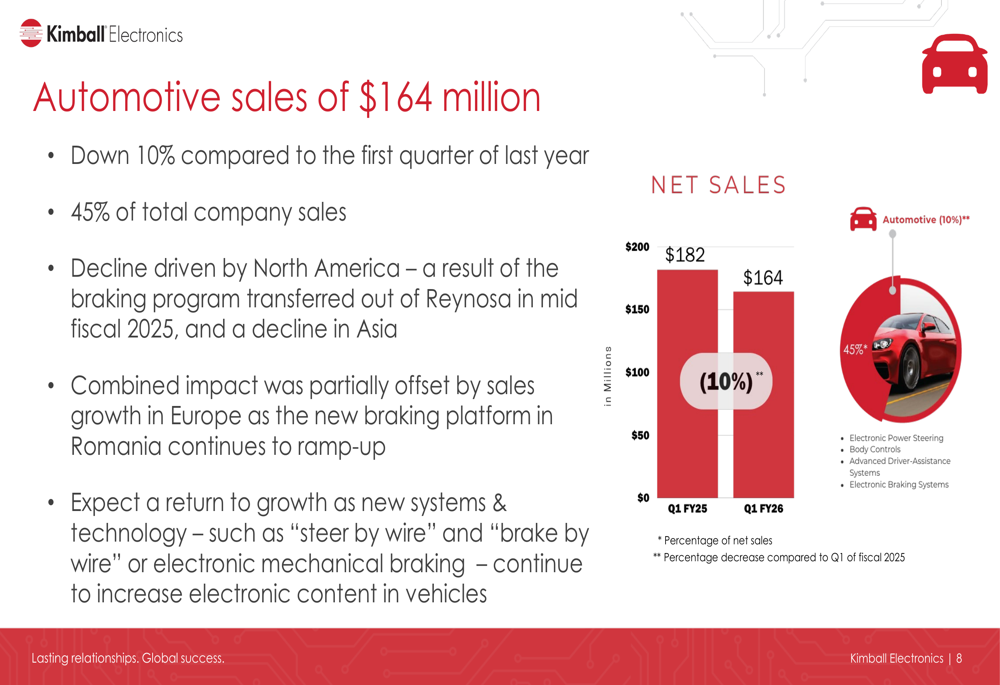
In contrast, the automotive segment—Kimball’s largest at 45% of total revenue—experienced a 10% decline to $164 million. This decrease was primarily attributed to a braking program transfer in North America and weaker demand in Asia, partially offset by growth in Europe.
The automotive sales trend is illustrated below:
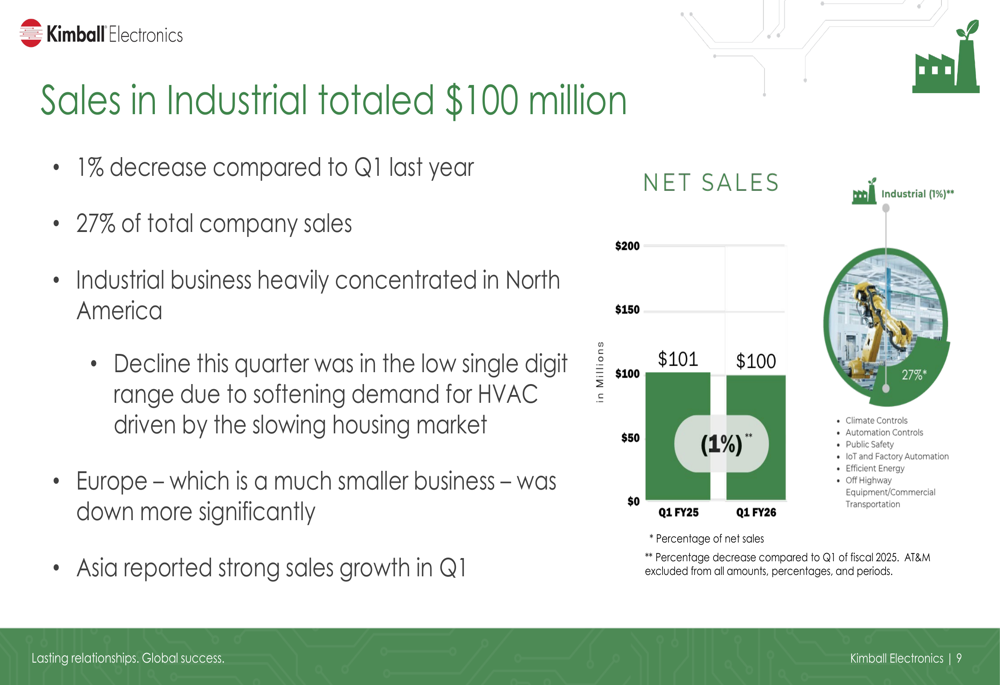
The industrial segment, contributing 27% of total revenue, saw a modest 1% decline to $100 million. This reduction was primarily due to softening demand for HVAC components driven by the slowing U.S. housing market.
Financial Position & Balance Sheet Improvements
Kimball Electronics continued to strengthen its balance sheet during Q1 FY2026. The company reported cash and cash equivalents of $75.7 million, with $8.1 million generated from operations during the quarter, marking the seventh consecutive quarter of positive cash flow.
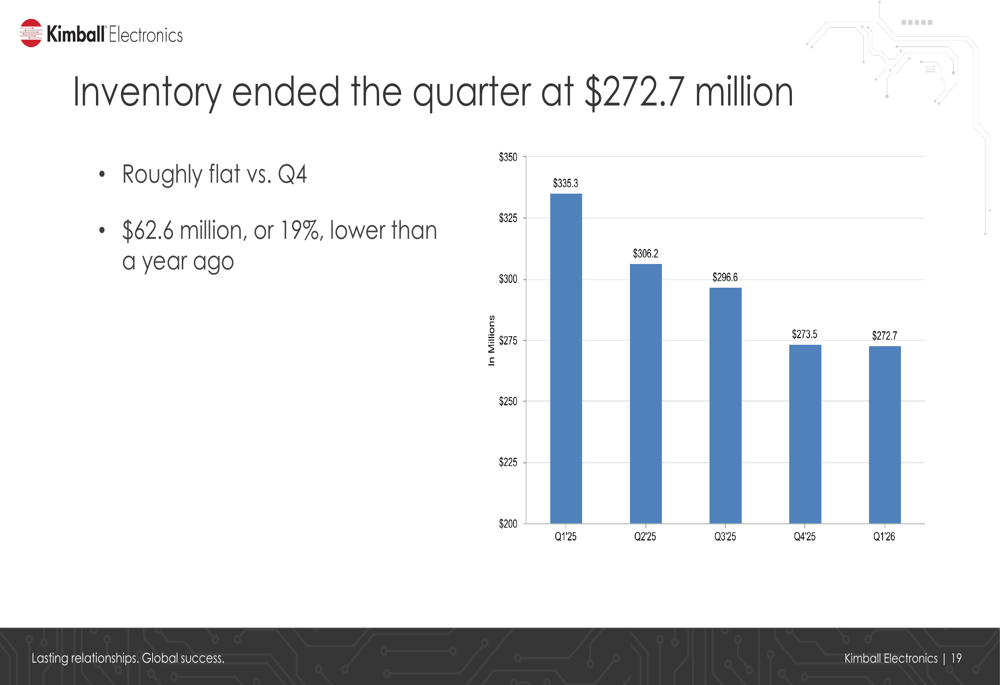
Inventory management showed significant improvement, with inventory levels at $272.7 million, essentially flat compared to the previous quarter but $62.6 million (19%) lower than a year ago:
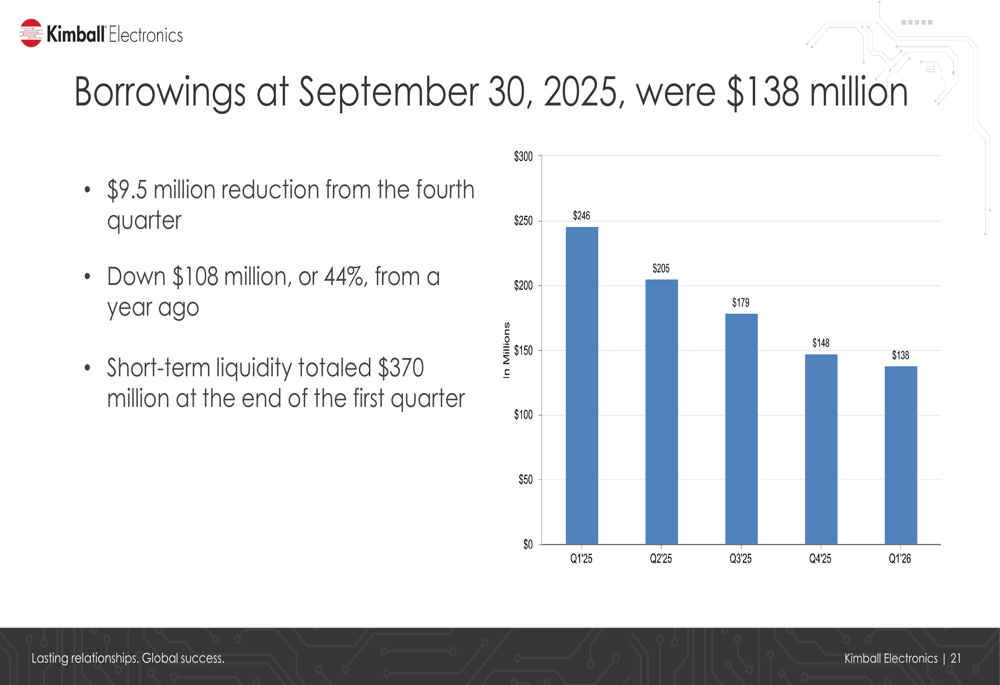
Perhaps most notably, borrowings were reduced to $138 million, a $9.5 million reduction from the fourth quarter and a substantial $108 million (44%) decrease from the previous year:
The company also continued its shareholder return program, investing $1.5 million to repurchase 49,000 shares during the quarter. Since October 2015, Kimball has returned $105.2 million to shareholders through share repurchases, with $14.8 million remaining in the current authorization.
Strategic Initiatives & Outlook
Kimball Electronics reaffirmed its fiscal 2026 guidance, projecting net sales between $1.35 billion and $1.45 billion, with adjusted operating income of 4.0% to 4.25% of net sales. Capital expenditures are expected to range from $50 million to $60 million.
The company’s strategic focus remains on expanding its medical business, which offers higher margins and more stable demand patterns. Management highlighted plans to pursue growth with blue-chip customers that have long product lifecycles and high visibility.
Kimball is also exploring "tuck-in" acquisition opportunities to add new end-markets, manufacturing capabilities, and customer relationships. These strategic moves align with the company’s goal of balancing its vertical segments and improving overall margins.
Looking ahead, management expressed optimism about a return to growth in fiscal 2027, particularly centered on the medical space. However, they acknowledged near-term challenges, noting that Q1 is expected to be the strongest quarter of the fiscal year as demand pressures and costs related to tariffs impact margins in North America.
Despite the stock’s negative reaction following the earnings release, Kimball Electronics’ improved profitability metrics, debt reduction, and strategic positioning in the growing medical manufacturing space suggest the company is making progress on its long-term objectives while navigating short-term sector-specific headwinds.
Full presentation:
This article was generated with the support of AI and reviewed by an editor. For more information see our T&C.