US LNG exports surge but will buyers in China turn up?

LP Building Solutions (NYSE:LPX) reported its second quarter 2025 financial results on August 6, revealing a tale of two segments with strong Siding performance counterbalanced by significant weakness in its OSB (Oriented Strand Board) business. The company’s stock was down 2.8% in premarket trading following the release, reflecting investor concerns about the mixed results.
Quarterly Performance Highlights
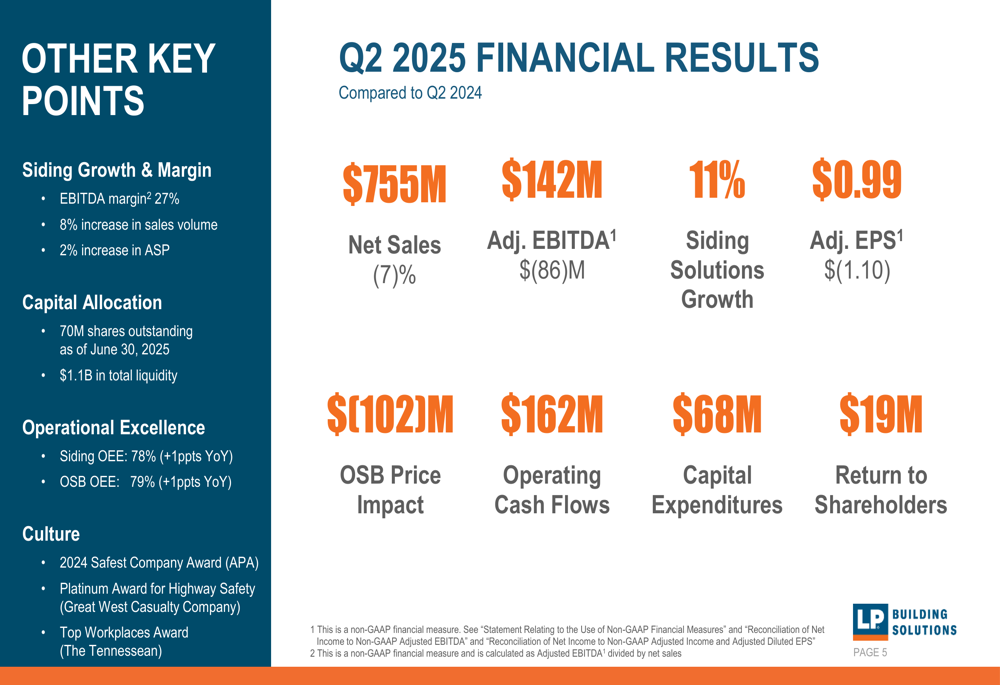
LP Building Solutions reported Q2 2025 net sales of $755 million, a 7% decrease compared to the same period last year. Adjusted EBITDA fell to $142 million, down $86 million from Q2 2024, while adjusted earnings per share declined to $0.99 from $2.09 in the prior-year quarter.
The company’s performance was significantly impacted by a $102 million negative effect from OSB price declines, which overshadowed the positive momentum in the Siding segment that achieved 11% growth. Despite these challenges, LP maintained strong operational efficiency with Siding OEE (Overall Equipment Effectiveness) at 78% and OSB OEE at 79%, both improving by 1 percentage point year-over-year.
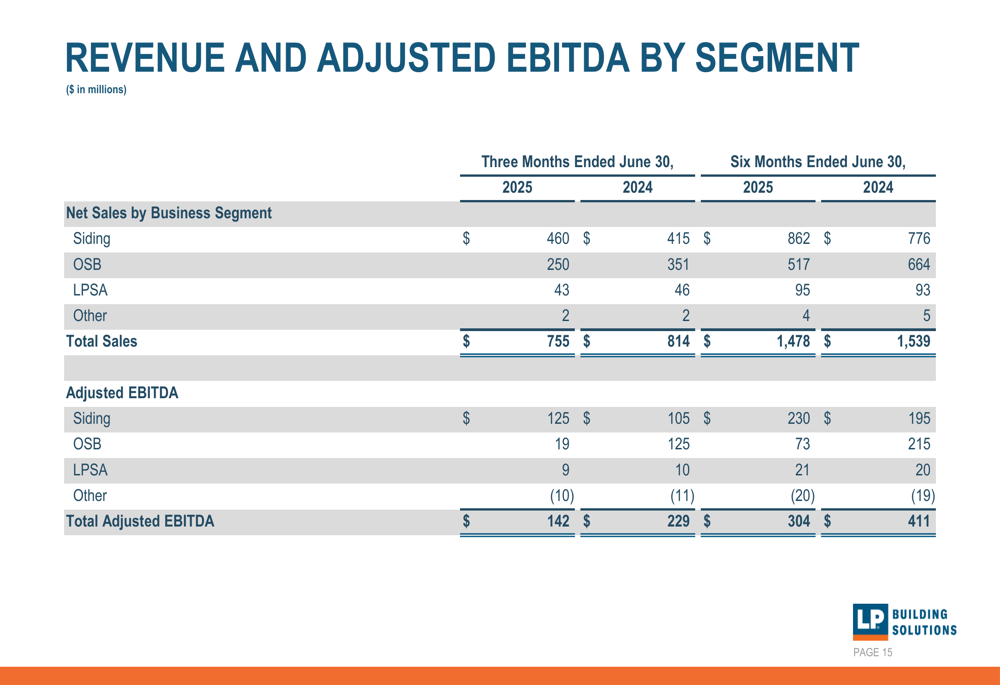
As shown in the following financial results summary:
Segment Performance Analysis
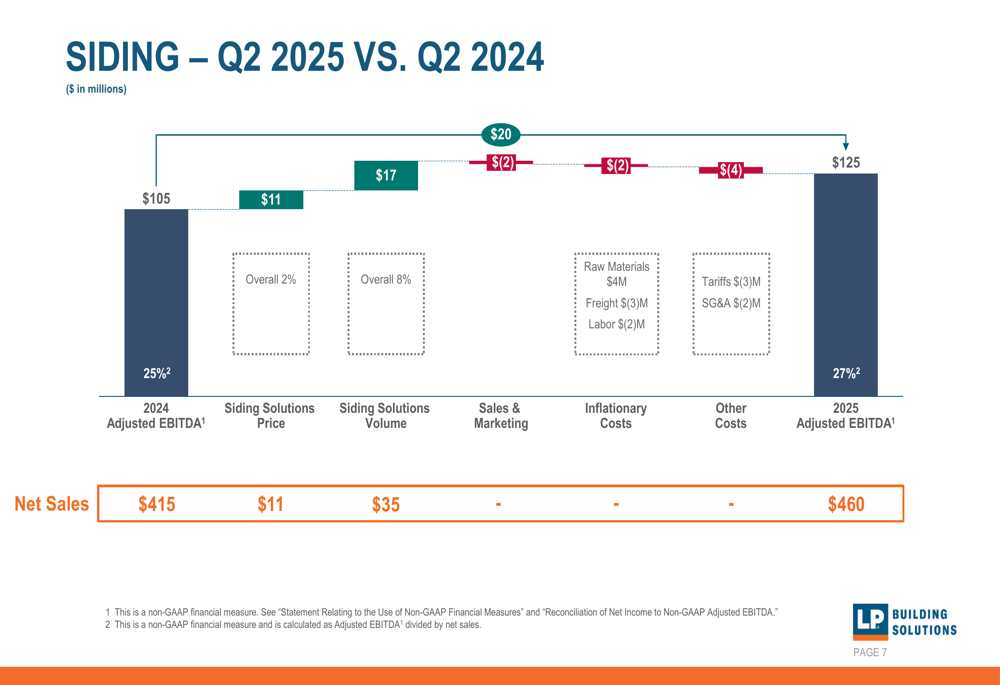
The Siding segment continued its strong performance trajectory with net sales of $460 million, up from $415 million in Q2 2024. Adjusted EBITDA for the segment reached $125 million, representing a robust 27% margin. This improvement was driven by an 8% increase in sales volume and a 2% increase in average selling prices.
The following waterfall chart illustrates the key drivers of Siding segment performance:
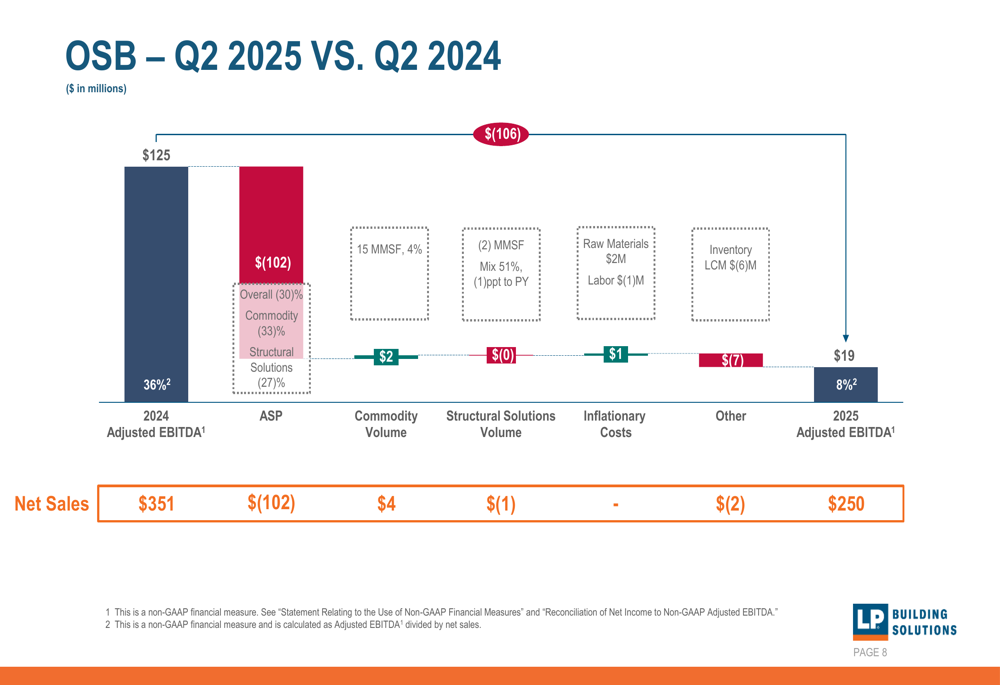
In stark contrast, the OSB segment faced significant headwinds with net sales declining to $250 million from $351 million in Q2 2024. Adjusted EBITDA for the segment plummeted to just $19 million from $125 million in the prior-year period, with margins shrinking to 8% from 36%. This dramatic decline was primarily attributed to a $102 million negative impact from lower average selling prices, which overwhelmed modest volume improvements.
The OSB segment performance breakdown is illustrated here:
Cash Flow and Capital Allocation
Despite earnings pressure, LP Building Solutions maintained strong cash generation with operating cash flow of $162 million for the quarter, though this represented a decrease from $212 million in Q2 2024. The company significantly increased capital expenditures to $68 million compared to $36 million in the prior-year period, reflecting continued investment in growth initiatives.
The company ended the quarter with $333 million in cash and approximately $1.1 billion in total liquidity, with 70 million shares outstanding as of June 30, 2025. LP returned $19 million to shareholders during the quarter.
Forward-Looking Guidance
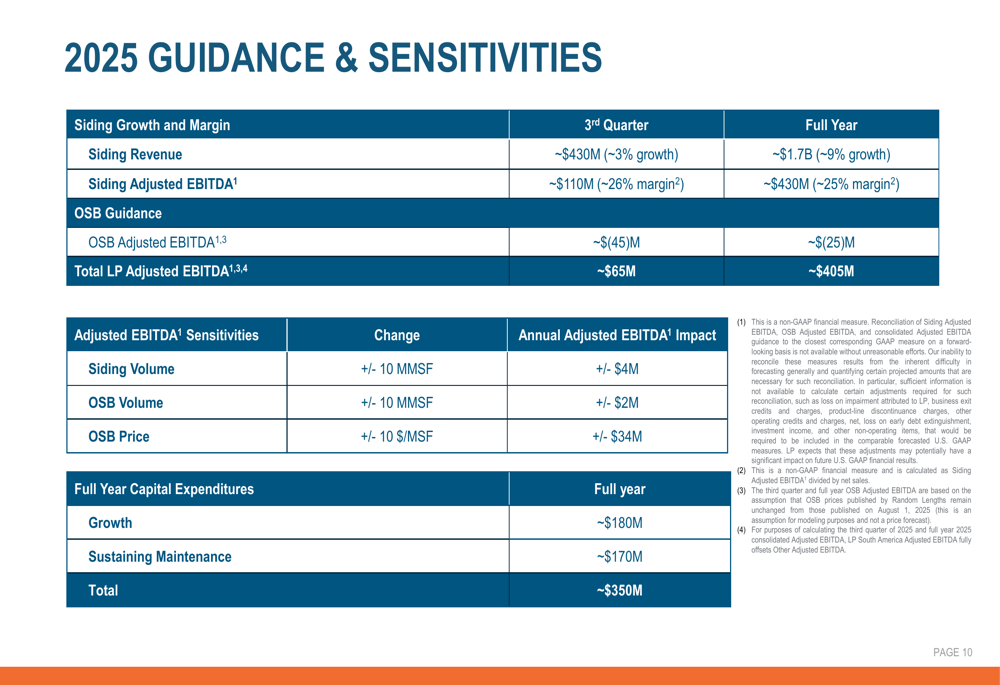
For Q3 2025, LP Building Solutions expects Siding segment revenue of approximately $430 million, representing about 3% growth, with Adjusted EBITDA of around $110 million (26% margin). The OSB segment is projected to report an Adjusted EBITDA loss of approximately $45 million in Q3, resulting in total company Adjusted EBITDA of about $65 million.
For the full year 2025, the company maintained its Siding revenue guidance of approximately $1.7 billion (9% growth) with Adjusted EBITDA of around $430 million (25% margin). The OSB segment is expected to report a full-year Adjusted EBITDA loss of approximately $25 million, with total company Adjusted EBITDA projected at around $405 million.
The detailed guidance and sensitivity analysis is presented below:
Strategic Focus and Outlook
LP Building Solutions continues to prioritize its Siding business as the company’s growth engine, consistent with statements made during the Q1 2025 earnings call when CEO Brad Southern emphasized, "Our goal is to make Siding growth permanent." The Q2 results reinforce this strategy, with the Siding segment delivering double-digit growth despite challenging market conditions.
The company’s capital allocation strategy reflects this focus, with planned capital expenditures of approximately $350 million for the full year, split between growth investments ($180 million) and sustaining maintenance ($170 million).
While the OSB business faces significant near-term challenges due to commodity price pressures, LP is maintaining operational efficiency improvements in this segment, as evidenced by the 1 percentage point improvement in OSB OEE.
The company’s segment performance breakdown for both the quarter and year-to-date periods shows the divergent trends between Siding and OSB:
Looking ahead, LP Building Solutions faces continued uncertainty in the OSB market but appears well-positioned to leverage its strong Siding business performance and healthy balance sheet to navigate through the current challenging environment.
Full presentation:
This article was generated with the support of AI and reviewed by an editor. For more information see our T&C.