Gold prices slip lower; consolidating after recent gains

Introduction & Market Context
LSI Industries Inc (NASDAQ:LYTS) presented its fiscal third quarter 2025 results on April 24, 2025, highlighting 22% year-over-year revenue growth despite facing customer project fluctuations and broader market volatility. The company’s stock closed at $15.81 on April 23, 2025, and showed a 1.28% increase in regular trading, followed by a 1.2% gain in after-hours trading.
The quarter’s performance reflects LSI’s continued execution of its vertical market strategy, including the integration of its recent Canada’s Best Holding acquisition, which contributed to both top-line growth and increased leverage.
Quarterly Performance Highlights
LSI Industries reported total net sales of $132.5 million for Q3 FY2025, a 22% increase from $108.2 million in the same period last year. Operating income rose to $10.0 million (9.3% of sales) from $7.7 million (7.3% of sales) in the prior year.
As shown in the following consolidated financial results:
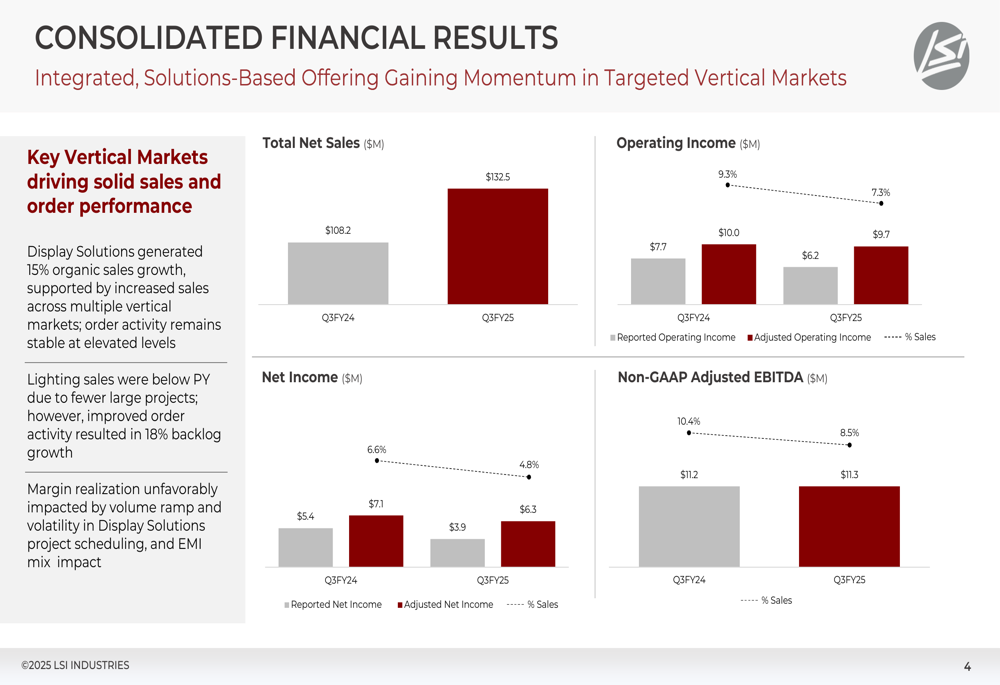
Net income increased to $6.3 million (4.8% of sales) compared to $5.4 million (4.8% of sales) in Q3 FY2024, while adjusted EBITDA remained relatively flat at $11.3 million despite representing a lower percentage of sales (8.5% vs. 10.4% in the prior year). This indicates margin pressure despite the strong revenue growth.
The company’s adjusted earnings per share for Q3 FY2025 was $0.20, showing a decline from the $0.26 reported in Q1 FY2025, suggesting sequential earnings pressure despite continued revenue expansion.
Segment Analysis
Display Solutions Segment
The Display Solutions segment was the primary growth driver, with sales increasing 70% year-over-year to $73.5 million, including 15% organic growth. This performance was fueled by a 60% increase in Refueling/C-Store sales and a 20% growth in Grocery sales, continuing the strong momentum seen in earlier quarters.
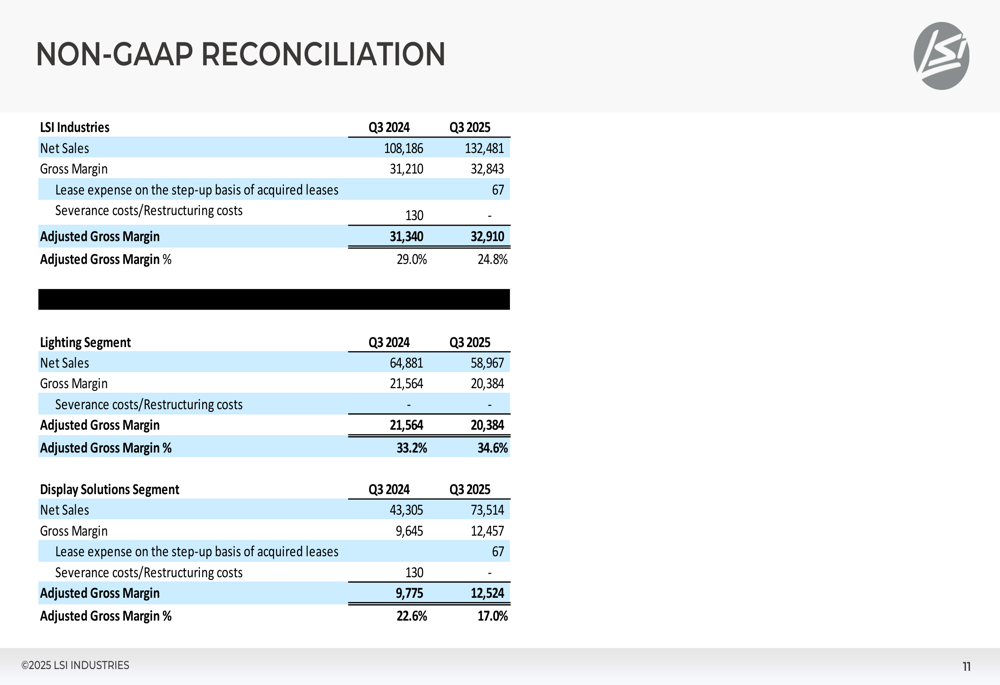
However, profitability metrics in this segment showed pressure, with adjusted gross margin declining from 22.6% to 17.0% and adjusted operating income decreasing from 11.7% to 7.7% of sales.
The segment’s detailed performance metrics are illustrated here:
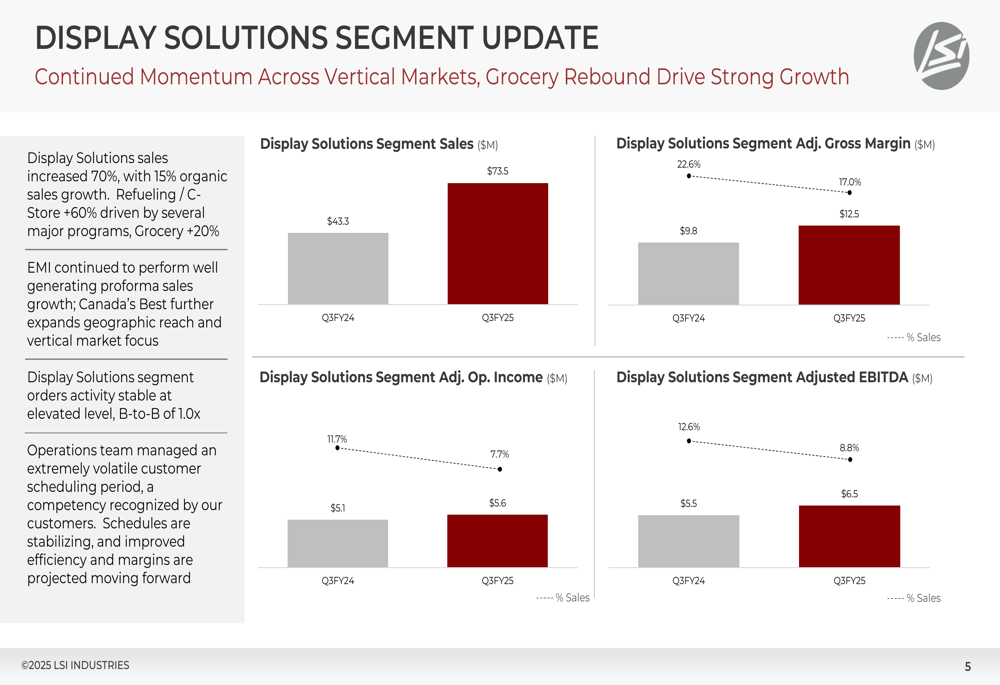
Order activity remained stable at elevated levels with a book-to-bill ratio of 1.0x, indicating continued demand strength but also suggesting potential normalization in growth rates moving forward.
Lighting Segment
In contrast to Display Solutions, the Lighting segment experienced a year-over-year sales decline from $64.9 million to $59.0 million. Despite this revenue decrease, the segment showed margin improvement, with adjusted gross margin increasing from 33.2% to 34.6% and adjusted operating income rising from 12.2% to 13.3% of sales.
The segment’s performance metrics and margin improvements are shown below:
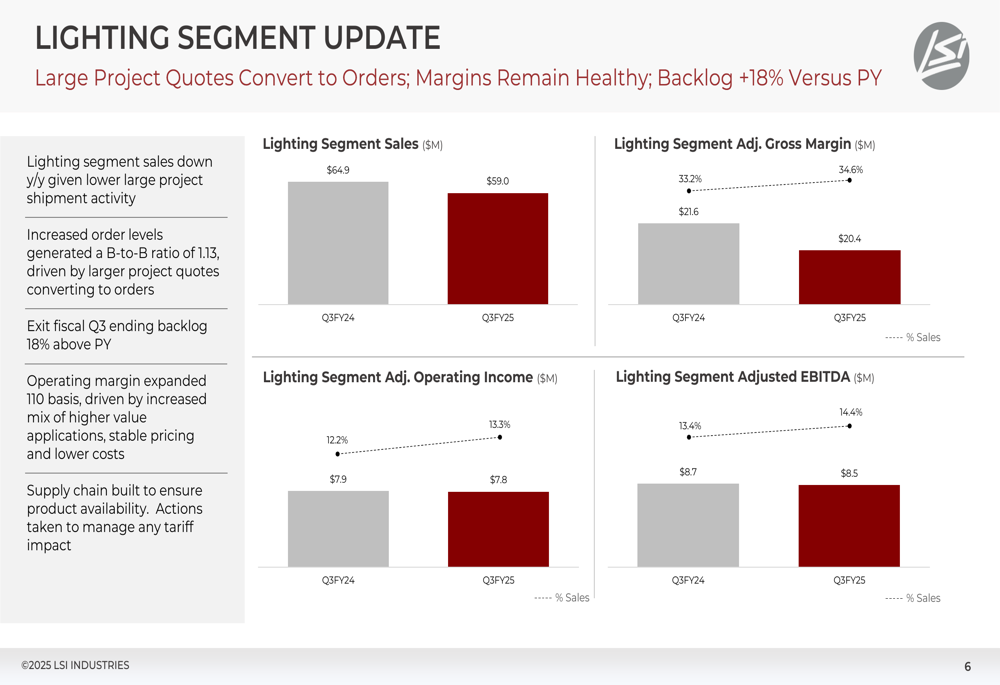
Notably, the Lighting segment demonstrated positive momentum in order activity, generating a book-to-bill ratio of 1.13x and growing its backlog by 18% compared to the previous year. This suggests potential revenue recovery in upcoming quarters.
Balance Sheet and Cash Flow
LSI Industries maintained a strong financial position while funding growth initiatives. The company generated $4.7 million in free cash flow during Q3 and $35 million on a trailing twelve-month basis, representing significant improvement from $11.2 million in the prior year period.
The following chart illustrates the company’s impressive cash flow generation:
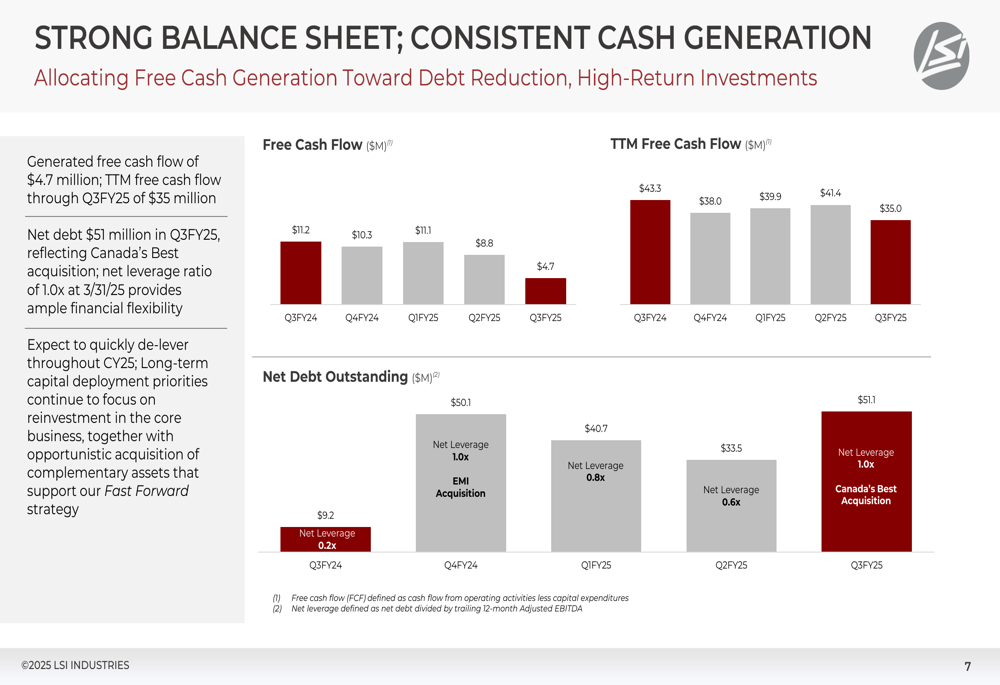
Net debt stood at $51 million, reflecting the impact of the Canada’s Best acquisition, with a net leverage ratio of 1.0x. This represents an increase from the 0.8x leverage ratio reported in Q1 FY2025, but remains at a conservative level that provides flexibility for future strategic initiatives.
Working capital management remains disciplined despite growth pressures, as shown in the following chart:
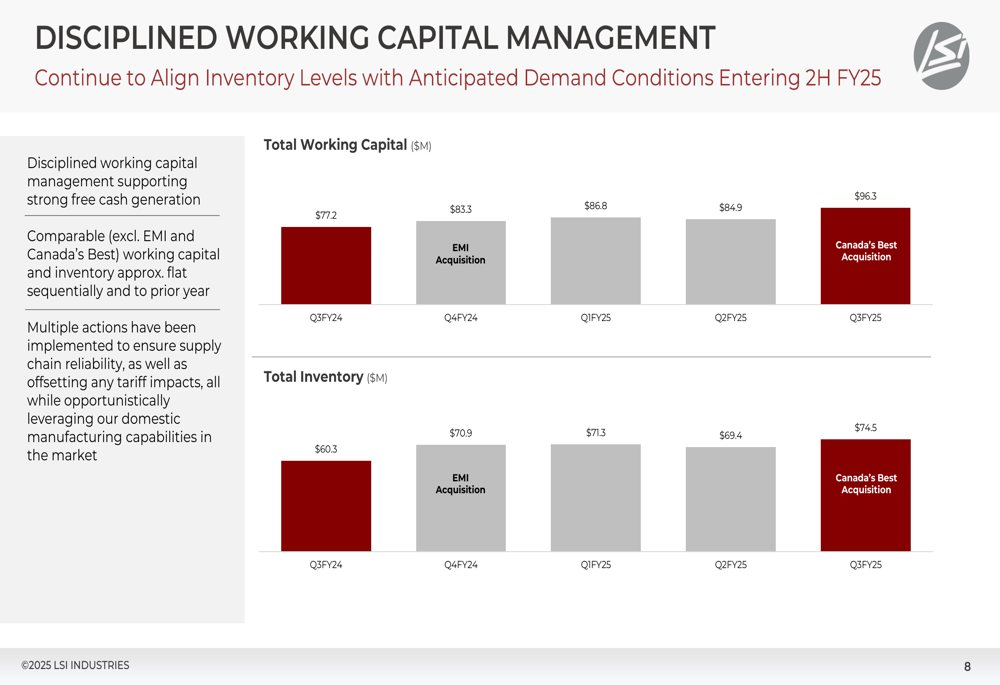
Total (EPA:TTEF) working capital increased from $77.2 million to $96.3 million, while inventory levels rose from $60.3 million to $74.5 million, reflecting both organic growth needs and acquisition impacts.
Strategic Initiatives and Outlook
LSI Industries continues to execute on its "Fast Forward" value creation initiative, with a vertical market strategy focused on both organic and inorganic growth opportunities. The integration of Canada’s Best Holding appears to be progressing as planned, contributing to the company’s expanded capabilities and market reach.
The key messages from management highlight their strategic focus areas:
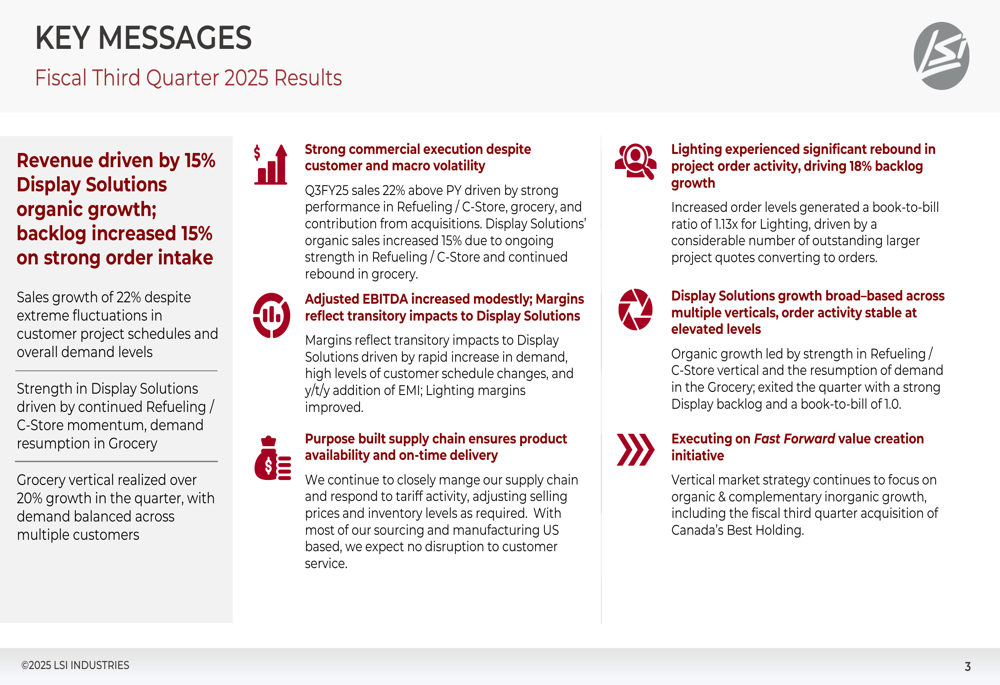
While the company faces some transitory margin impacts in the Display Solutions segment, the strong order intake and backlog growth (15% increase in Display Solutions and 18% in Lighting) suggest continued revenue momentum. The Lighting segment’s book-to-bill ratio of 1.13x indicates potential recovery in that business line.
The company’s non-GAAP reconciliation provides additional context for understanding its financial performance:
Looking ahead, LSI Industries appears well-positioned to continue executing its growth strategy, though investors should monitor margin trends and the company’s ability to translate strong order activity into improved profitability in coming quarters.
Full presentation:
This article was generated with the support of AI and reviewed by an editor. For more information see our T&C.