U.S. stocks edge higher ahead of Nvidia earnings, Fed minutes

Manulife Financial Corp (NYSE:MFC) presented its second quarter 2025 financial results on August 7, 2025, highlighting strong top-line growth driven primarily by its Asia segment, while facing challenges in its U.S. operations. The company’s stock was trading down 2.8% at the time of the presentation.
Quarterly Performance Highlights
Manulife reported resilient second-quarter results with strong top-line growth across key metrics. Annualized premium equivalent (APE) sales increased 15% year-over-year, while new business contractual service margin (CSM) jumped 37% and new business value rose 20%. Core earnings per share (EPS) grew 2% compared to the same period last year, though the company noted this figure would have been up 7% when excluding expected credit losses (ECL).
As shown in the following comprehensive overview of Q2 2025 results:
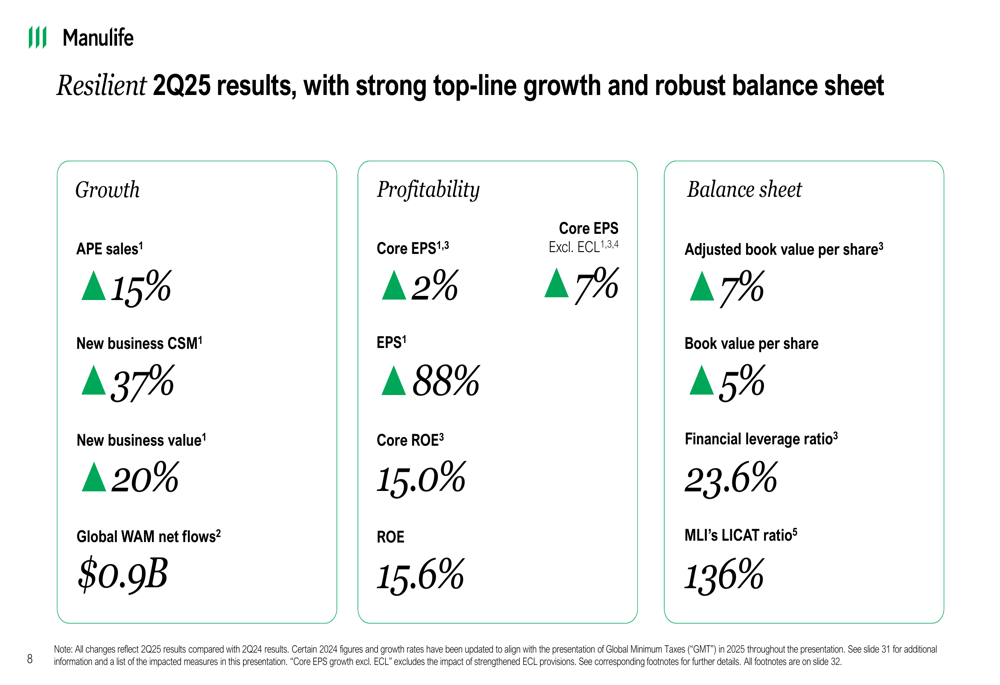
"We’re delivering high-quality, sustainable growth and investing in high-potential businesses," said Phil Witherington, President and Chief Executive Officer of Manulife, during the presentation. The company also highlighted its acquisition of Comvest Credit Partners, which is expected to be immediately accretive to core EPS, core ROE, and EBITDA margin without impacting the share buyback program.
Segment Performance Analysis
Asia: Engine of Growth
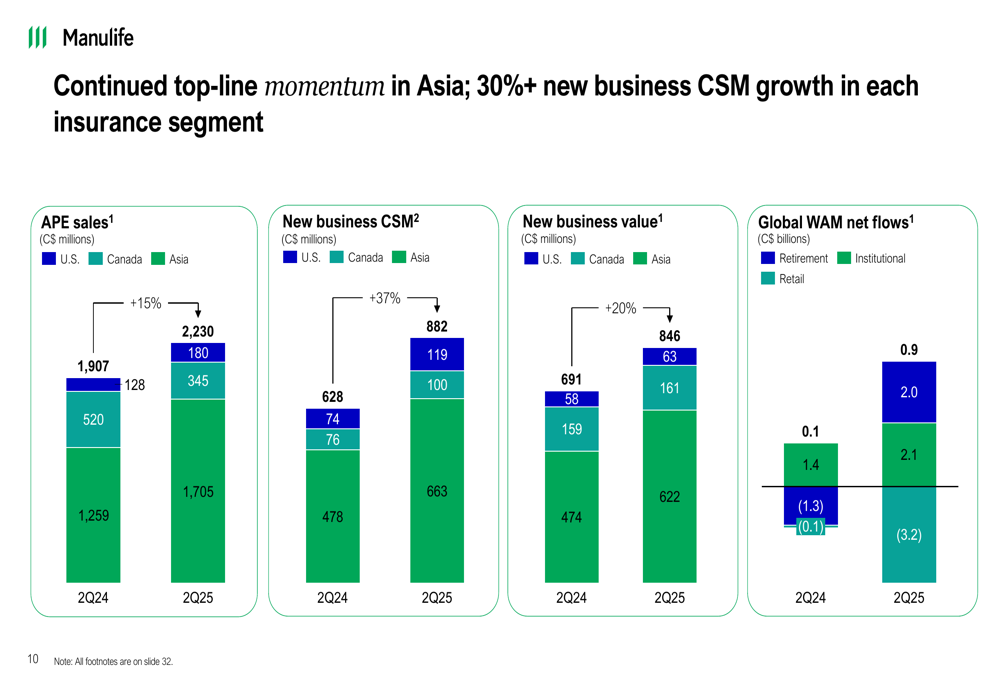
Manulife’s Asia segment continued to demonstrate strong momentum, with APE sales increasing 34% year-over-year to US$1,233 million. New business CSM rose 38% to US$480 million, while new business value grew 30% to US$451 million. Core earnings in the region increased 16% to US$520 million, reflecting continued business growth across markets, with particular strength in Hong Kong and other Asian markets.
The following chart illustrates the continued top-line momentum in Asia:
Global Wealth and Asset Management: Margin Expansion
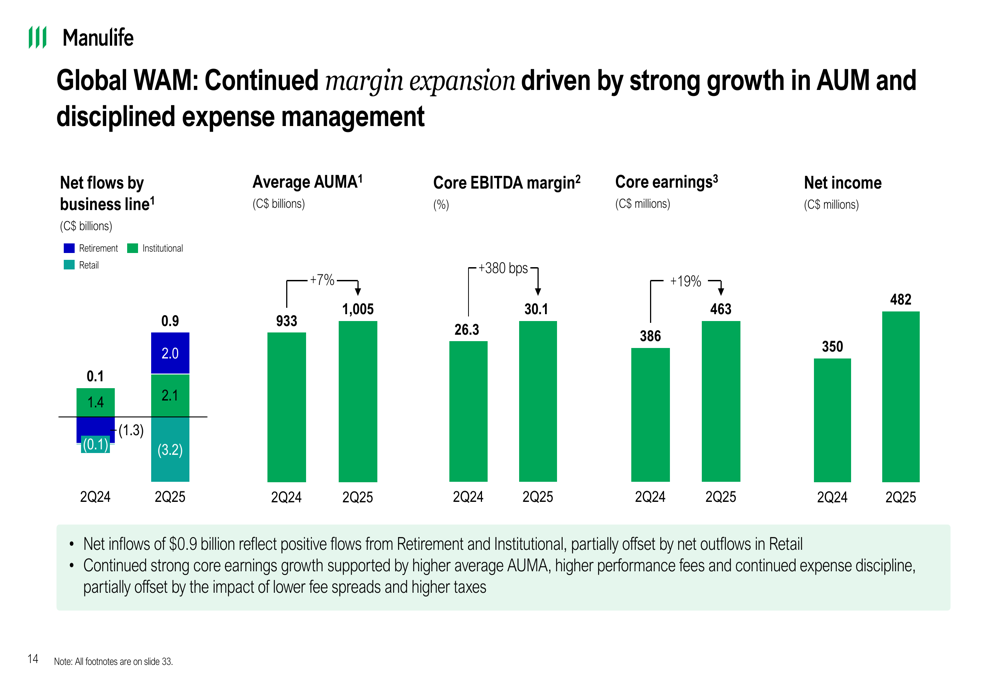
The Global Wealth and Asset Management (WAM) segment showed impressive results with continued margin expansion driven by strong growth in assets under management and disciplined expense management. Net flows were $0.9 billion in Q2 2025, reflecting positive flows from Retirement and Institutional segments, partially offset by net outflows in Retail.
The core EBITDA margin improved significantly from 26.3% to 30.1%, while core earnings increased from C$386 million to C$463 million, representing a 20% increase year-over-year.
The following chart details the Global WAM performance metrics:
U.S. and Canada: Mixed Results
While the U.S. segment showed strong new business results, core earnings were significantly impacted by unfavorable mortality experience, lower investment spreads, and higher expected credit losses. Core earnings in the U.S. declined from US$303 million in Q2 2024 to US$141 million in Q2 2025.
Canada delivered solid core earnings growth despite a strong prior year comparator, with net income increasing substantially from C$79 million to C$390 million year-over-year.
Balance Sheet & Capital Management
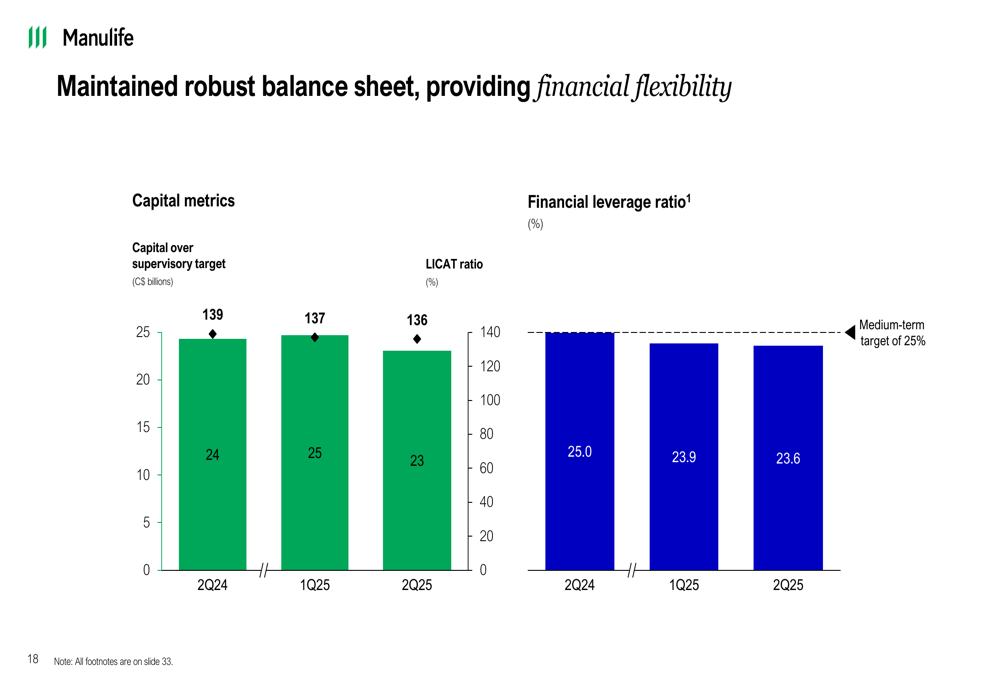
Manulife maintained a robust balance sheet with a Life Insurance (NSE:LIFI) Capital Adequacy Test (LICAT) ratio of 136% for Manufacturers Life Insurance Company (MLI), slightly down from 139% in Q2 2024. The financial leverage ratio improved to 23.6% from 25.0% a year earlier, trending toward the medium-term target of 25%.
The following chart illustrates the company’s capital position:
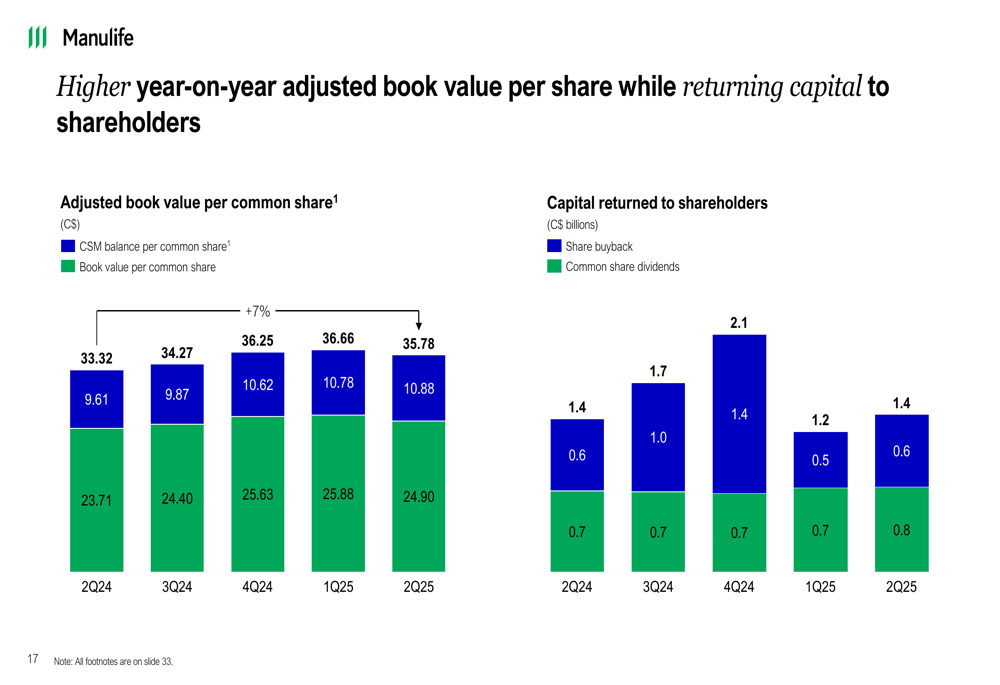
The adjusted book value per common share increased 7% year-over-year to C$35.78, while the company continued to return capital to shareholders through share buybacks and dividends. In Q2 2025, Manulife returned C$1.4 billion through share buybacks and C$0.8 billion in common share dividends.
As shown in the following chart of adjusted book value growth and capital returns:
Strategic Initiatives & Outlook
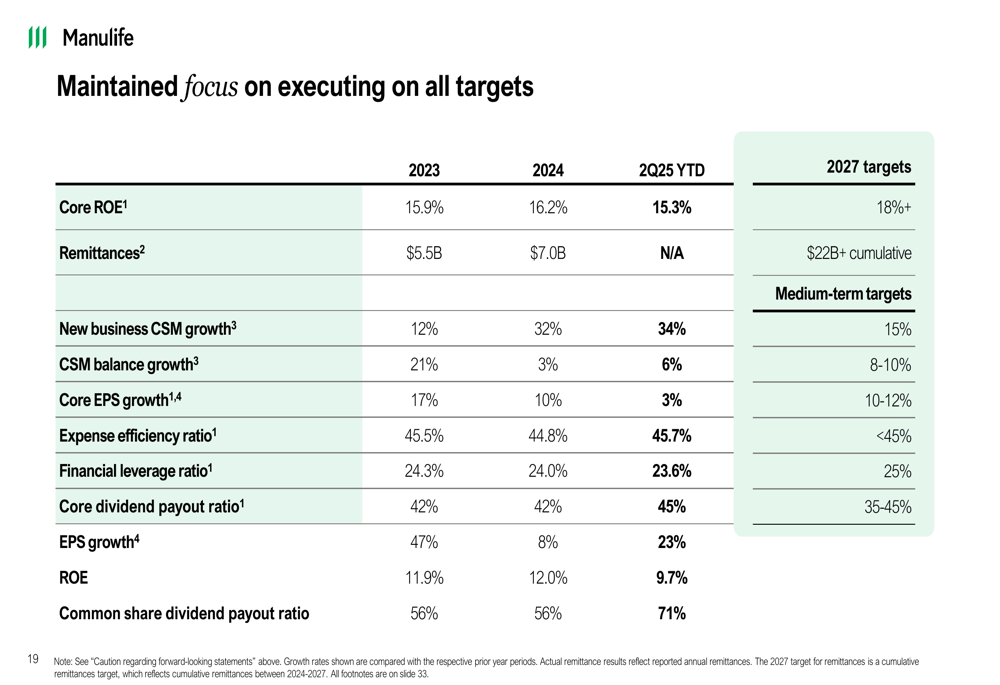
Manulife reaffirmed its commitment to achieving its 2027 and medium-term financial targets. The 2027 targets include a Core ROE of 18%+ and cumulative remittances of C$22 billion+. Medium-term targets include new business CSM growth of 15%, CSM balance growth of 8-10%, and core EPS growth of 10-12%.
The company’s progress against these targets is shown in the following chart:
"We have a clear path to achieve our 2027 and medium-term financial targets," Witherington stated. The company highlighted its continued progress on its Digital, Customer Leader ambition and strong business fundamentals that position it well to navigate the current environment.
Forward-Looking Statements
Manulife’s presentation included cautionary statements regarding forward-looking statements, noting that actual results may differ materially from expectations due to various factors including economic conditions, regulatory changes, and competitive pressures.
The Q2 2025 results show Manulife continuing the strong performance trend seen in previous quarters, particularly in its Q3 2024 results where the company reported substantial growth driven by Asia and solid contributions from Global WAM. While the current quarter faced some headwinds in the U.S. segment, the overall trajectory remains positive as the company executes on its strategic priorities and maintains financial discipline.
Full presentation:
This article was generated with the support of AI and reviewed by an editor. For more information see our T&C.