BitMine stock falls after CEO change and board appointments

Introduction & Market Context
Manulife Financial Corp (NYSE:MFC) reported strong third quarter 2025 results on November 13, with core earnings per share rising 16% year-over-year to $1.16. The company’s stock responded positively, closing at $34.97, up 2.12% in regular trading with an additional 1.57% gain in premarket trading.
The insurer’s performance was driven primarily by growth in its Asia and Global Wealth and Asset Management (WAM) segments, which now contribute 76% of core earnings, reflecting the company’s strategic shift toward these high-growth businesses.
Quarterly Performance Highlights
Manulife delivered solid growth across key metrics in the third quarter, with core earnings increasing 10% year-over-year to C$2,035 million. The company’s core return on equity reached 18.1%, up 1.5 percentage points from the prior year and approaching its 2027 target of 18%+.
As shown in the following comprehensive summary of Q3 2025 results:
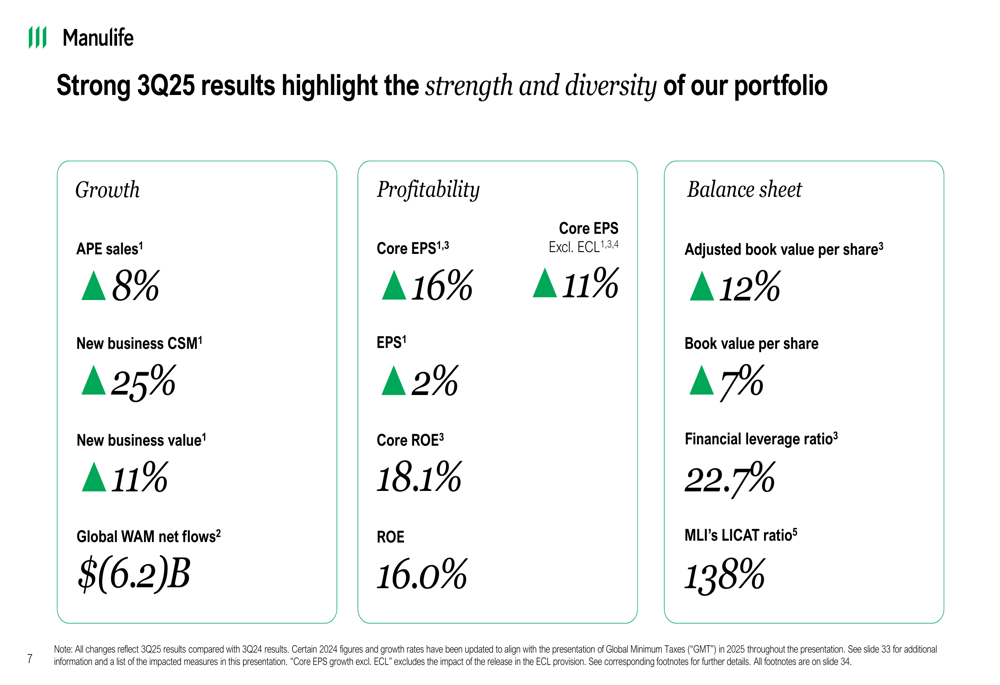
New business metrics showed particular strength, with annualized premium equivalent (APE) sales up 8% to C$2.6 billion, new business contractual service margin (CSM) up 25% to C$966 million, and new business value up 11% to C$906 million.
The company’s adjusted book value per share increased 12% year-over-year to C$38.22, while maintaining a strong capital position with MLI’s LICAT ratio at 138% and financial leverage ratio improving to 22.7%.
Segment Performance
Asia emerged as a standout performer, with core earnings reaching a record C$550 million, representing 29% growth year-over-year. This growth was driven by higher sales volumes and continued business expansion in the region.
The following chart illustrates the consistent growth trajectory in Asia and Global WAM core earnings:
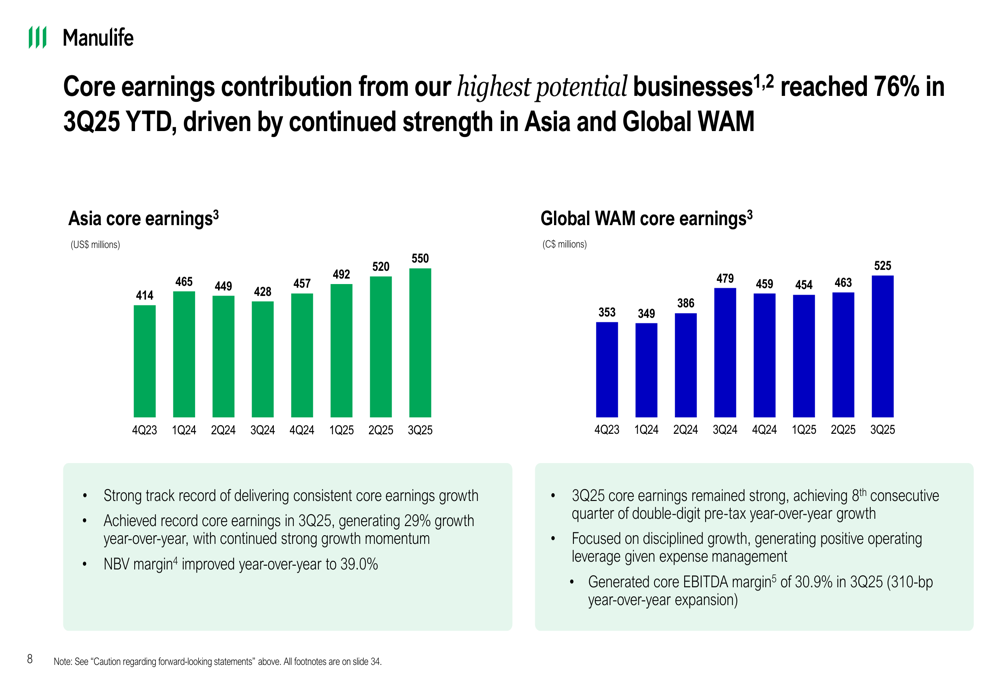
Global WAM also delivered strong results, with core earnings increasing to C$525 million. The segment achieved its eighth consecutive quarter of double-digit pre-tax year-over-year growth and expanded its core EBITDA margin to 30.9%, representing a 310 basis point improvement from the prior year.
As shown in the following performance breakdown for Global WAM:
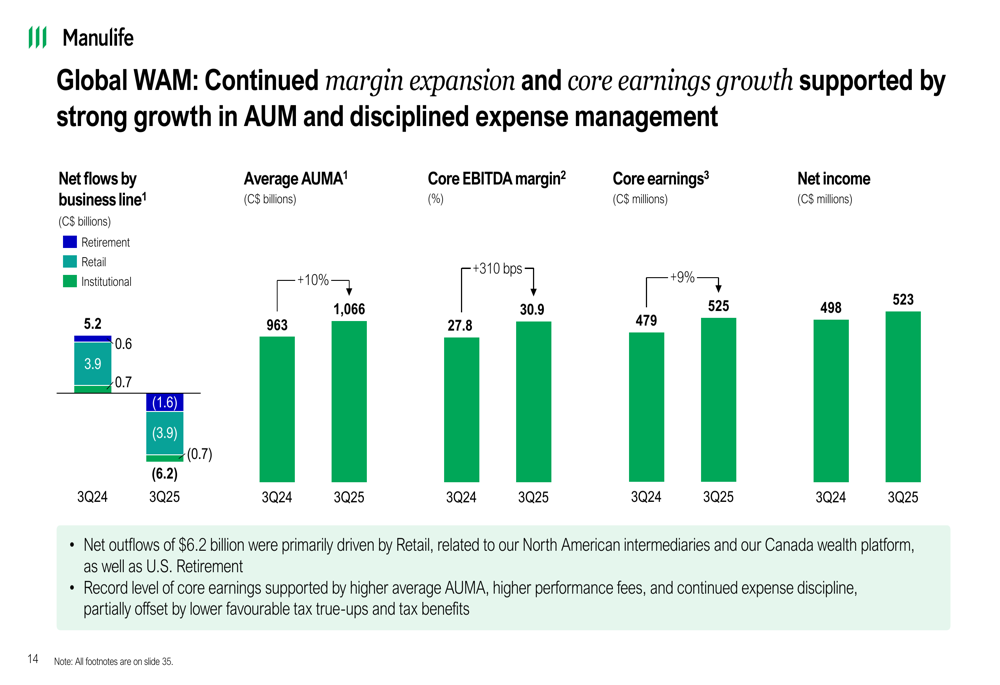
Despite the overall positive performance, Global WAM experienced negative net flows of C$(6.2) billion in Q3 2025, compared to positive C$5.2 billion in Q3 2024, representing a potential area of concern.
Canada delivered solid results with core earnings increasing to C$430 million, reflecting higher investment spreads and strong growth in individual insurance sales.
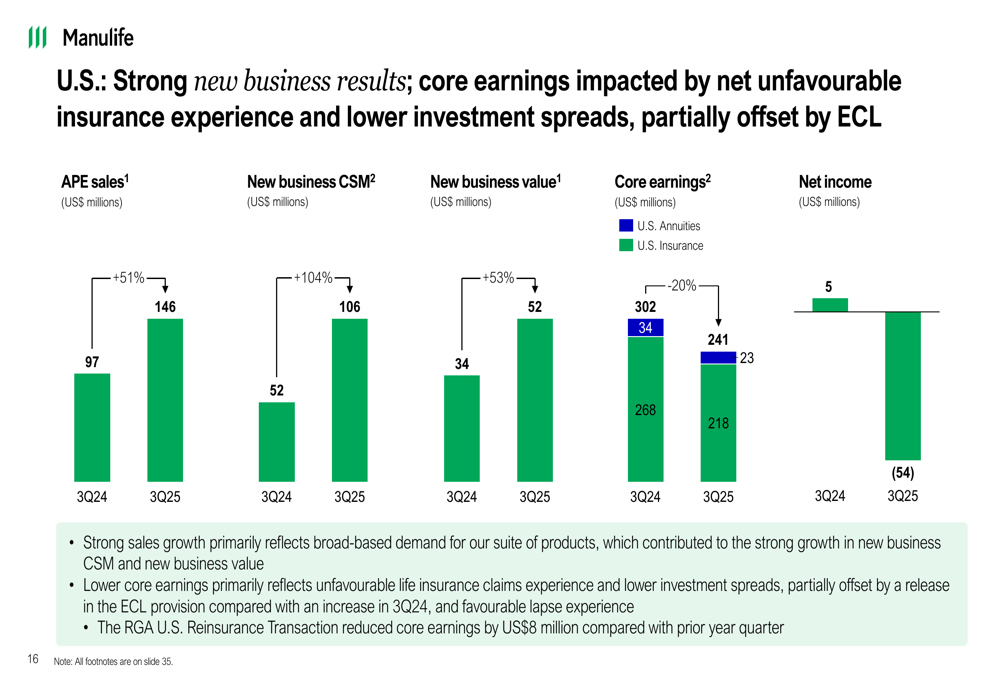
The U.S. segment presented a mixed picture with strong new business results but lower core earnings, primarily due to unfavorable life insurance claims experience:
Strategic Initiatives
During the quarter, Manulife announced a refreshed growth-focused strategy centered on becoming the number one choice for customers. Key strategic priorities include:
1. Focusing on Asia and Global WAM as the highest potential businesses
2. Entering the India insurance market through a joint venture with Mahindra
3. Growing in Canada and the U.S. through targeted initiatives
4. Becoming an AI-powered organization
5. Empowering customer health, wealth, and longevity
CEO Phil Witherington emphasized the company’s commitment to utilizing its strengths in "product, digital innovation, and partnerships to become the most trusted partner for our customers’ health, wealth, and financial well-being."
Balance Sheet and Capital Management
Manulife maintained a robust balance sheet while continuing to return capital to shareholders through dividends and share buybacks. The company’s financial leverage ratio improved to 22.7%, below its medium-term target of 25%, providing financial flexibility.
As illustrated in the following chart showing adjusted book value growth and capital returned to shareholders:
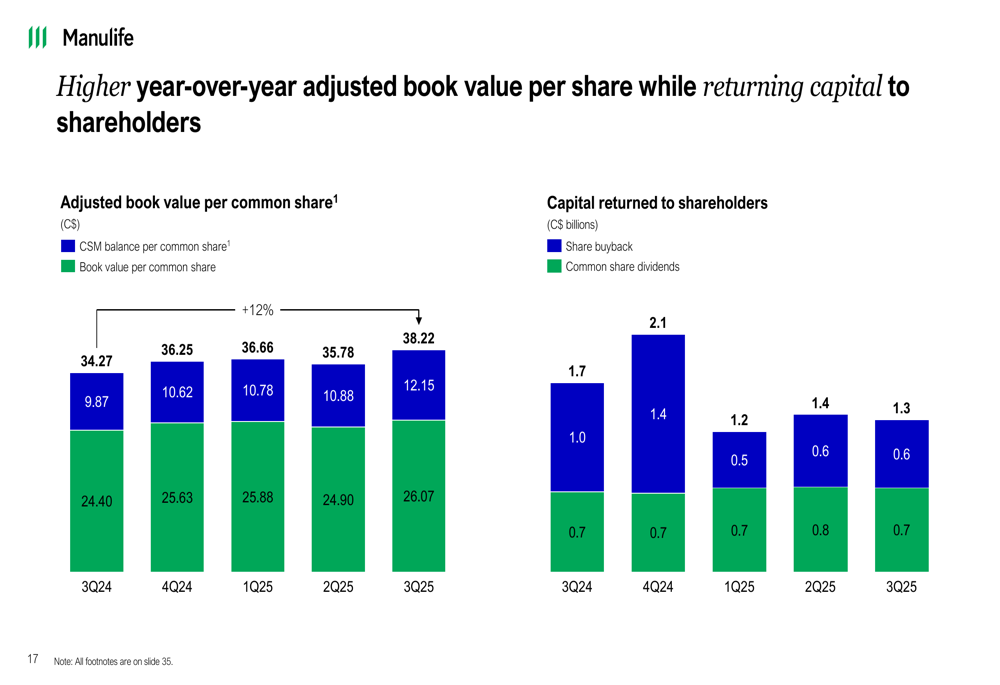
The company returned C$2.0 billion to shareholders in Q3 2025, including C$1.3 billion in share buybacks and C$0.7 billion in common share dividends. The quarterly dividend increased 10% year-over-year to 44.0 cents per share.
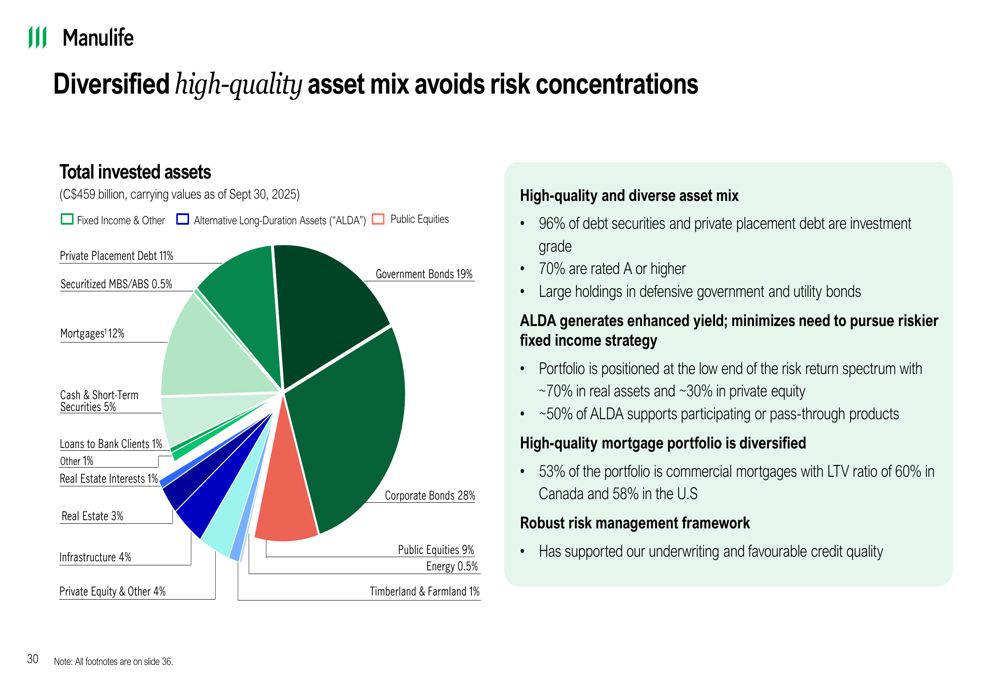
Manulife’s invested assets remained well-diversified across fixed income and alternative investments, supporting the company’s strong capital position:
Forward-Looking Statements
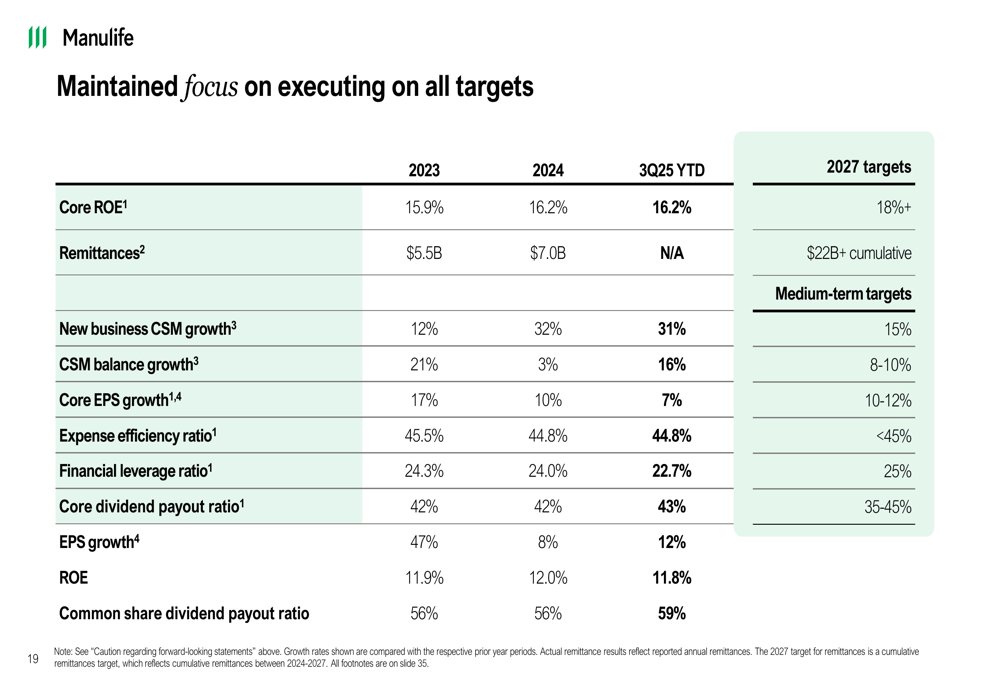
Manulife reported progress across all its 2027 targets, with several metrics already approaching or exceeding the long-term goals. The company remains confident in achieving its medium-term financial objectives, including 10-12% core EPS growth.
As shown in the following progress chart against 2027 targets:
The company completed a comprehensive review of its long-term care business, resulting in a net favorable impact of C$605 million from the annual review of actuarial methods and assumptions. Management noted that this is expected to have a "modestly favorable impact on core earnings each quarter" going forward.
Looking ahead, Manulife plans a C$400 million capital injection into its India venture over the next decade, reflecting its strategic focus on expanding in high-growth markets. The company expects low to mid-single-digit growth in the U.S. market and slightly higher growth in Canada, while Asia and Global WAM remain the primary growth engines.
Full presentation:
This article was generated with the support of AI and reviewed by an editor. For more information see our T&C.