Crispr Therapeutics shares tumble after significant earnings miss

Introduction & Market Context
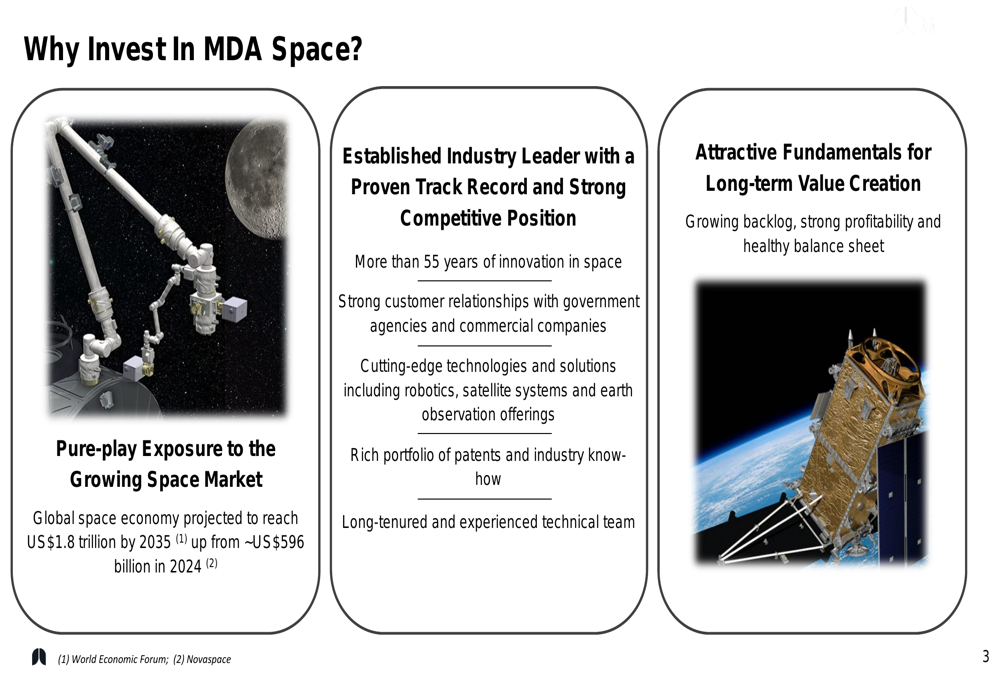
MDA Ltd (TSE:MDA), a Canadian space technology company, reported exceptional first-quarter 2025 results on May 8, 2025, with revenue growth of 68% year-over-year, driven by strong demand across its business segments. The company has positioned itself as a pure-play in the rapidly expanding space market, which is projected to grow from approximately US$596 billion in 2024 to US$1.8 trillion by 2035.
With over 55 years of innovation in the space sector, MDA has leveraged its extensive experience, customer relationships, and technological capabilities to capitalize on increasing global investment in space infrastructure and services.
As shown in the following overview of MDA’s investment proposition:
Quarterly Performance Highlights
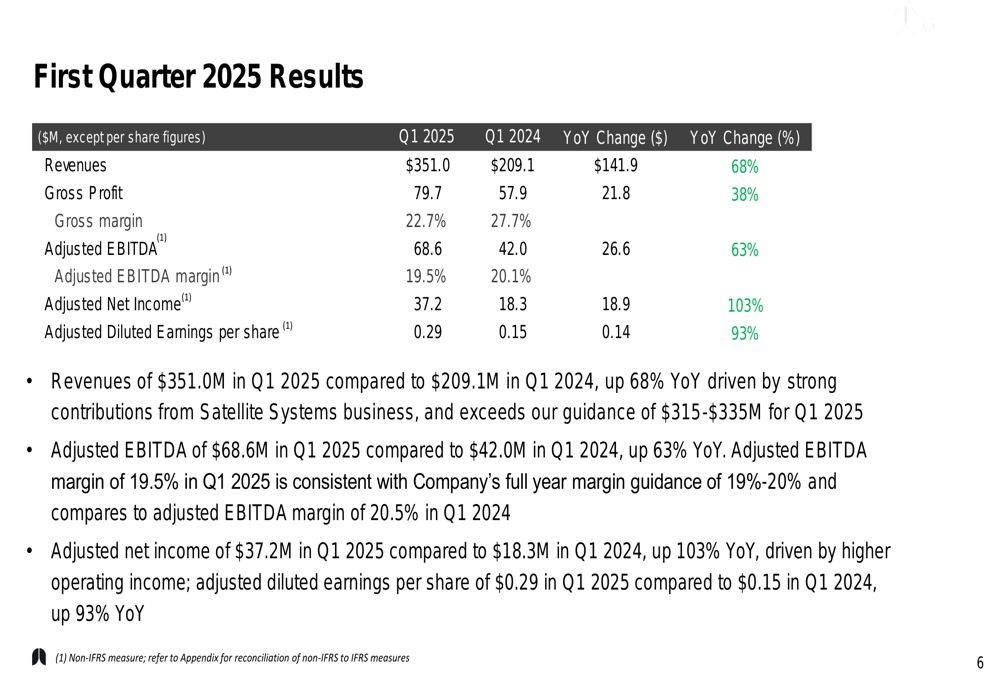
MDA reported revenues of $351.0 million for Q1 2025, a 68% increase from $209.1 million in Q1 2024, exceeding the company’s guidance. This growth was accompanied by a 63% increase in Adjusted EBITDA to $68.6 million, though the Adjusted EBITDA margin slightly contracted to 19.5% from 20.1% in the prior year period.
The company’s adjusted net income more than doubled to $37.2 million, up 103% year-over-year, with adjusted diluted earnings per share increasing 93% to $0.29. While gross margin decreased to 22.7% from 27.7% in Q1 2024, the overall financial performance demonstrated robust operational execution.
The following chart summarizes MDA’s key first quarter 2025 financial results:
A more detailed breakdown of the quarterly performance metrics shows the company’s significant year-over-year improvements:
Backlog and Order Momentum
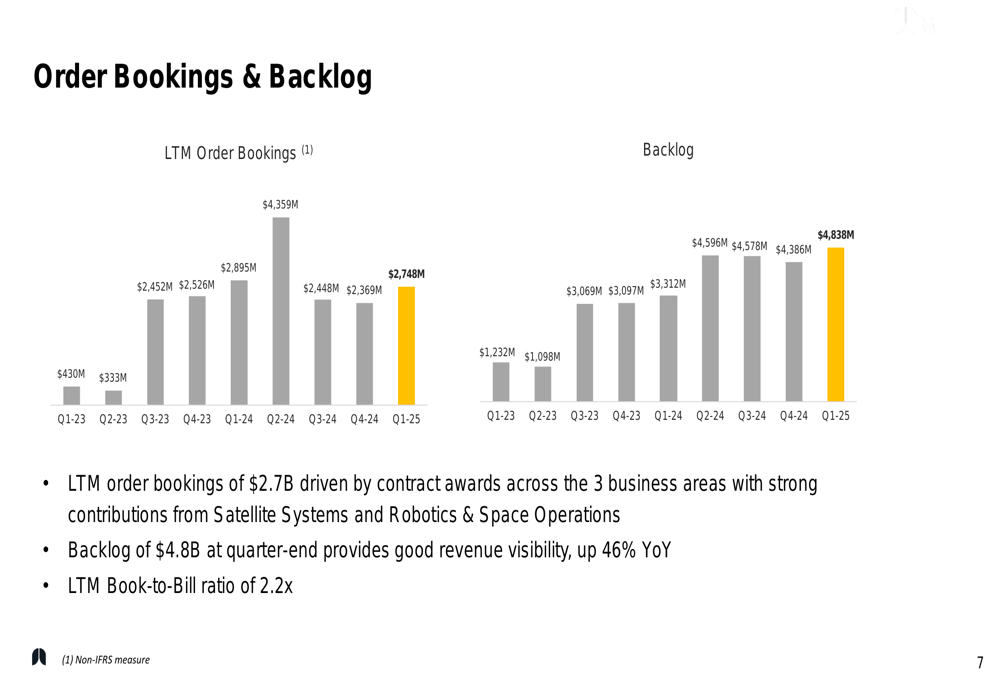
MDA’s backlog reached $4.8 billion at the end of Q1 2025, representing a 46% increase from the prior year and providing substantial revenue visibility. The company achieved a book-to-bill ratio of 2.2x over the last twelve months, indicating strong order momentum that outpaces revenue recognition.
The order bookings over the last twelve months totaled $2.7 billion, driven by contract awards across MDA’s three business areas, with particularly strong contributions from Satellite Systems and Robotics & Space Operations.
As illustrated in the following charts showing the company’s order bookings and backlog trends:
Cash Position and Balance Sheet
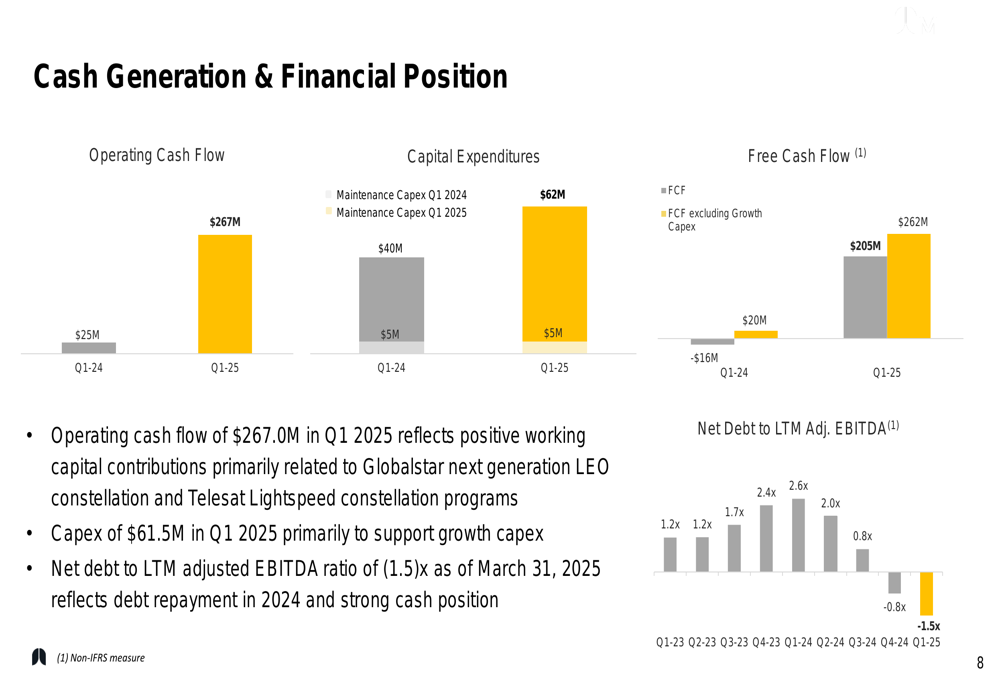
MDA’s financial position strengthened considerably in Q1 2025, with operating cash flow of $267.0 million, compared to $25 million in Q1 2024, reflecting positive working capital contributions. The company reported free cash flow of $40 million (including growth capital expenditures), a significant improvement from negative $16 million in the prior year period.
Capital expenditures totaled $61.5 million in Q1 2025, primarily supporting growth initiatives, with only $5 million allocated to maintenance capex. The company ended the quarter with a net cash position of $376.3 million, resulting in a net debt to LTM adjusted EBITDA ratio of negative 1.5x, representing a substantial improvement from the 2.6x ratio reported a year earlier.
The following chart details MDA’s cash generation and financial position:
Growth Outlook
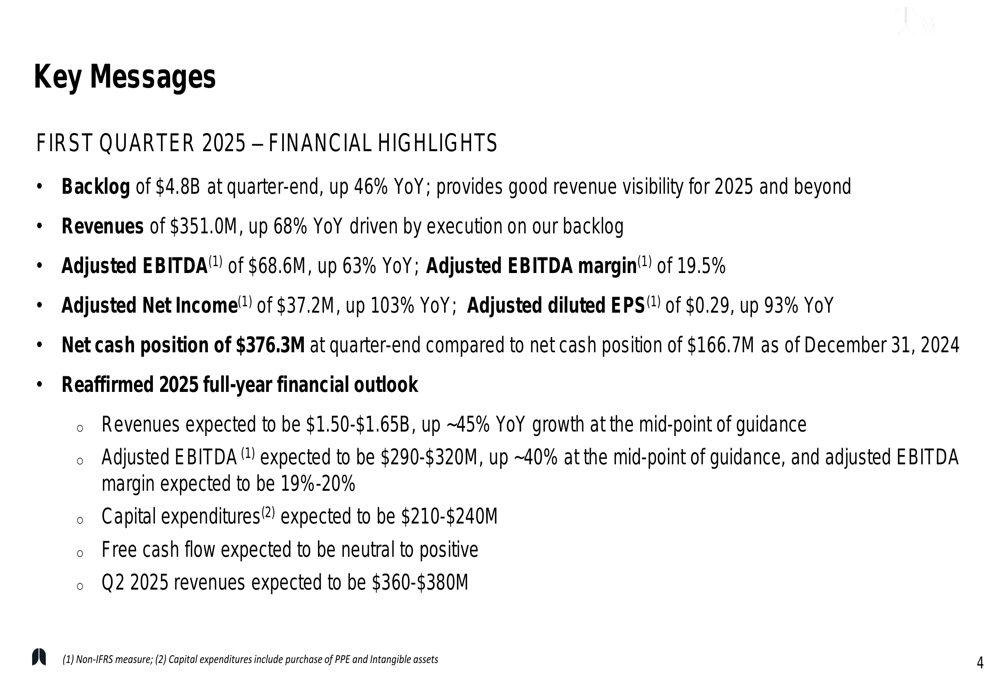
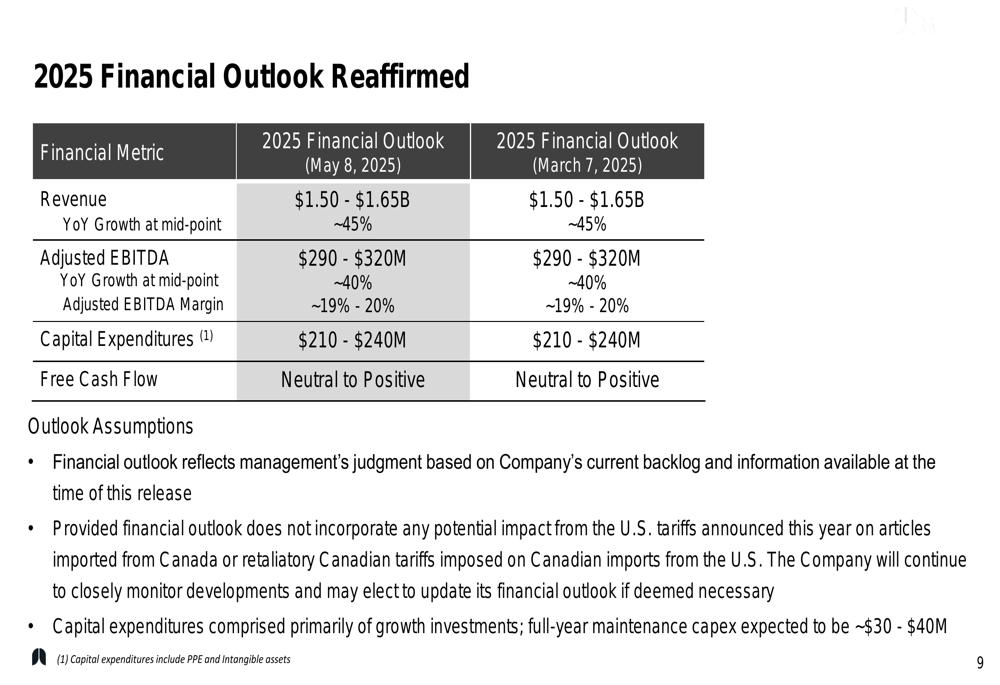
MDA reaffirmed its full-year 2025 financial outlook, projecting revenues of $1.50-$1.65 billion, representing approximately 45% year-over-year growth at the midpoint of the guidance range. The company expects adjusted EBITDA of $290-$320 million, up approximately 40% at the midpoint, with an adjusted EBITDA margin of 19-20%.
Capital expenditures are forecasted at $210-$240 million for the year, with free cash flow expected to be neutral to positive. For the second quarter of 2025, MDA anticipates revenues of $360-$380 million.
The company’s financial outlook is presented in the following slide:
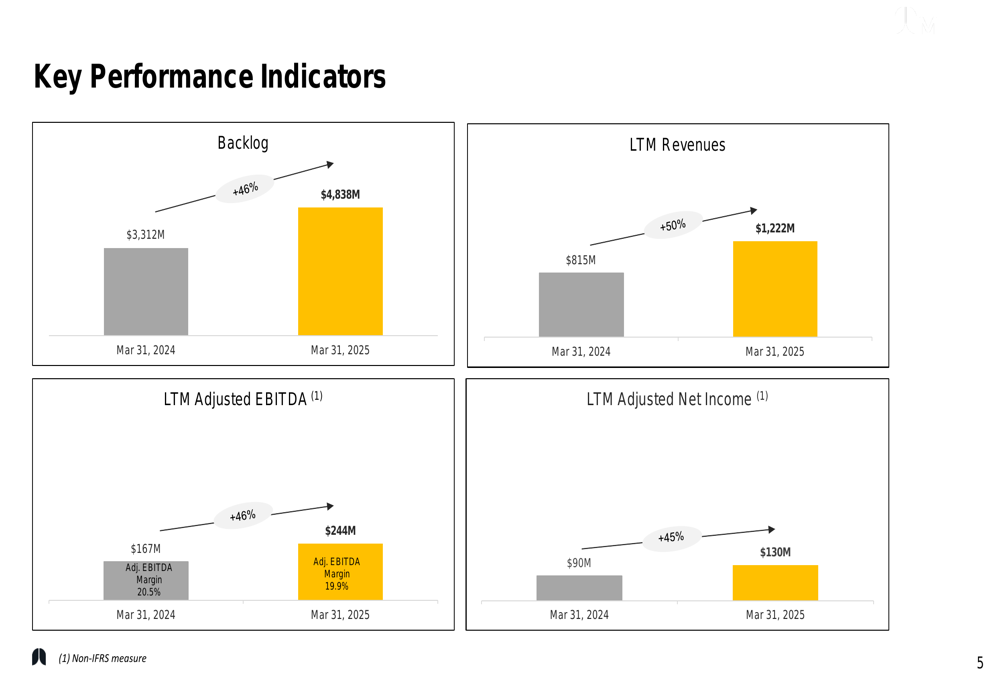
Performance Trends
MDA’s key performance indicators demonstrate consistent growth over multiple quarters. The last twelve months’ revenue reached $1.22 billion as of March 31, 2025, a 50% increase from $815 million a year earlier. Similarly, last twelve months’ adjusted EBITDA grew 46% to $244 million, while adjusted net income increased 45% to $130 million.
These trends highlight the company’s ability to sustain growth momentum while maintaining relatively stable margins despite the rapid expansion.
The following chart illustrates MDA’s key performance indicators and their year-over-year growth:
Forward-Looking Statements
MDA’s management expressed confidence in the company’s growth trajectory, citing strong demand across its business segments and the expanding global space economy. The company’s backlog provides substantial revenue visibility, while its improved cash position offers flexibility for future investments and potential shareholder returns.
The company noted that its financial outlook does not incorporate any potential impact from U.S. tariffs, and that capital expenditures primarily reflect growth investments rather than maintenance requirements.
MDA’s stock closed at $24.64 on May 7, 2025, up 2.75% ahead of the earnings announcement, and has traded between $11.44 and $30.00 over the past 52 weeks.
With its strong market position, technological capabilities, and robust financial performance, MDA appears well-positioned to capitalize on the continued expansion of the global space economy in the coming years.
Full presentation:
This article was generated with the support of AI and reviewed by an editor. For more information see our T&C.