US stock futures inch lower after Wall St marks fresh records on tech gains

Introduction & Market Context
Microchip Technology Inc . (NASDAQ:MCHP) released its fiscal fourth quarter 2025 investor presentation on May 8, 2025, revealing continued revenue challenges amid a broader semiconductor industry downturn. The company reported a significant year-over-year revenue decline while maintaining its focus on strategic initiatives and shareholder returns.
The presentation comes as Microchip navigates a challenging market environment, particularly in Europe, with customers tightly managing inventory and adjusting purchasing plans due to macroeconomic uncertainties. Despite these headwinds, the company’s stock responded positively, rising 4.8% in after-hours trading to $51.50, according to market data.
Quarterly Performance Highlights
Microchip reported GAAP revenue of $970.5 million for Q4 FY25, representing a sequential decline of 5.4% and a substantial year-over-year drop of 26.8%. Despite these challenges, the company maintained a gross margin of 52.0% and an operating margin of 14.0% for the quarter.
As shown in the following quarterly results summary:
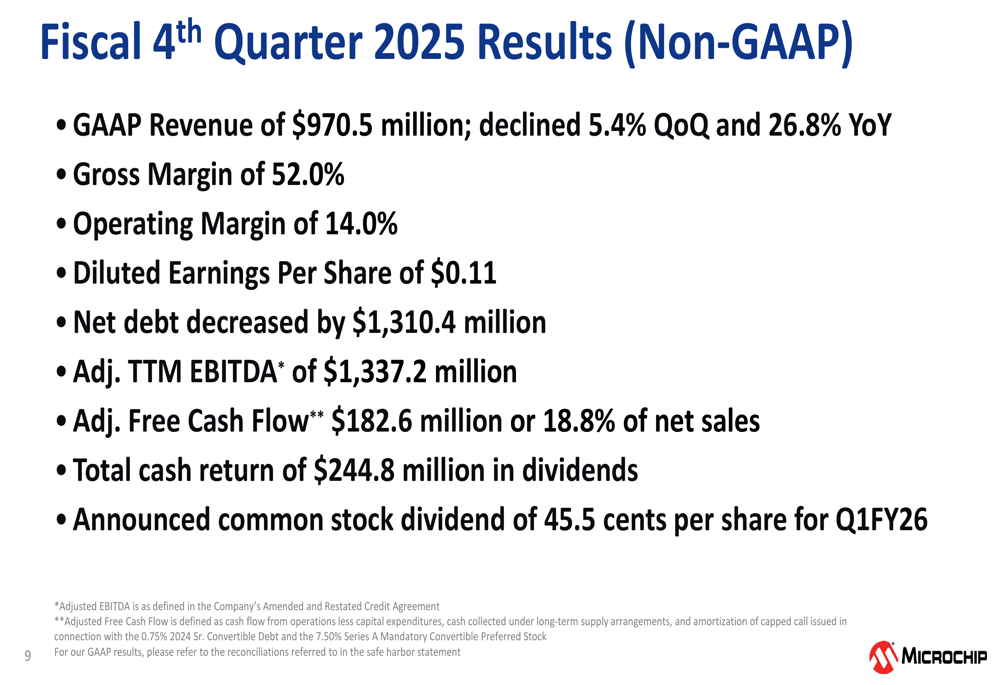
The company’s Q4 non-GAAP diluted earnings per share came in at $0.11, while net debt decreased by $1,310.4 million. Adjusted free cash flow for the quarter was $182.6 million, representing 18.8% of net sales. Microchip continued its shareholder return program with $244.8 million in dividends and announced a common stock dividend of 45.5 cents per share for Q1 FY26.
Detailed Financial Analysis
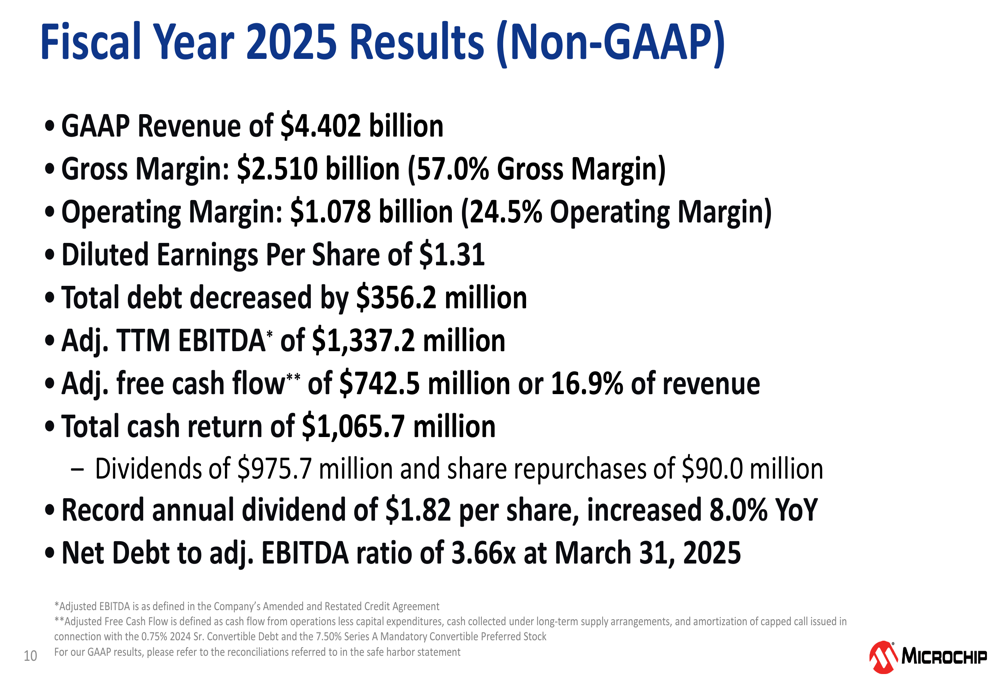
For the full fiscal year 2025, Microchip reported GAAP revenue of $4.402 billion with a gross margin of 57.0% and an operating margin of 24.5%. The company’s non-GAAP diluted earnings per share for the year stood at $1.31.
The full-year financial performance is illustrated in the following slide:
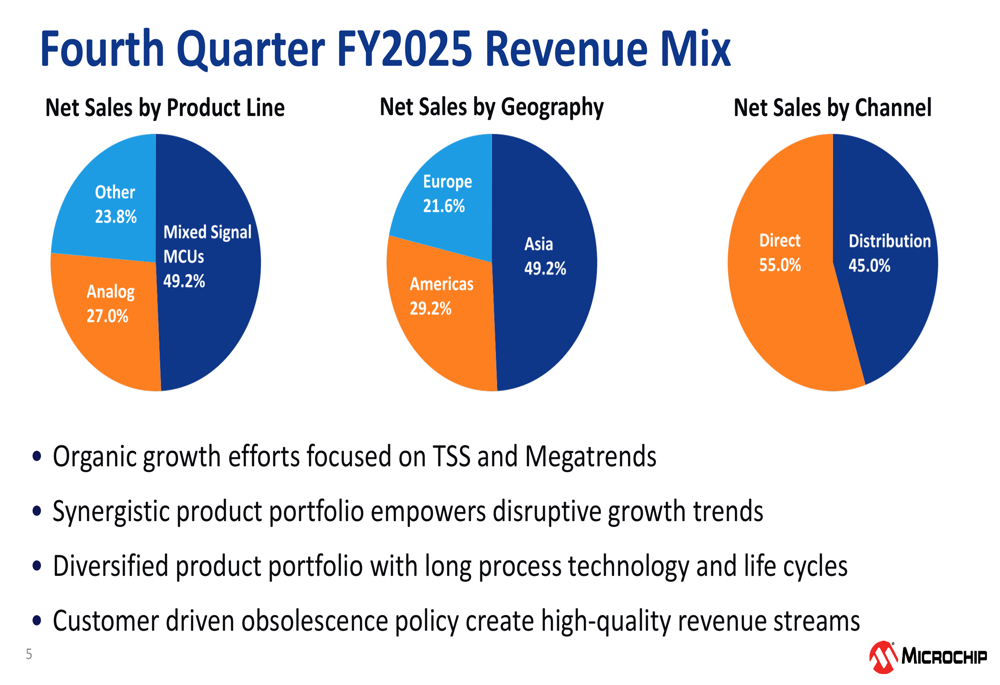
Microchip’s revenue diversification across product lines, geographies, and channels provides some resilience against market volatility. In Q4 FY25, Mixed Signal MCUs accounted for 49.2% of revenue, followed by Analog at 27.0% and Other at 23.8%. Geographically, Asia represented 49.2% of revenue, Americas 29.2%, and Europe 21.6%.
The company’s revenue mix by product, geography, and channel is detailed below:
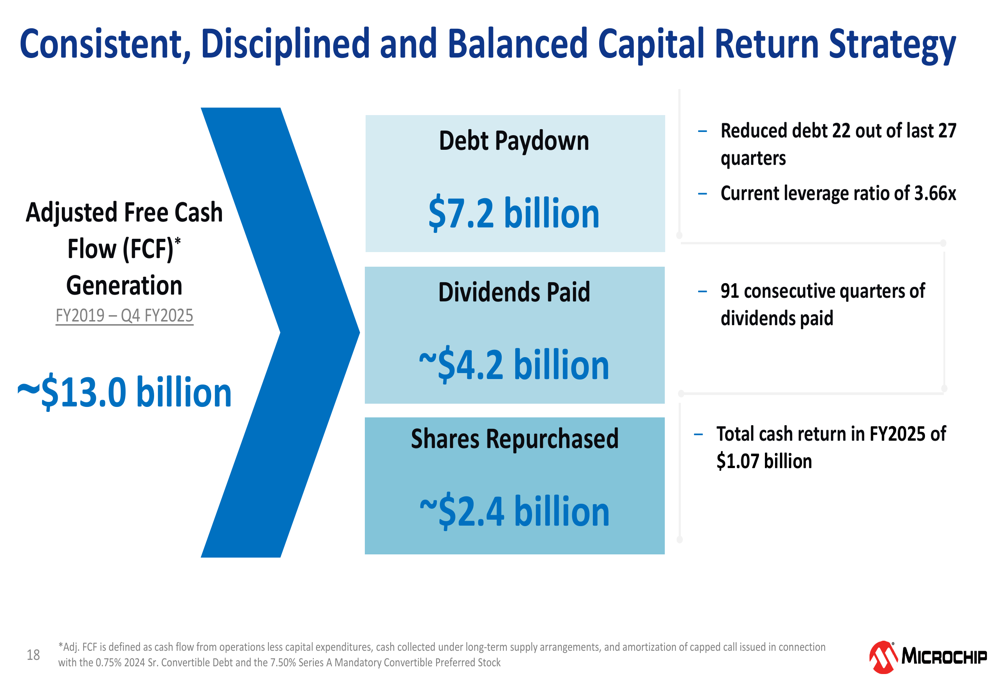
Microchip has demonstrated a consistent focus on capital return to shareholders. Since FY2019 through Q4 FY25, the company has generated approximately $13.0 billion in adjusted free cash flow, allocating $7.2 billion to debt reduction, $4.2 billion to dividends, and $2.4 billion to share repurchases.
The company’s capital allocation strategy is illustrated in the following slide:
Strategic Initiatives
Microchip is executing a strategic pivot toward high-growth megatrends, increasing megatrend-related revenue from 33% to 47% of total revenue. This shift is designed to position the company for accelerated growth as market conditions improve.
The company’s strategic pivot is visualized in the following chart:
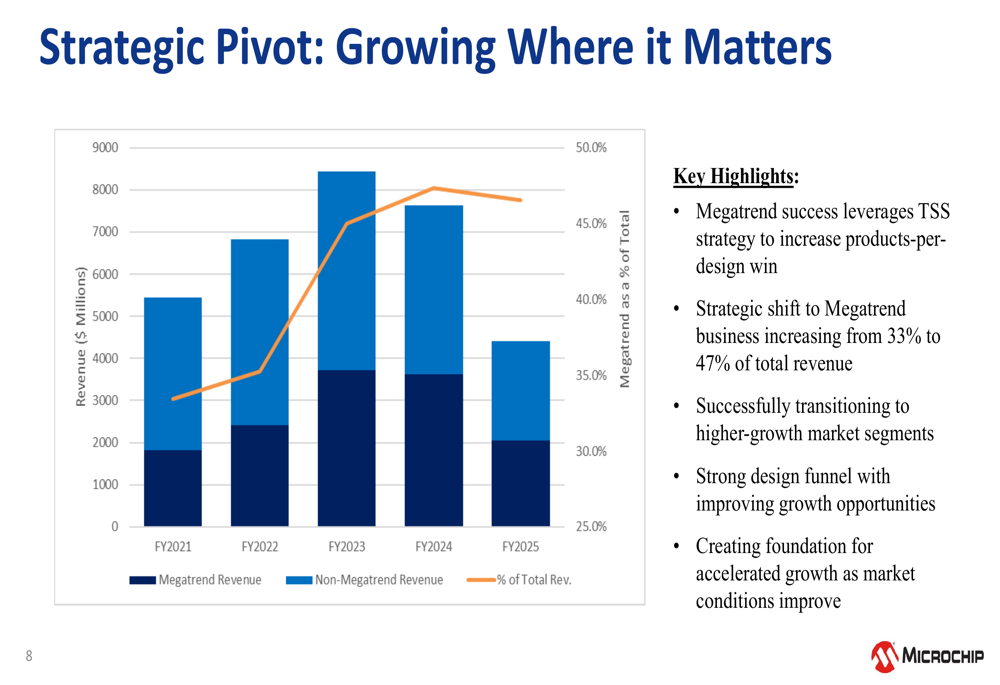
In FY25, Microchip’s revenue by end market showed significant shifts compared to FY24, with Aerospace & Defense growing from 11% to 18% of total revenue, while Industrial declined from 32% to 30% and Automotive from 10% to 8%. This reflects the company’s strategic focus on higher-growth segments.
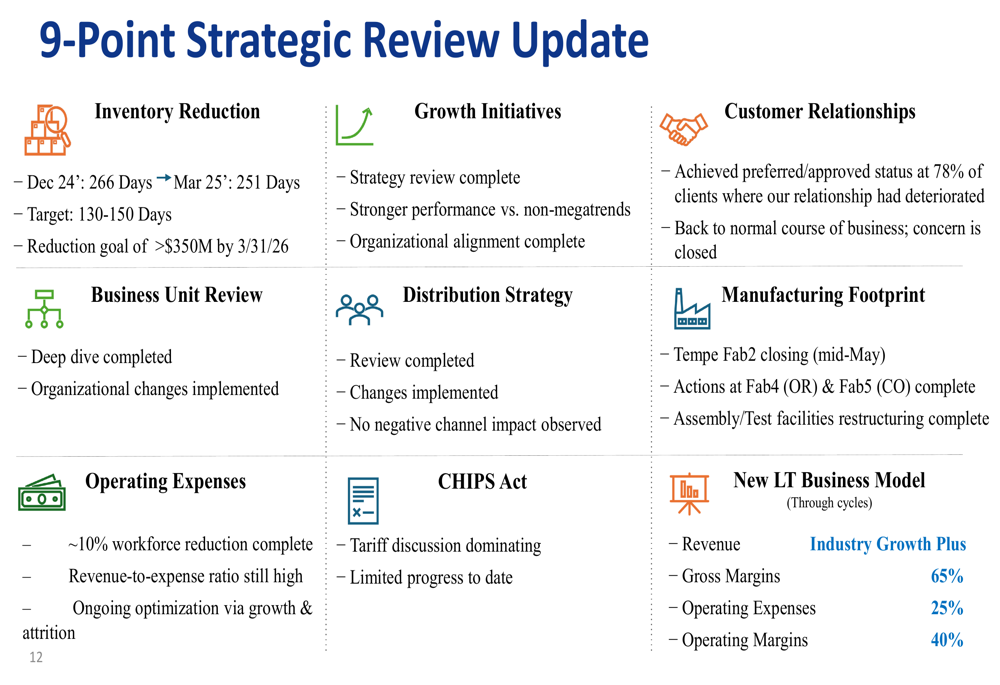
Microchip is also implementing a comprehensive 9-point strategic review to enhance operational efficiency and position for future growth. Key initiatives include inventory reduction from 266 days to 251 days (targeting 130-150 days), business unit review, distribution strategy optimization, manufacturing footprint rationalization, and operating expense management.
The progress on these strategic initiatives is summarized below:
Forward-Looking Statements
Looking ahead to Q1 FY26, Microchip provided guidance showing sequential improvement, with projected GAAP revenue of $1,045.0 million, representing a 7.7% increase from Q4 FY25. The company expects gross margins of 53.2%, operating expenses of 34.1%, operating margins of 19.1%, and earnings per share of $0.22.
The Q1 FY26 guidance compared to Q4 FY25 results and long-term targets is presented below:
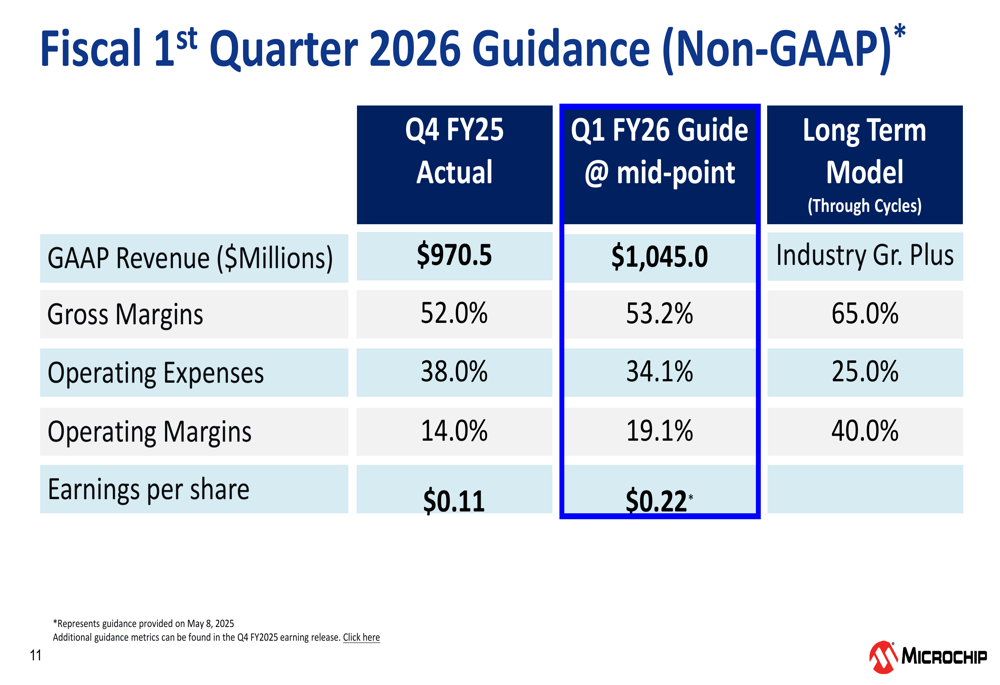
Microchip’s long-term business model targets industry-plus growth rates, with gross margins of 65%, operating expenses of 25%, and operating margins of 40%. While current performance falls short of these targets, the company’s strategic initiatives aim to bridge this gap as market conditions improve.
The company’s focus on megatrends like IoT (53% of FY25 revenue), Data Center (13%), Electric Vehicles (16%), and the addition of AI/ML as a strategic focus area positions Microchip to capitalize on long-term growth opportunities despite near-term challenges.
Microchip’s presentation reflects a company navigating significant market headwinds while maintaining its commitment to strategic transformation and shareholder returns. With 138 consecutive quarters of non-GAAP profitability and 91 consecutive quarters of dividend payments, the company continues to demonstrate financial resilience amid cyclical industry challenges.
Full presentation:
This article was generated with the support of AI and reviewed by an editor. For more information see our T&C.