Gold prices edge higher with focus on Ukraine-Russia, Jackson Hole

National Vision Holdings Inc (NASDAQ:EYE) reported strong first-quarter results for 2025, with accelerating comparable store sales growth and improved profitability, according to the company’s May 7 earnings presentation. The optical retailer’s shares, which closed at $13.33 on May 6, were trading up 6.98% in premarket activity to $14.26, continuing the positive momentum following its Q4 2024 earnings beat.
Quarterly Performance Highlights
National Vision delivered net revenue of $510.3 million in Q1 2025, representing a 5.7% increase compared to the same period last year. Adjusted comparable store sales growth reached 5.5%, significantly higher than the 1.5% reported in Q4 2024 and 0.4% in Q1 2024. This growth was driven by a combination of traffic growth (0.7%) and average ticket increases (4.5%).
"We help people see their best to live their best" remains the company’s core message, which has driven the business for over 30 years according to the presentation.
As shown in the following chart of quarterly performance highlights:
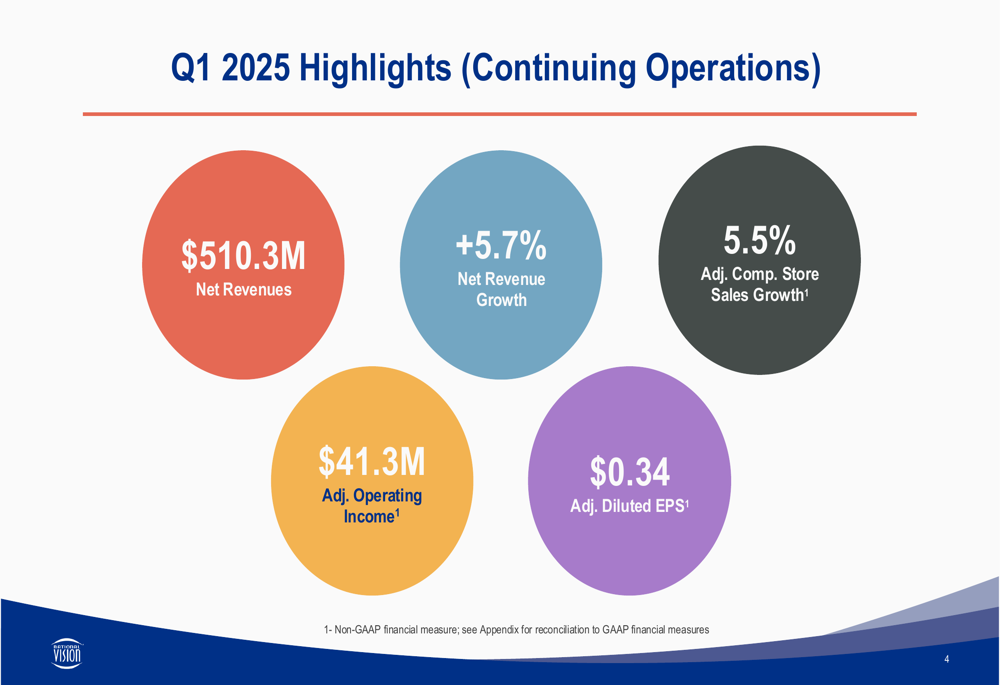
The company’s profitability metrics also showed improvement, with adjusted operating income reaching $41.3 million, up from $33.9 million in Q1 2024. Adjusted diluted earnings per share increased to $0.34, compared to $0.29 in the prior-year period, representing a 17% year-over-year improvement.
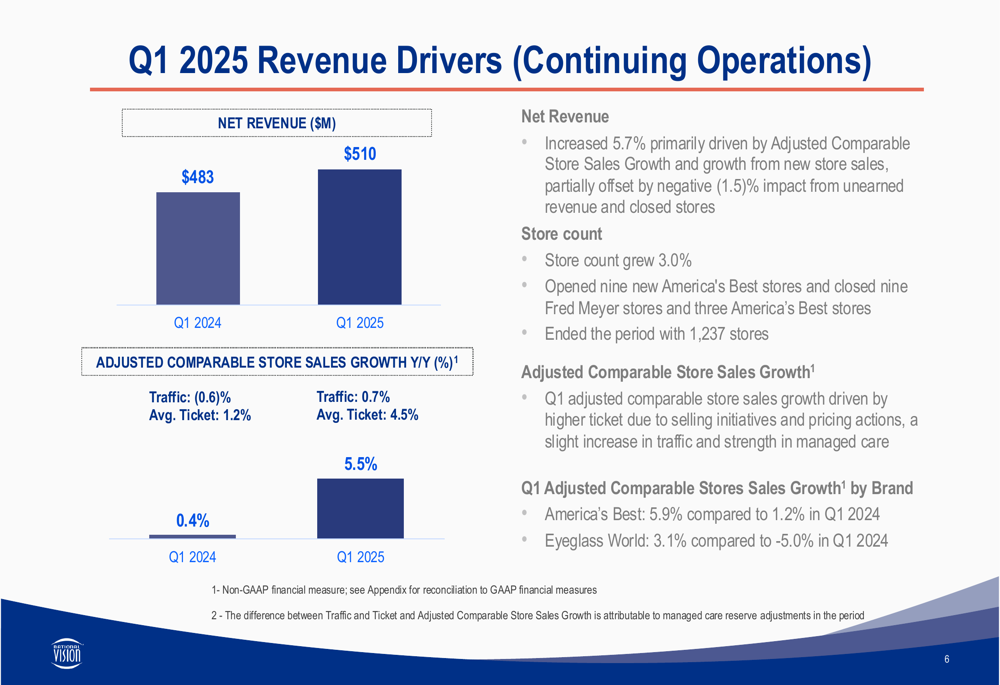
The revenue growth was supported by both new store openings and improved performance at existing locations. Store count grew by 3.0% year-over-year, while the company’s America’s Best banner delivered comparable sales growth of 5.9% and Eyeglass World grew by 3.1%.
The following chart illustrates the revenue drivers for Q1 2025:
Financial Analysis
National Vision’s margin performance showed improvement across multiple metrics. Costs applicable to revenue decreased by 30 basis points to 40.2%, resulting in a 30 basis point increase in gross margin. Adjusted SG&A as a percentage of net revenue decreased by 50 basis points to 47.2%, contributing to the overall improvement in profitability.
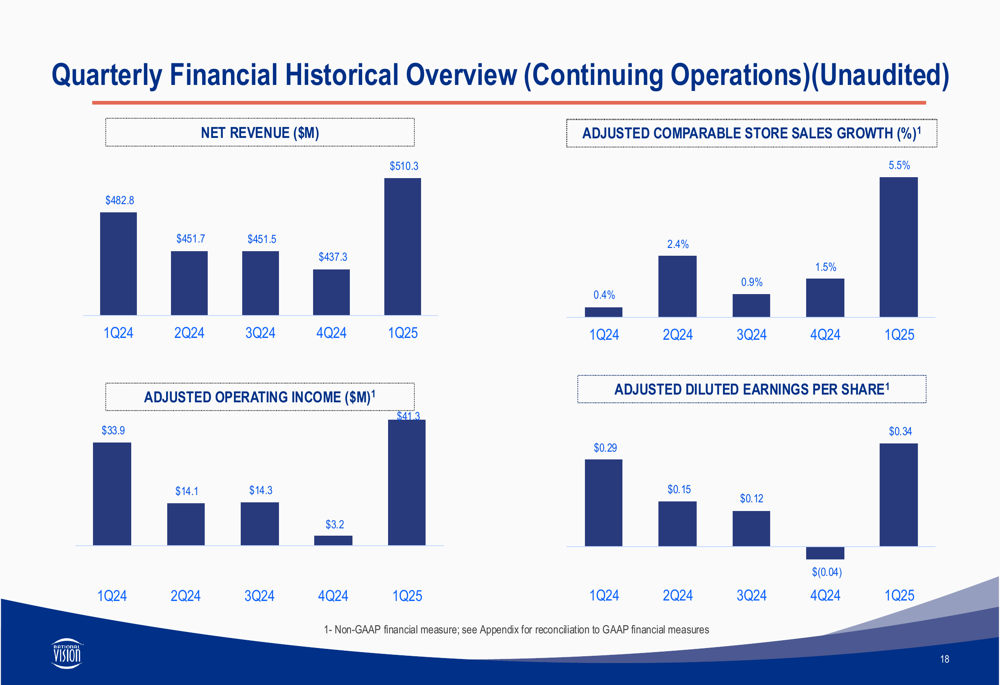
The company’s quarterly results demonstrate a consistent upward trend over the past year, as illustrated in this historical overview:
From a capital structure perspective, National Vision reported $20 million in capital expenditures during Q1, primarily focused on technology investments and new store openings. The company maintains a solid balance sheet with net debt to trailing twelve-month adjusted EBITDA of 1.6x and total liquidity of $374 million, including $80 million in cash.
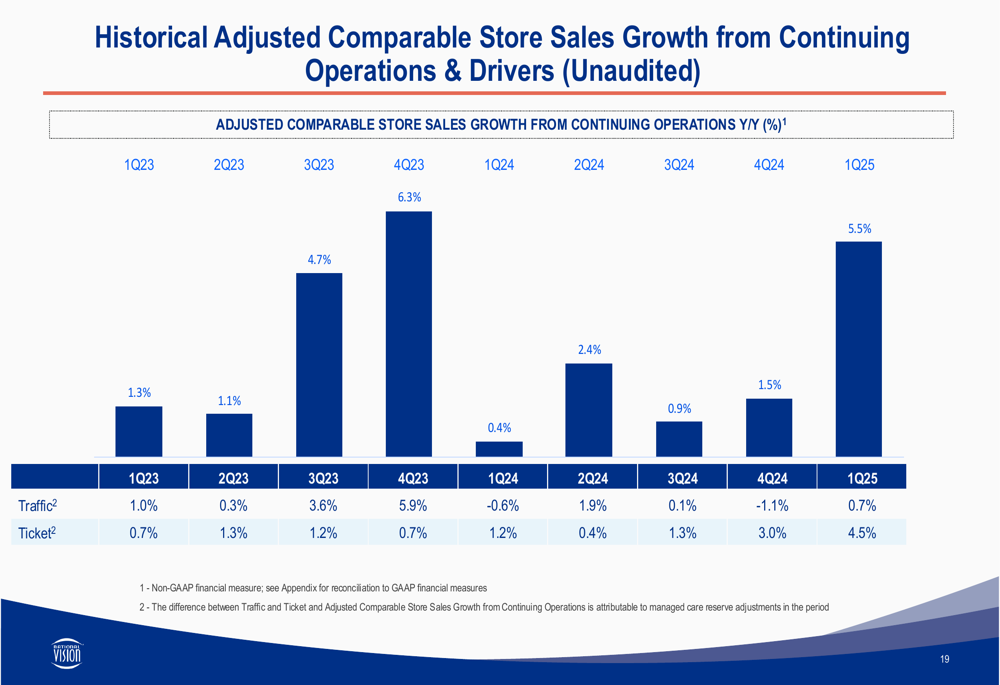
The historical comparable store sales growth trend shows the company’s recent acceleration in performance:
Strategic Initiatives
National Vision’s presentation outlined its ongoing transformation strategy, which consists of two phases. Phase One, initiated in 2022, focused on strengthening the foundation through improved exam capacity and enhanced systems. The company is now executing Phase Two, which began in 2024 and centers on evolving its value offering.
The Phase Two strategy focuses on four key components as illustrated in the following slide:
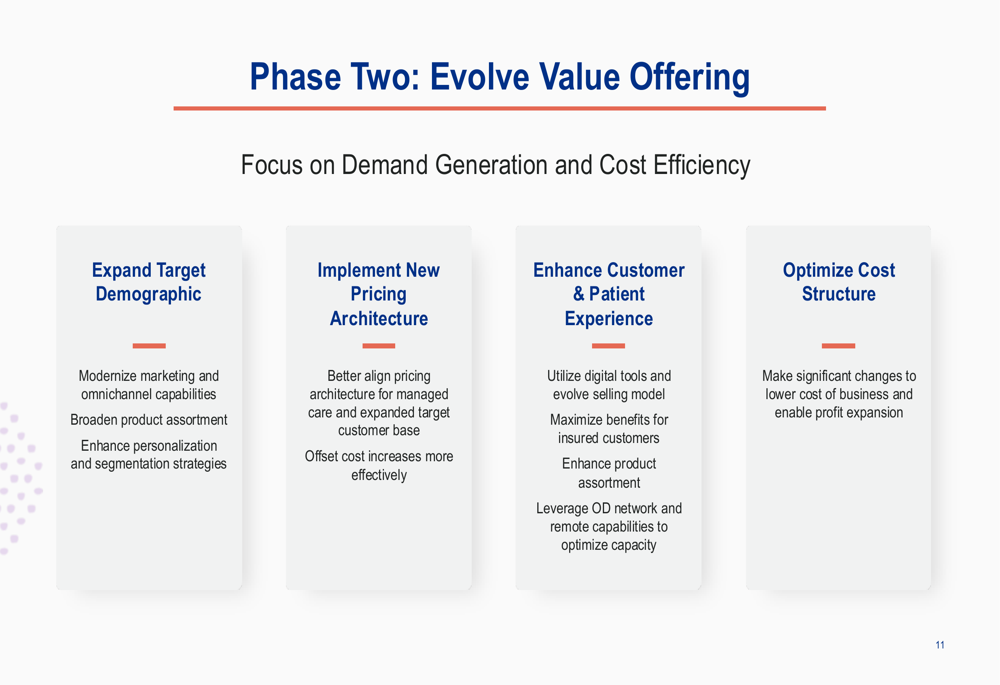
The company is targeting expansion of its demographic reach through modernized marketing, broader product assortment, and enhanced personalization. Additionally, National Vision is implementing a new pricing architecture to better align pricing with costs, while enhancing the customer and patient experience through digital tools and improved product offerings.
Cost optimization remains a priority, with the company making "significant changes to lower cost of business" according to the presentation.
Forward-Looking Statements
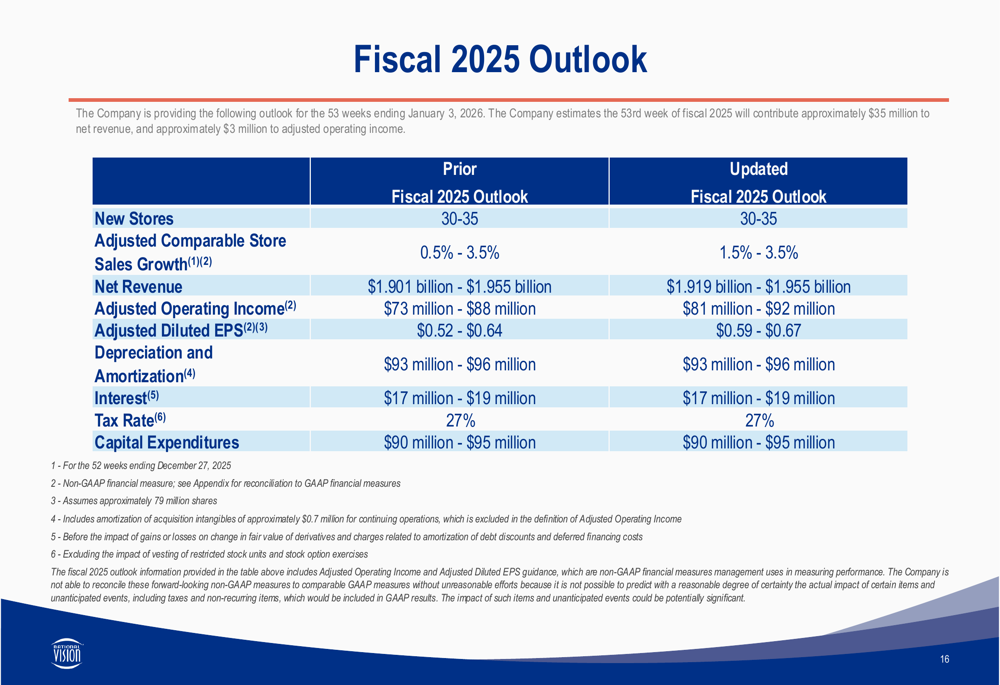
National Vision provided a detailed outlook for fiscal 2025, projecting net revenue between $1.919 billion and $1.955 billion. This guidance includes the impact of a 53rd week in the fiscal year, which is expected to contribute approximately $35 million in additional revenue.
The company’s projected drivers of profitable sales growth are illustrated in this waterfall chart:
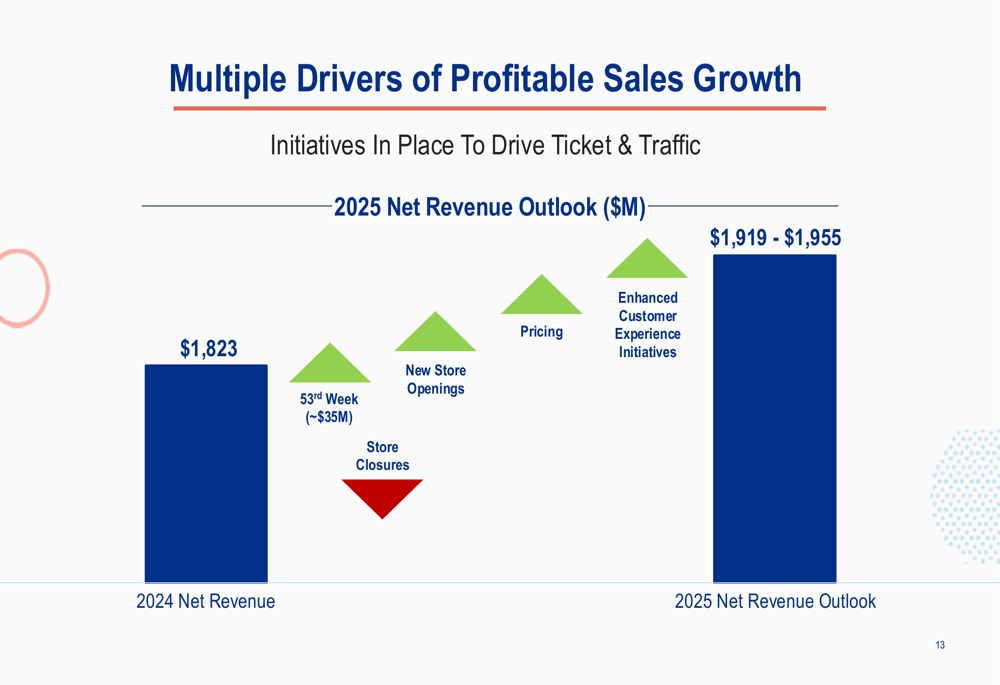
For 2025, National Vision expects adjusted comparable store sales growth of 1.5% to 3.5%, adjusted operating income of $81 million to $92 million, and adjusted diluted EPS of $0.59 to $0.67. The company plans to open 30-35 new stores during the year.
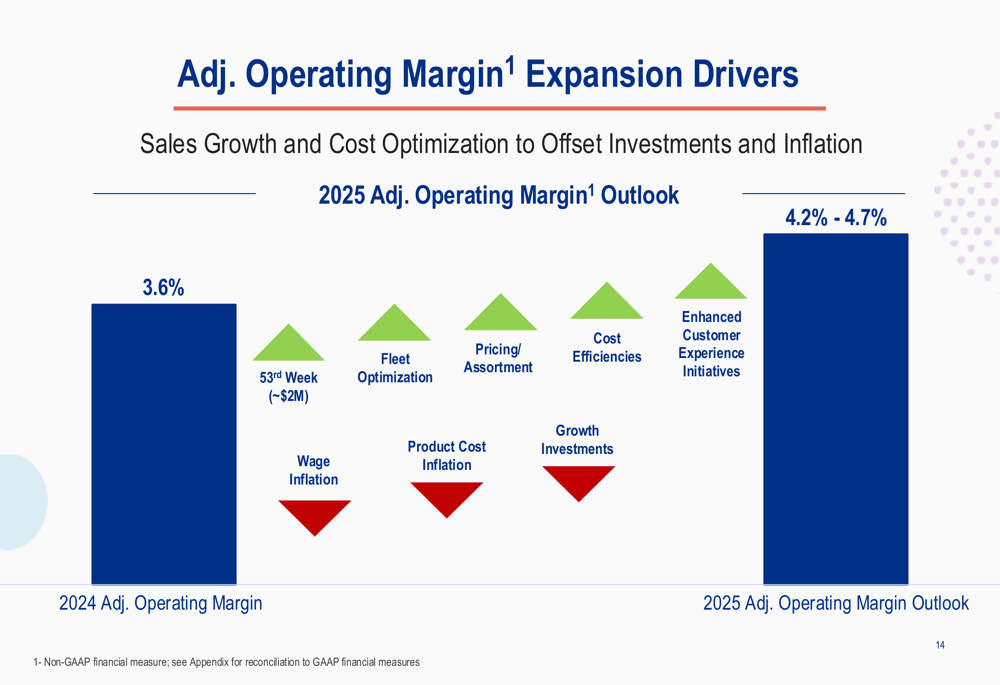
The company also expects to see operating margin expansion in 2025, with adjusted operating margin projected to reach 4.2%-4.7%, up from 3.6% in 2024. This expansion will be driven by fleet optimization, pricing/assortment improvements, and cost efficiencies, partially offset by wage and product cost inflation.
The drivers of adjusted operating margin expansion are shown in the following chart:
Capital allocation priorities for 2025 include investing in growth through $90-$95 million in capital expenditures for technology and new stores, as well as repaying the May 2025 convertible notes using cash on hand and available liquidity. The company emphasized its commitment to maintaining a healthy balance sheet and disciplined capital plan to create long-term shareholder value.
The comprehensive fiscal 2025 outlook is presented in the following table:
National Vision’s Q1 2025 results and strategic initiatives suggest the company is successfully executing its transformation plan, with improving financial metrics and a clear roadmap for continued growth. Investors appear to be responding positively to the company’s progress, as reflected in the premarket stock movement following the presentation.
Full presentation:
This article was generated with the support of AI and reviewed by an editor. For more information see our T&C.