BitMine stock falls after CEO change and board appointments

Introduction & Market Context
NCAB Group, a global printed circuit board (PCB) specialist, presented its third-quarter 2025 results on October 24, showing signs of recovery with improved order intake and sequential growth. The company’s stock responded positively, jumping 10.67% to close at 51.55, reflecting investor optimism about the company’s trajectory.
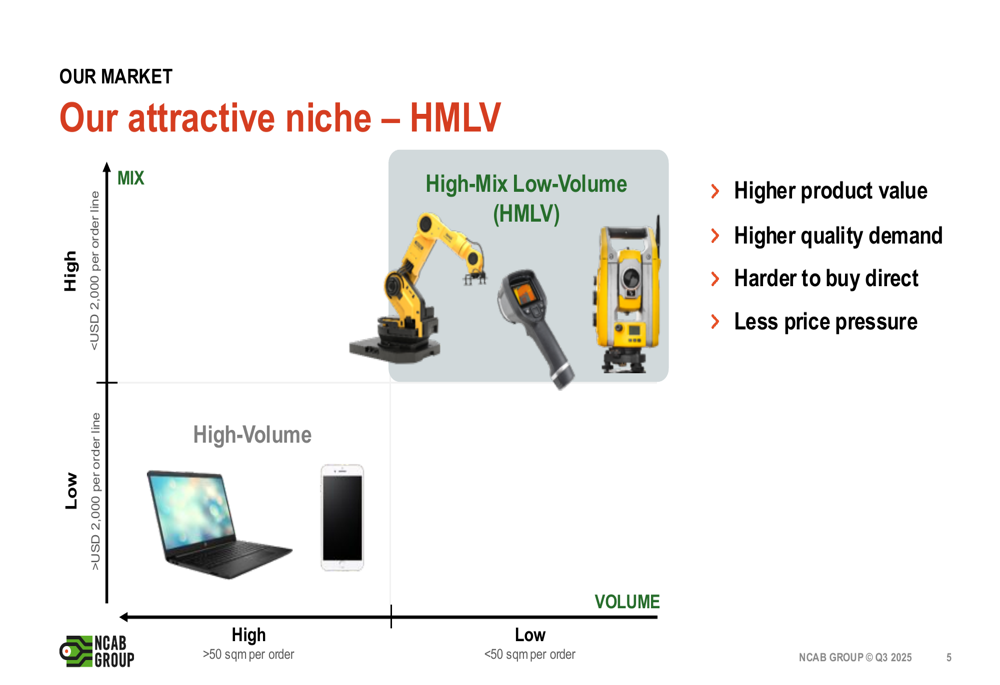
Operating in the high-mix, low-volume (HMLV) PCB niche, NCAB positions itself in a market segment characterized by higher product value and quality demands, with less direct price pressure than mass-produced electronics. This strategic focus has helped the company navigate recent market challenges.
As shown in the following chart, NCAB has identified its target market segment as high-mix, low-volume, which offers several competitive advantages:
Quarterly Performance Highlights
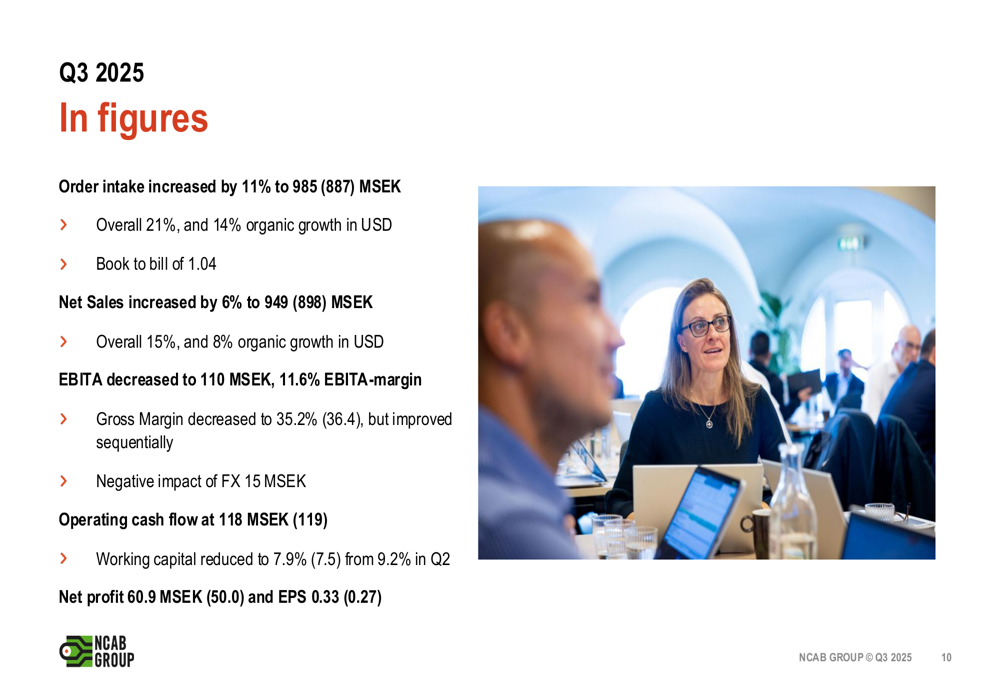
NCAB reported a 6% increase in net sales to 949 MSEK for Q3 2025, while order intake grew by 11% to 985 MSEK. The book-to-bill ratio of 1.04 indicates potential for continued growth in the coming quarters. However, EBITA decreased to 110 MSEK with an 11.6% margin, down from 13.2% in the comparable period.
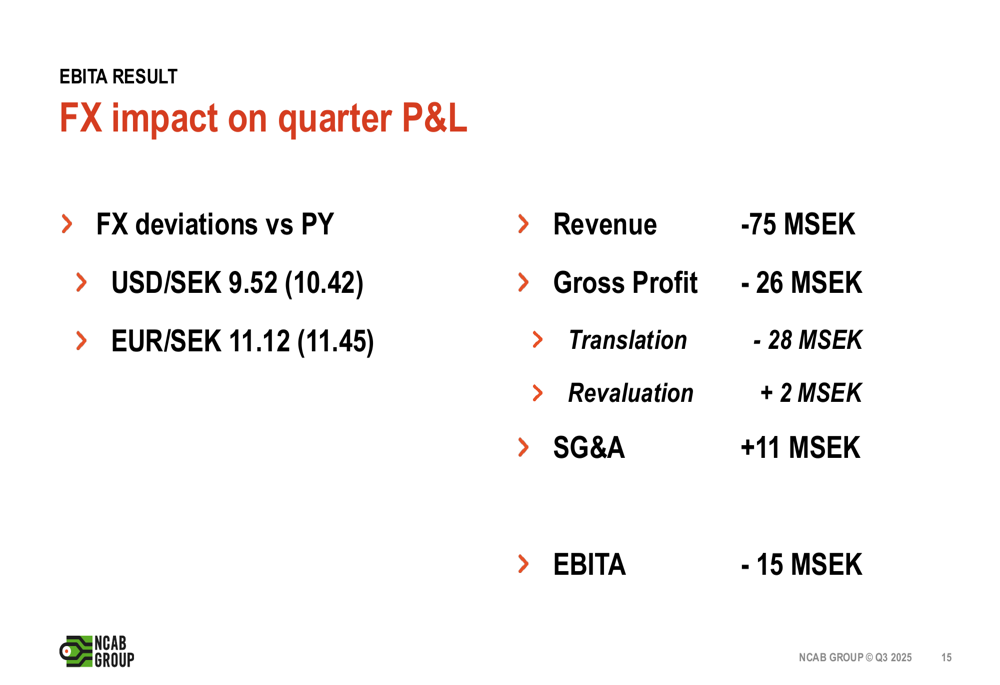
The company’s performance was significantly impacted by foreign exchange headwinds, with the US dollar decline creating a 75 MSEK negative impact on net sales. Despite these challenges, the underlying business showed resilience with 21% overall growth in USD terms and 14% organic growth.
The following slide summarizes the key financial metrics for the quarter:
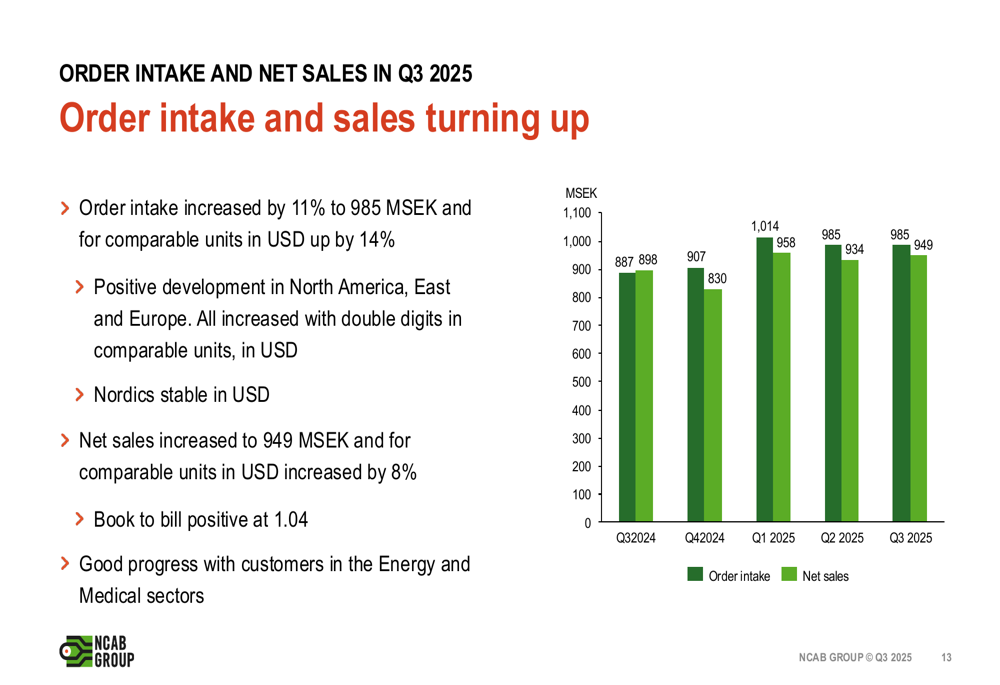
Order intake and net sales have been trending upward over the past several quarters, suggesting a gradual recovery from previous market softness:
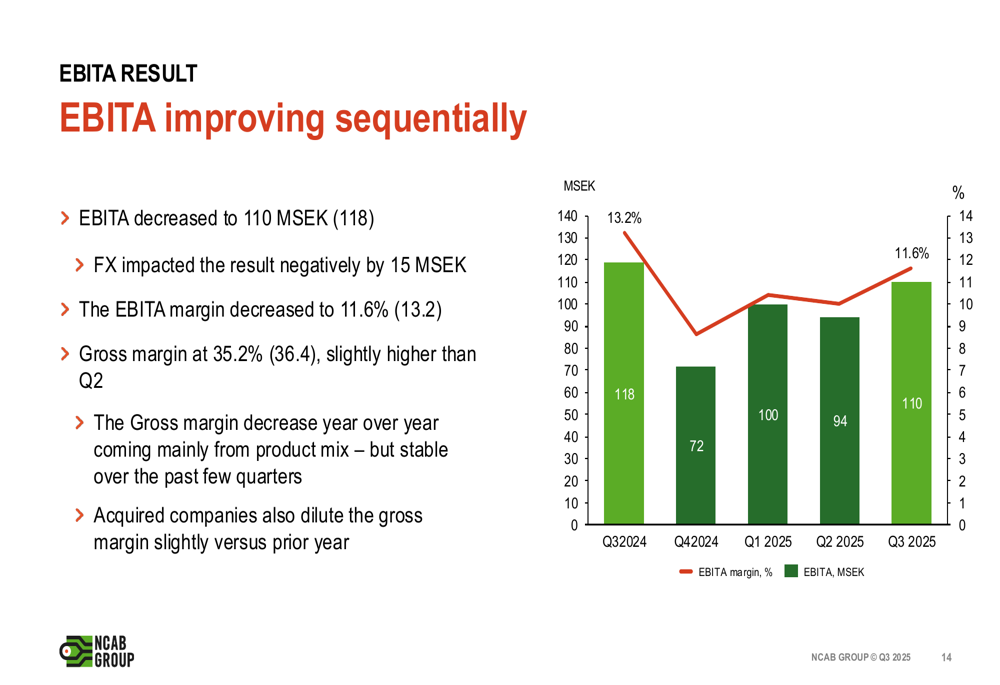
While EBITA margins have contracted year-over-year, they show sequential improvement, indicating potential stabilization:
Detailed Financial Analysis
NCAB’s gross margin decreased to 35.2% from 36.4% in Q3 2024, though it showed slight improvement compared to Q2 2025. The company’s net profit reached 60.9 MSEK, with earnings per share of 0.33 SEK, representing a 22% increase year-over-year according to the earnings report.
Foreign exchange fluctuations significantly impacted quarterly results, with the following breakdown of FX effects:
Performance varied across NCAB’s geographic segments:
- Nordic: Net sales remained flat at 203 MSEK with an EBITA margin of 12.4%
- Europe: Net sales increased by 7% to 464 MSEK with an EBITA margin of 9.8%
- North America: Net sales grew by 9% to 225 MSEK with an EBITA margin of 15.4%
- East: Net sales increased by 4% to 58 MSEK with an EBITA margin of 16.4%
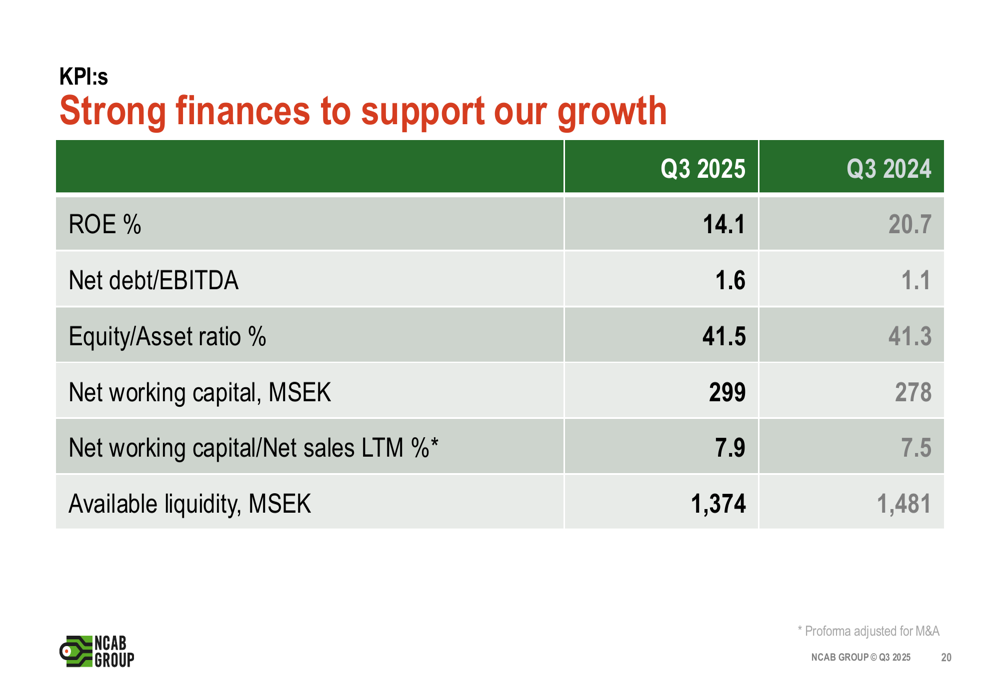
Key performance indicators show some pressure on profitability metrics, with return on equity declining to 14.1% from 20.7% in Q3 2024, while the net debt to EBITDA ratio increased to 1.6 from 1.1:
Strategic Initiatives
NCAB continues to diversify its sourcing strategy, significantly reducing its reliance on China. In 2018, 95% of the company’s sourcing came from China, but by 2024, this had decreased to 74%, with increased sourcing from Europe (14%), Taiwan (6%), USA (3%), and other countries (3%).
The company’s revenue distribution across sectors shows a strong focus on industrial applications (47%), followed by medical (14%), automotive (13%), power (11%), defense (6%), and telecom (4%). This diversification helps mitigate risks associated with sector-specific downturns.
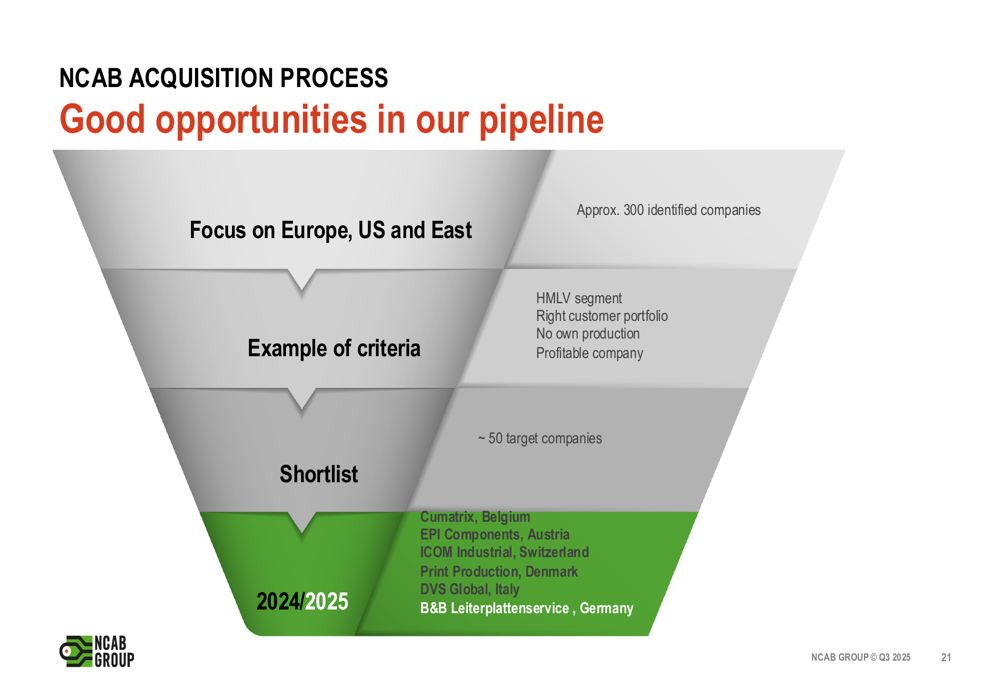
NCAB maintains an active acquisition strategy, with approximately 300 identified target companies and a shortlist of around 50 candidates. This approach aligns with the company’s growth strategy of geographical expansion and market consolidation.
The acquisition pipeline is illustrated in the following slide:
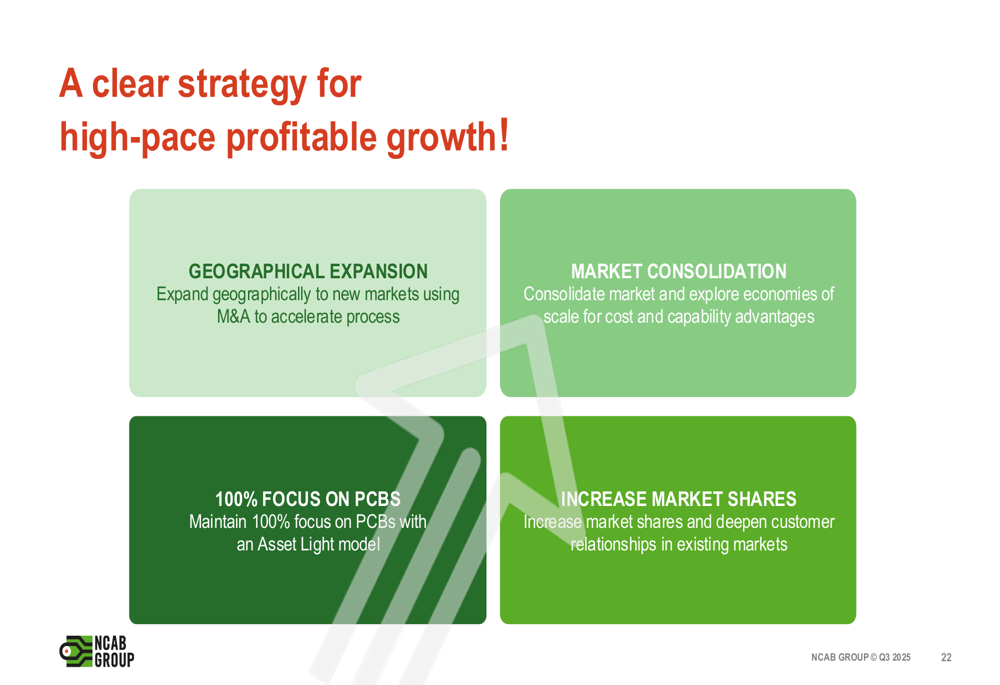
The company’s overall strategy for profitable growth focuses on four key pillars:
Forward-Looking Statements
NCAB’s management expressed cautious optimism about future growth, highlighting the gradual improvement in order intake as a positive indicator. The company plans to continue its merger and acquisition activities to drive consolidation in the fragmented PCB market.
According to CEO Peter Kruk, the company remains committed to its 100% focus on PCBs while maintaining an asset-light business model. The ongoing implementation of a new IT platform that leverages data and AI is expected to deliver benefits in 2026-2027.
Market analysts have noted NCAB’s relatively high P/E ratio of 59.29, suggesting a premium valuation despite recent challenges. With the stock trading at $51.55, it remains approximately 27% below its 52-week high of $71, potentially indicating room for recovery if the positive trends in order intake and revenue continue.
The company faces ongoing challenges from economic uncertainty and potential tariff impacts, particularly in North America. However, its strategic focus on the high-mix, low-volume segment and continued geographic diversification position NCAB to navigate these challenges while pursuing long-term growth opportunities.
Full presentation:
This article was generated with the support of AI and reviewed by an editor. For more information see our T&C.