ION expands ETF trading capabilities with Tradeweb integration

Introduction & Market Context
Nilfisk Holding A/S (CPH:NLFSK) presented its Q2 2025 results on August 14, revealing a slight revenue decline but maintaining EBITDA margins within the company's target range. The cleaning equipment manufacturer's stock rose 4.5% following the presentation, reaching 95.5 DKK, showing investor confidence despite mixed results.
The global cleaning solutions provider, which operates in over 100 countries through 40+ sales companies, reported continued growth in EMEA and APAC regions while facing persistent challenges in the Americas. This quarter's performance follows a disappointing Q1 where revenue missed forecasts, but shows signs of stabilization in key metrics.
Quarterly Performance Highlights
Nilfisk reported Q2 2025 revenue of 268.9 million euros, representing an organic decline of 1.1% compared to Q2 2024. Despite this slight contraction, the company achieved an EBITDA before special items of 36.4 million euros, corresponding to a margin of 13.5% – within the company's full-year target range of 13-14%.
As shown in the following financial summary:
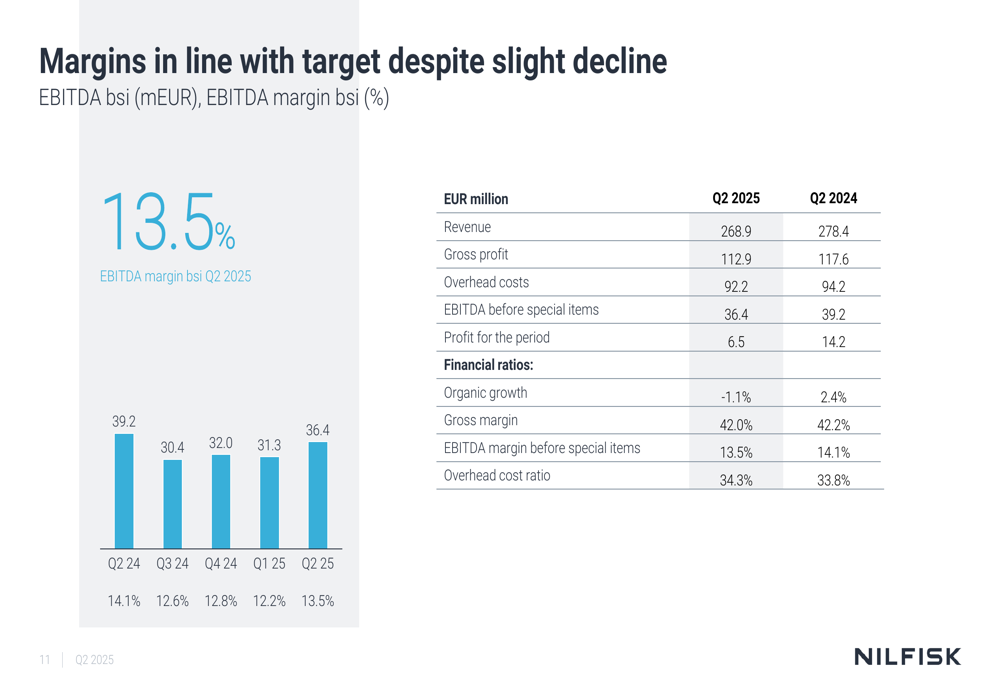
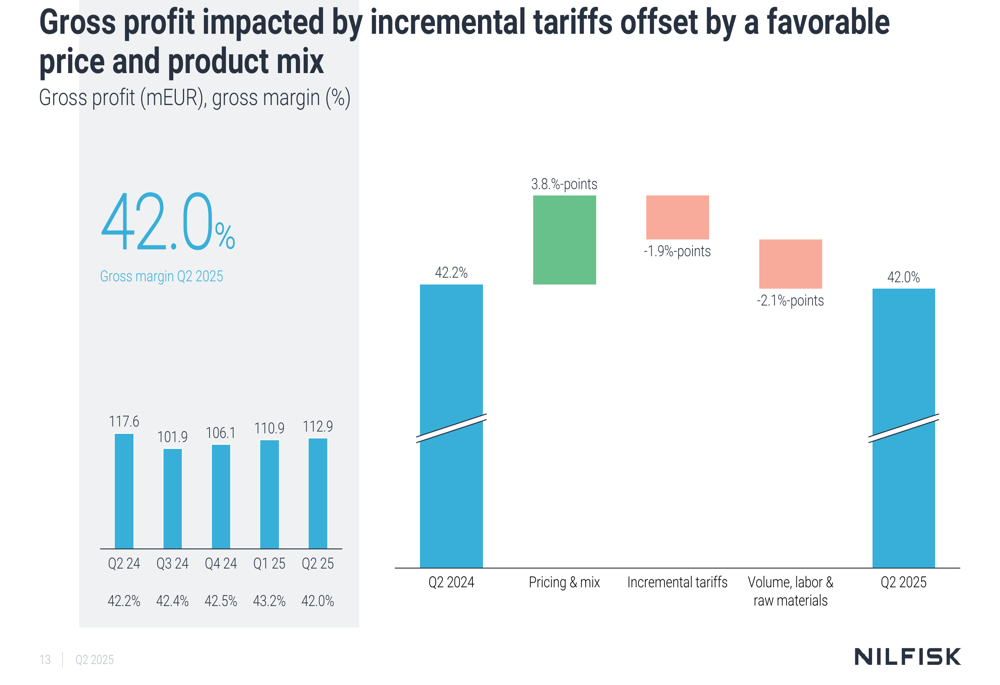
Profit for the period decreased significantly to 6.5 million euros, down from 14.2 million euros in Q2 2024. The gross margin remained relatively stable at 42.0%, only slightly below the 42.2% achieved in the same period last year, despite facing headwinds from incremental tariffs.
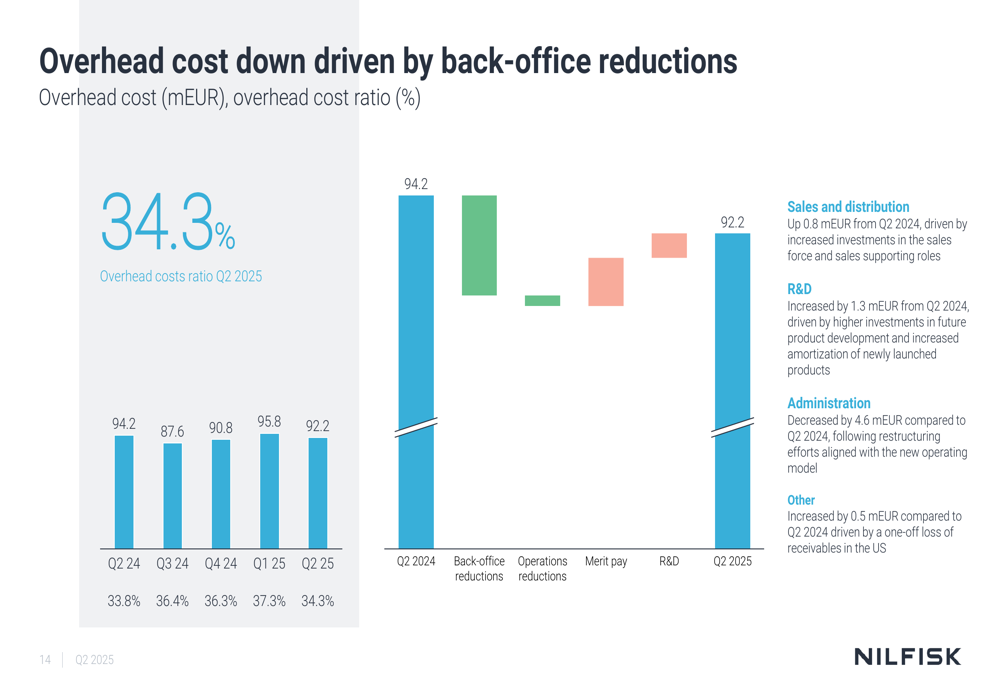
The company successfully reduced overhead costs from 94.2 million euros in Q2 2024 to 92.2 million euros in Q2 2025, with notable decreases in administration costs following restructuring efforts aligned with the new operating model. However, the overhead cost ratio increased slightly to 34.3% from 33.8% due to the lower revenue base.
Regional Performance Analysis
Nilfisk's performance varied significantly across regions, with EMEA and APAC showing growth while Americas continued to struggle. The company derives 60% of its revenue from EMEA, 33% from Americas, and 7% from APAC.
The regional breakdown of organic growth reveals:
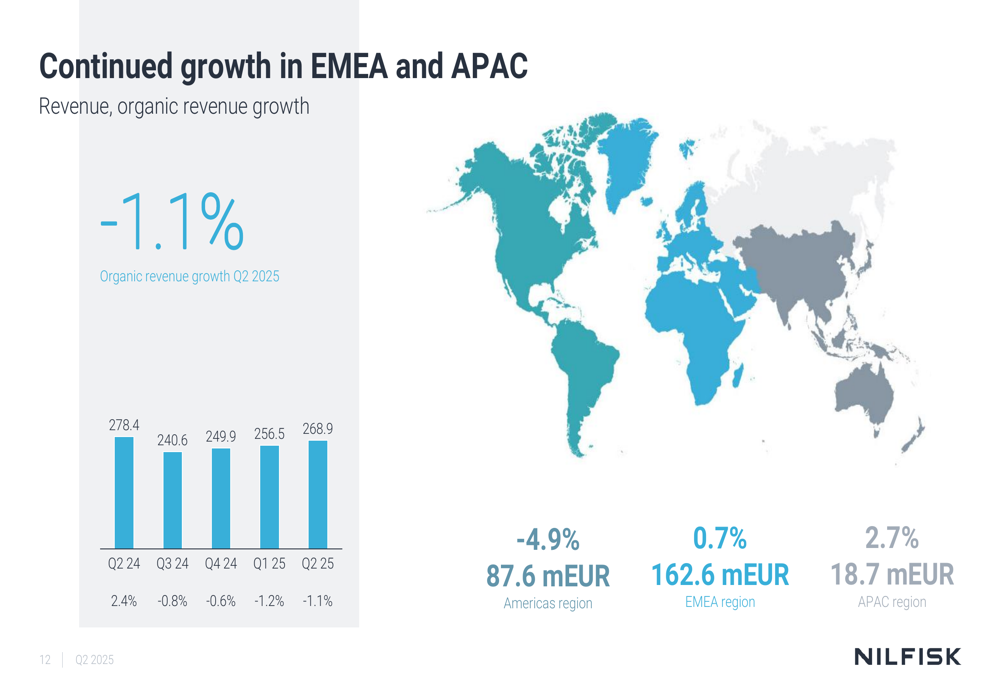
EMEA, Nilfisk's largest market, delivered 0.7% organic growth, with solid contributions from Southern Europe and the UK. The company reported market share gains in this region, which remains a bright spot in the overall performance.
The Americas segment continued to face challenges with a 4.9% organic decline, although the company noted sequential improvement. The negative growth was attributed to backlog issues, soft demand, and lower production capacity. This continues a trend seen in Q1 2025, where Americas also underperformed.
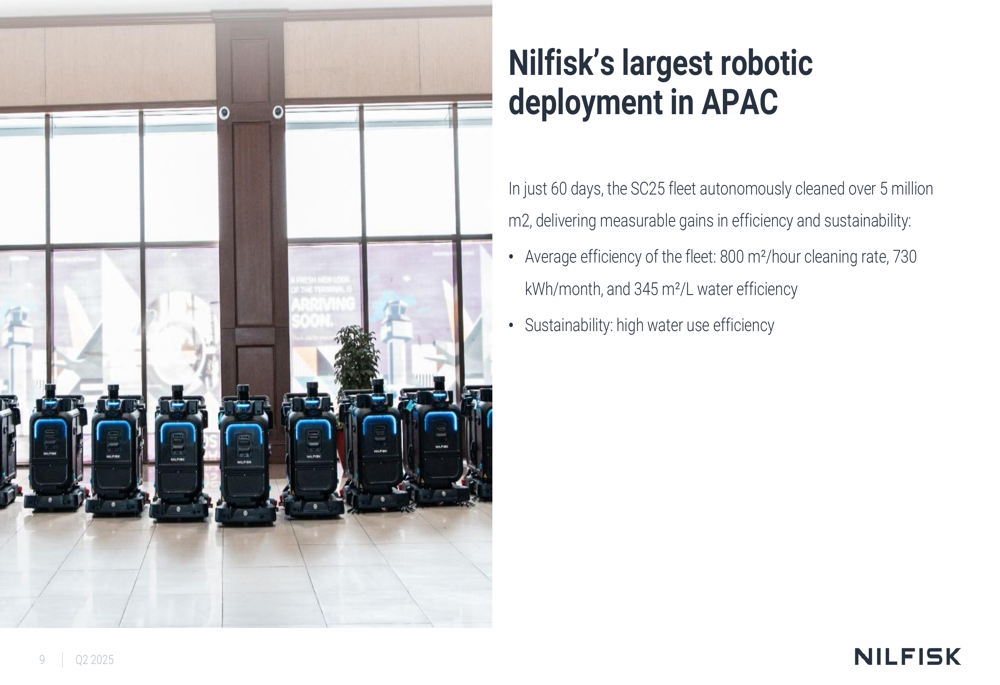
APAC delivered the strongest performance with 2.7% organic growth, marking another consecutive quarter of expansion. The company highlighted major wins in India, South Korea, and Australia as key drivers. Nilfisk also showcased its robotic deployment success in the region, where its SC25 fleet cleaned over 5 million square meters in just 60 days.
Strategic Initiatives and Outlook
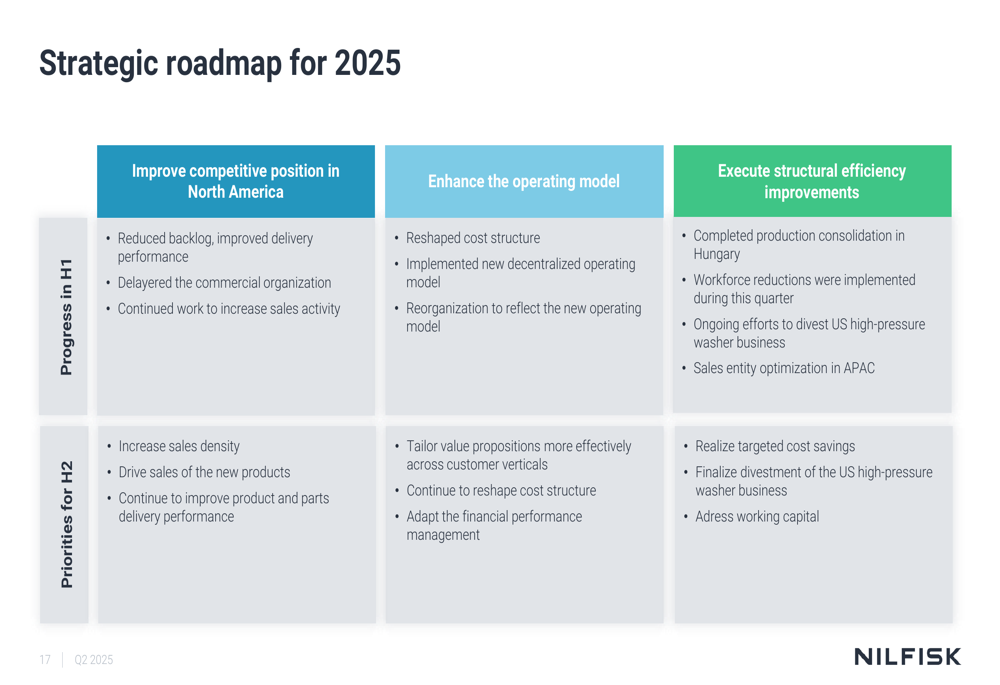
Nilfisk outlined several operational achievements during Q2, including the completion of production consolidation in Hungary, reallocation of resources to frontline commercial positions, and implementation of cost reduction measures including workforce reductions. The company also launched a new mid-size sweeper, the SW3000, and had its Net-Zero GHG emission reduction targets validated.
Looking forward, Nilfisk maintained its full-year 2025 guidance:
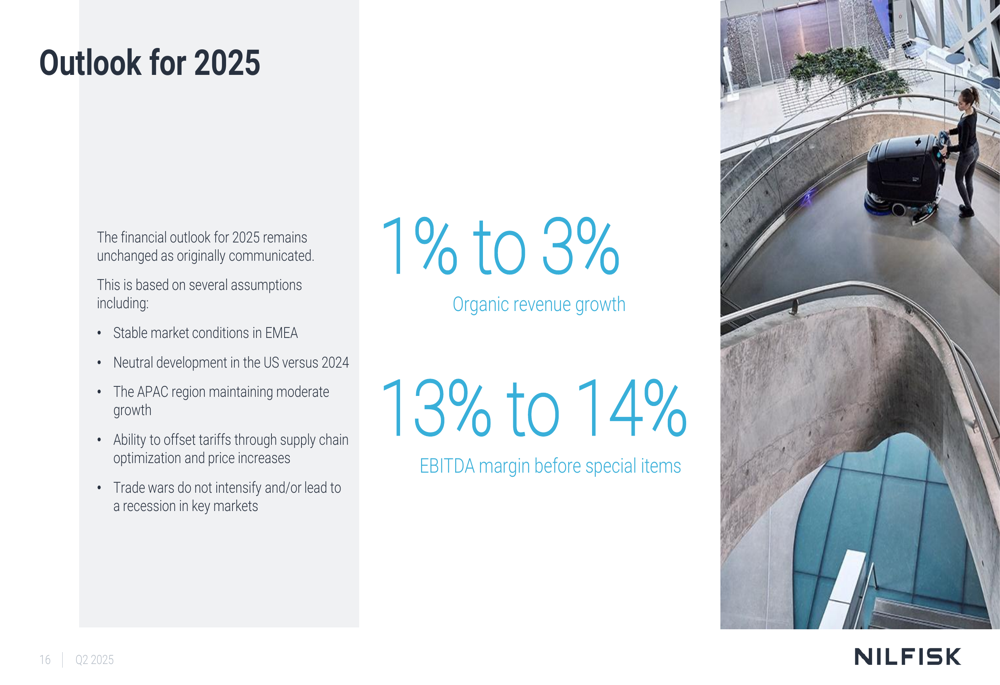
The company's strategic roadmap for 2025 focuses on three key areas: improving competitive position in North America, enhancing the operating model, and executing structural efficiency improvements. Specific initiatives include reducing backlog, improving delivery performance, reshaping cost structure, and addressing working capital issues.
Financial Position and Cash Flow
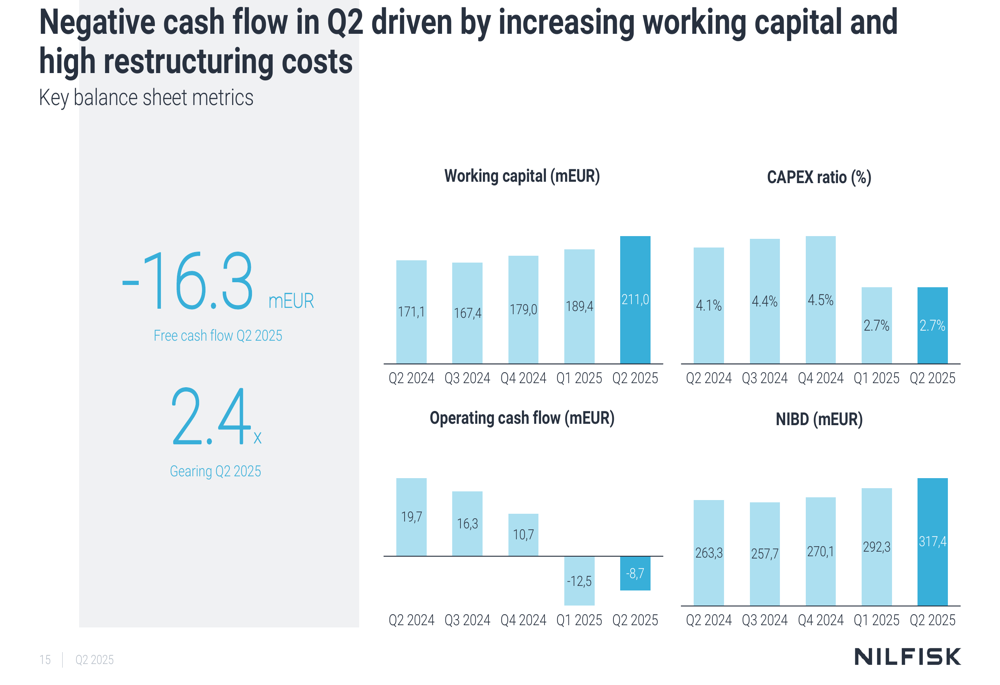
Nilfisk reported negative free cash flow of 16.3 million euros for Q2 2025, continuing a trend seen in Q1 where free cash flow was -19.8 million euros. The company's financial gearing increased slightly to 2.4x from 2.2x in Q1 2025.
The following chart illustrates key financial metrics:
The gross profit analysis reveals how pricing and mix positively impacted margins, while incremental tariffs and volume, labor, and raw material costs had negative effects. Despite these pressures, the company managed to maintain a relatively stable gross margin.
In conclusion, Nilfisk's Q2 2025 results present a mixed picture with regional disparities and margin stability amid revenue challenges. The company's focus on cost reduction and operational efficiency appears to be offsetting some market headwinds, as reflected in the positive stock price movement following the presentation. However, continued challenges in the Americas segment and negative free cash flow remain areas of concern as Nilfisk works toward achieving its full-year targets.
Full presentation:
This article was generated with the support of AI and reviewed by an editor. For more information see our T&C.