5 big analyst AI moves: Apple lifted to Buy, AI chip bets reassessed

O-I Glass Inc. (NYSE:OI) reported a 20% increase in adjusted earnings per share for the second quarter of 2025, despite facing mixed market conditions and volume challenges. The company’s presentation on July 30, 2025, highlighted strong progress in its cost-saving initiatives and an improved full-year outlook, prompting management to raise guidance for the year.
Quarterly Performance Highlights
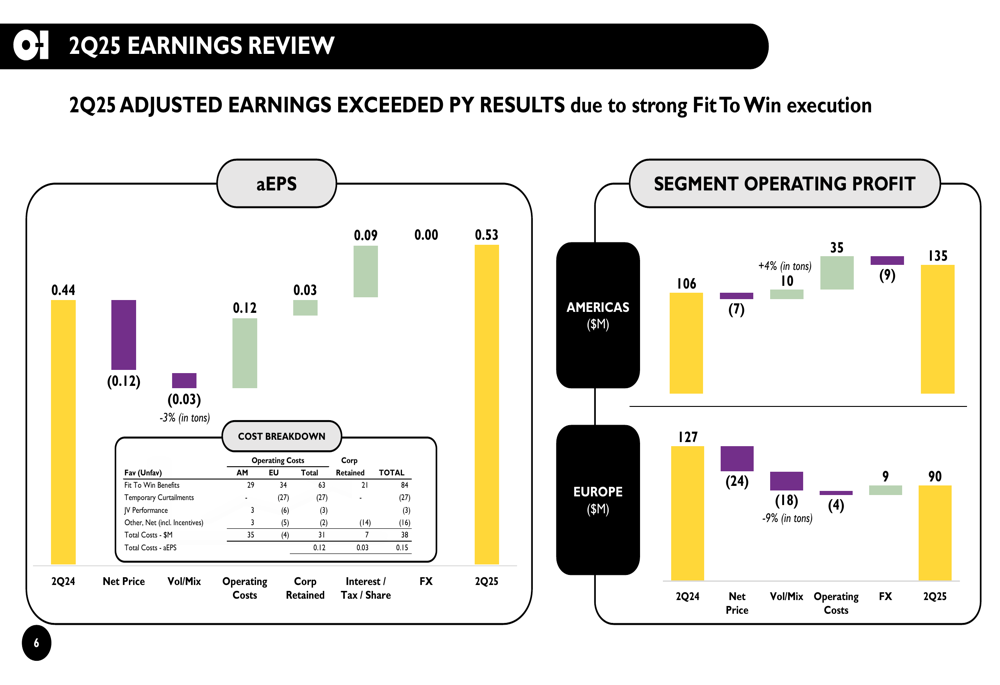
O-I Glass delivered adjusted earnings per share of $0.53 in Q2 2025, up from $0.44 in the same period last year, representing a 20% year-over-year increase. This performance came despite a 3% decline in sales volume during the quarter, demonstrating the company’s ability to enhance profitability through operational improvements.
Total net sales for the quarter reached $1.71 billion, slightly down from $1.73 billion in Q2 2024. Segment operating profit totaled $225 million compared to $233 million in the prior year, with divergent regional performance.
As shown in the following earnings breakdown chart, the company’s improved profitability was primarily driven by operating cost reductions and favorable interest, tax, and share count impacts, which more than offset volume and mix headwinds:
Fit to Win Program Progress
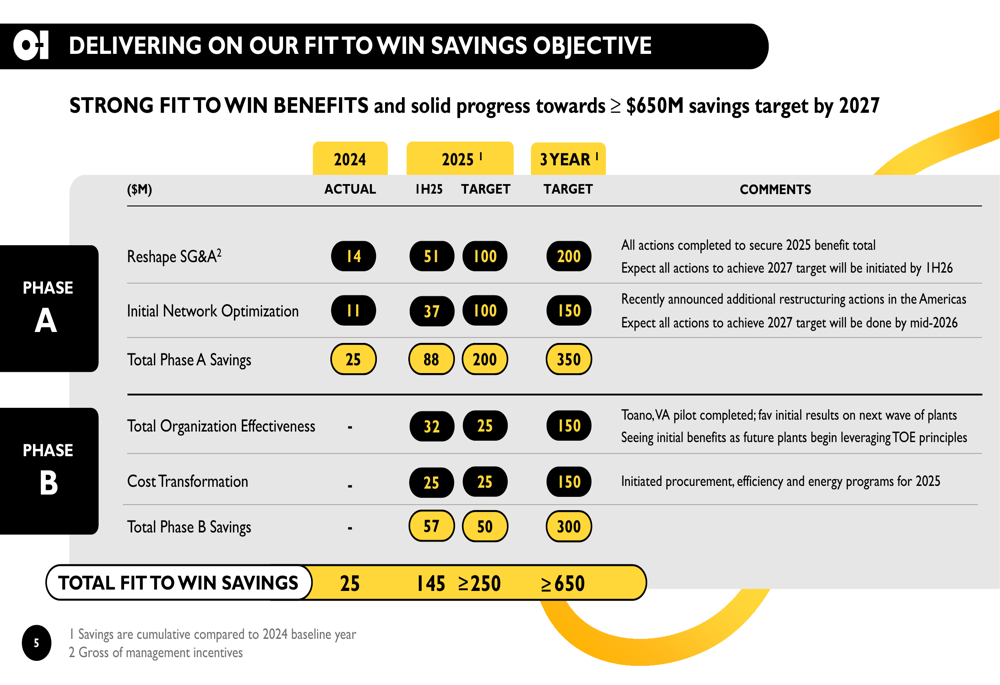
The company’s "Fit to Win" cost-saving initiative emerged as the key driver of improved profitability. O-I Glass reported $84 million in savings for Q2 2025 alone, bringing the first-half total to $145 million. The program is targeting at least $250 million in savings for full-year 2025 and at least $650 million by 2027.
The following chart details the company’s progress across various cost-saving initiatives, showing that O-I Glass is ahead of schedule on several fronts:
CEO Gordon Hardy emphasized the company’s commitment to eliminating inefficiencies, stating, "We are relentless on waste and inefficiency coming out of the business." This focus on operational excellence has led the company to halt its MAGMA technology development program, with management determining that the Fit to Win approach provides a lower-cost and less capital-intensive path to capacity expansion.
Regional Performance Analysis
O-I Glass faced contrasting regional market conditions in Q2 2025. The Americas segment showed strength with a 4% increase in sales volume and improved operating profit of $135 million, up from $106 million in Q2 2024. In contrast, the European segment experienced a 9% volume decline, with operating profit falling to $90 million from $127 million in the prior year.
The following chart illustrates the company’s overall demand trends, showing the recovery from the global packaging recession and the recent moderation in growth:
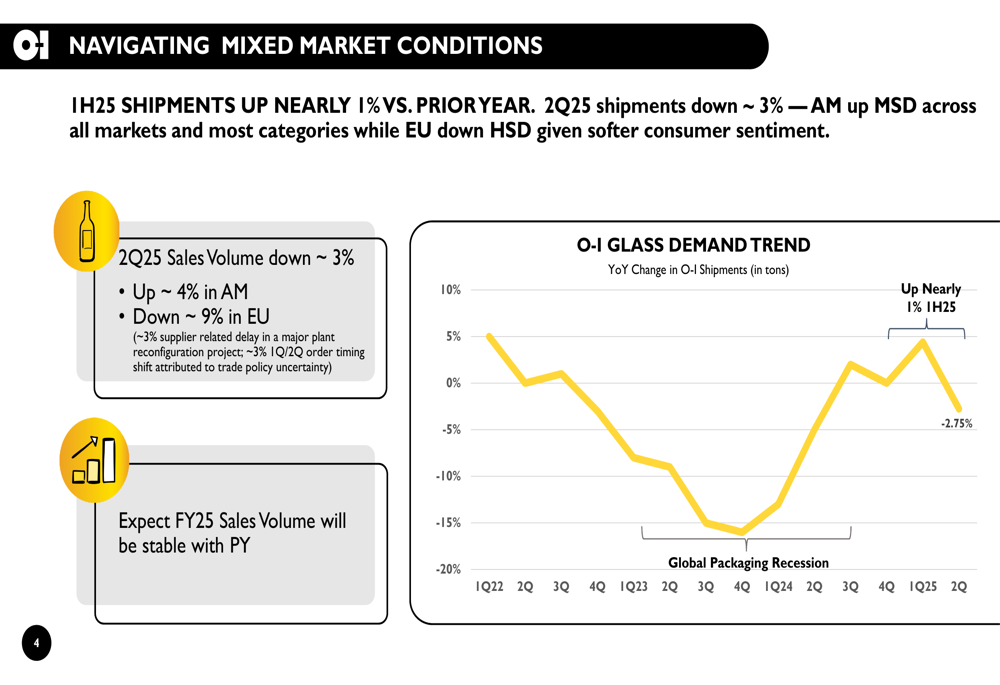
Management attributed the European weakness to softer consumer sentiment in the region. Additionally, about 3% of the global volume decline was related to supplier delays in a major plant reconfiguration project, while another 3% was attributed to order timing shifts due to trade policy uncertainty.
Updated Outlook and Guidance
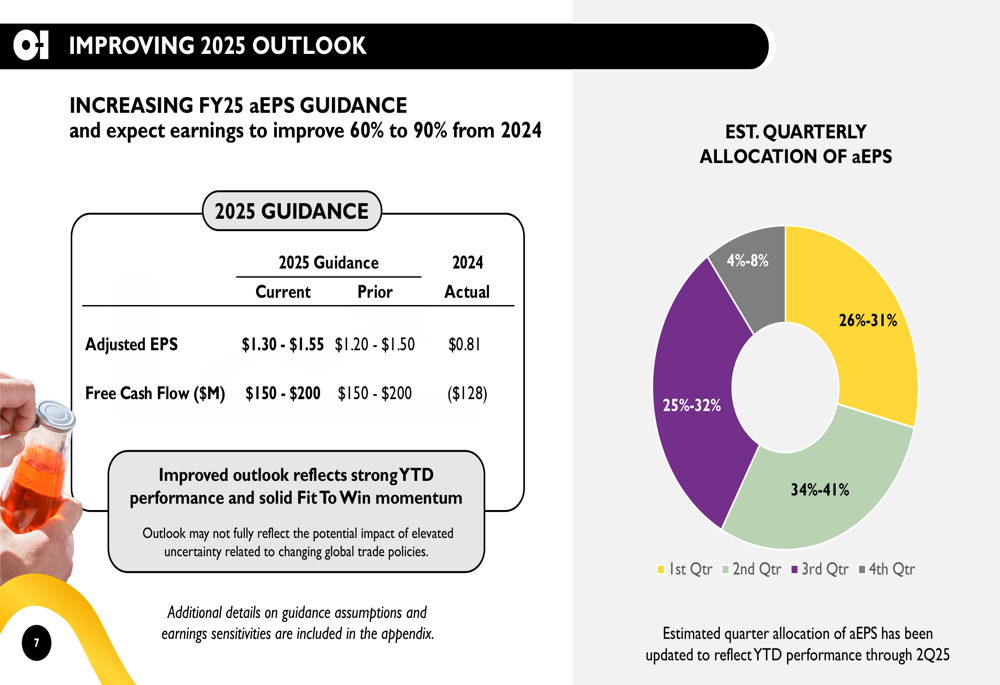
Based on strong year-to-date performance and confidence in its cost-saving initiatives, O-I Glass raised its full-year 2025 guidance. The company now expects adjusted earnings per share of $1.30 to $1.55, up from the previous range of $1.20 to $1.50. This represents a 60% to 90% improvement from 2024’s $0.81 per share.
Free cash flow guidance remained unchanged at $150 to $200 million, a substantial improvement from the negative $128 million reported in 2024.
The following chart shows the company’s updated guidance and expected quarterly earnings distribution:
The company expects stable full-year sales volume compared to the prior year, despite the Q2 decline. Management also noted that net price headwinds are moderating, now expected to be $100-125 million for the year.
Strategic Initiatives and Challenges
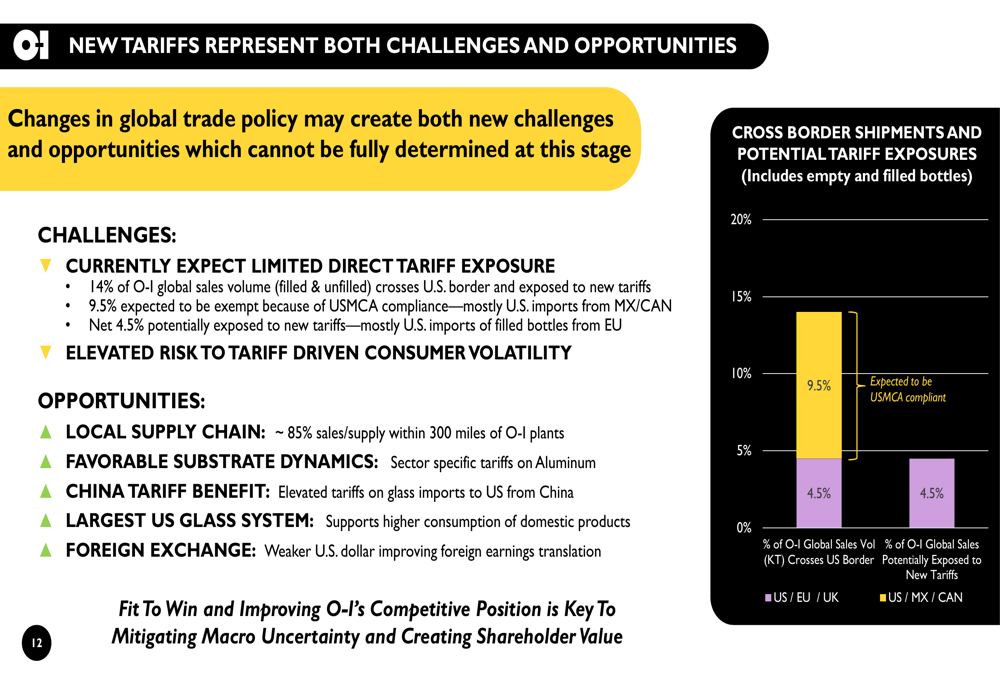
O-I Glass is navigating a complex global trade environment, with new tariffs presenting both challenges and opportunities. The company’s analysis shows limited direct exposure, with only 4.5% of its global sales volume potentially subject to new tariffs after accounting for USMCA exemptions.
The following chart details the company’s tariff exposure analysis:
Management highlighted several strategic advantages in this environment, including its position as a local supplier with the largest glass manufacturing system in the US. The company is also continuing to reshape its organizational structure and optimize its manufacturing network, recently announcing additional restructuring actions in the Americas.
Key challenges ahead include managing temporary production curtailments, which had a $27 million negative impact in Q2, and navigating continued softness in European markets. The company also faces sensitivity to volume fluctuations, with each 1% change in combined sales and production volume impacting earnings per share by approximately $0.20.
O-I Glass’s stock closed at $11.62 on the day of the presentation, up 1.62% in regular trading but dipping slightly by 0.61% in aftermarket trading. With analysts setting price targets between $13 and $20, the market appears to be taking a measured view of the company’s improved outlook and strategic repositioning.
Full presentation:
This article was generated with the support of AI and reviewed by an editor. For more information see our T&C.