Broadcom named strategic vendor for Walmart virtualization solutions

Introduction & Market Context
Pathward Financial Inc. (NASDAQ:CASH) presented its third-quarter fiscal 2025 investor update on July 28, 2025, revealing mixed financial results amid an active capital return program. The financial services company, trading at $80.20 with a price-to-earnings ratio of 10.74, demonstrated resilience in a challenging economic environment while maintaining its strategic focus on enabling partner success through its optimized platform.
The presentation follows a strong second quarter where Pathward significantly exceeded analyst expectations with EPS of $3.11 and revenue of $262.9 million. While Q3 results show some moderation compared to Q2’s exceptional performance, the company continues to leverage its diversified business model to navigate market uncertainties.
Quarterly Performance Highlights
Pathward’s Q3 2025 financial results showed mixed performance across key metrics. Net interest income remained essentially flat year-over-year at $122.3 million compared to $122.8 million in Q3 2024. However, noninterest income saw robust growth of 11%, increasing from $65.9 million to $73.4 million. This growth was partially offset by an 11% rise in noninterest expenses, which climbed from $125.5 million to $139.3 million.
As shown in the following chart detailing quarterly financial performance:
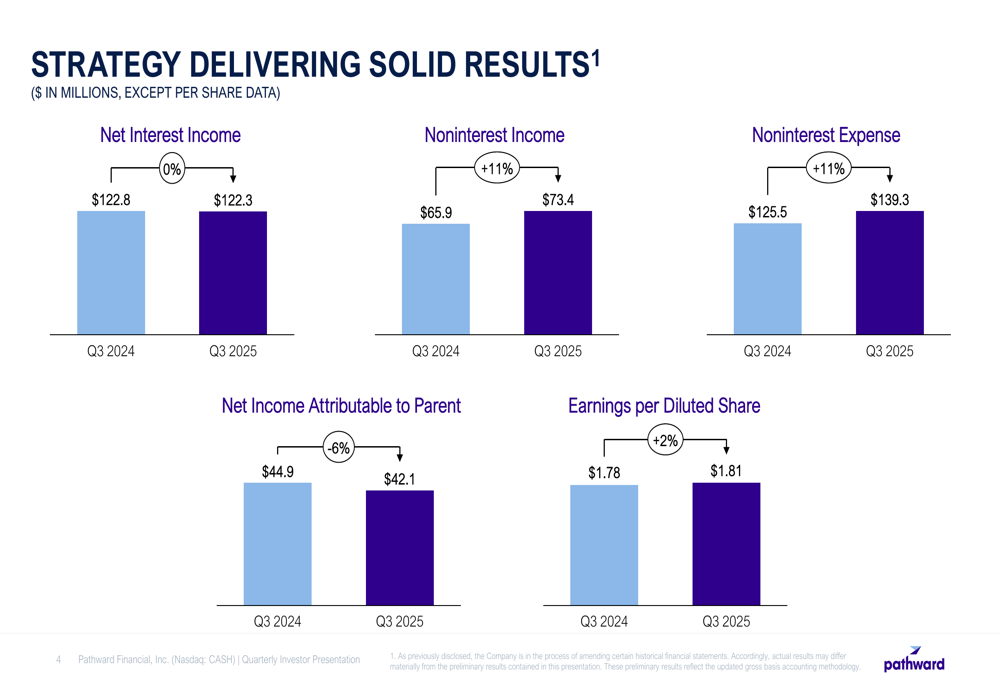
Net income attributable to the parent company decreased by 6% to $42.1 million, down from $44.9 million in the same period last year. Despite this decline, earnings per diluted share increased by 2% to $1.81, compared to $1.78 in Q3 2024, reflecting the positive impact of the company’s ongoing share repurchase program.
This performance represents a moderation from the company’s second-quarter results, where Pathward reported a 21% year-over-year growth in EPS and significant revenue outperformance against analyst forecasts.
Balance Sheet Analysis
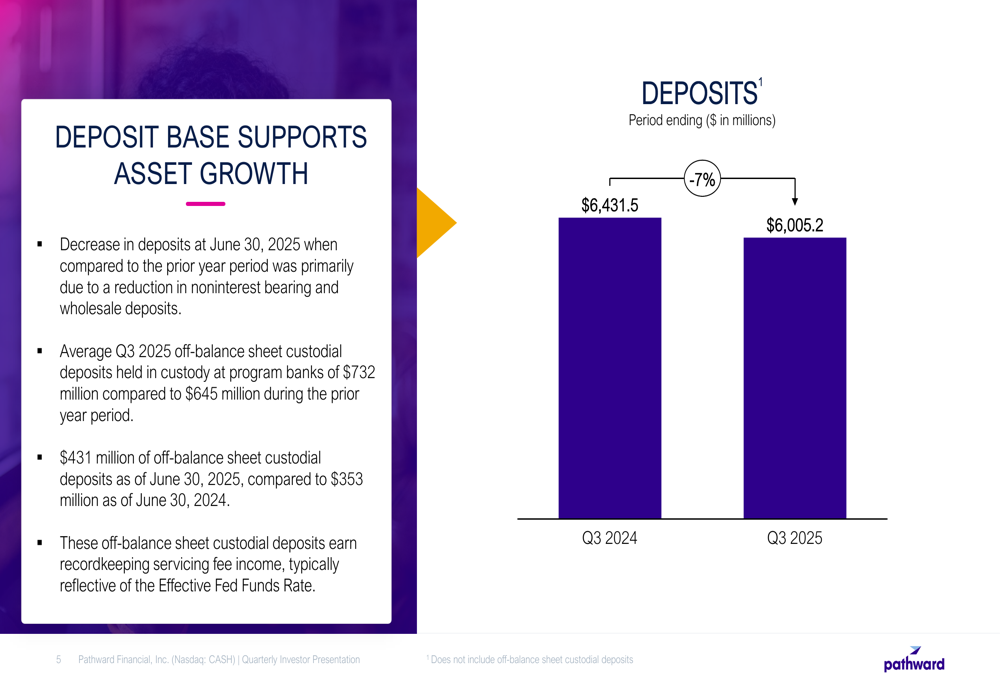
Pathward’s balance sheet showed some notable shifts in the third quarter. Total (EPA:TTEF) deposits decreased by 7% year-over-year to $6,005.2 million, down from $6,431.5 million in Q3 2024. This reduction was primarily attributed to decreases in noninterest bearing and wholesale deposits.
The deposit trends are illustrated in the following chart:
Meanwhile, the company’s loan portfolio expanded modestly, with total loans and leases increasing by 3% to $4,743.3 million, up from $4,615.6 million in Q3 2024. This growth was primarily driven by term lending, warehouse finance, and asset-based lending, partially offset by the sale of insurance premium finance loans during Q1 2025.
As shown in the following loan portfolio chart:
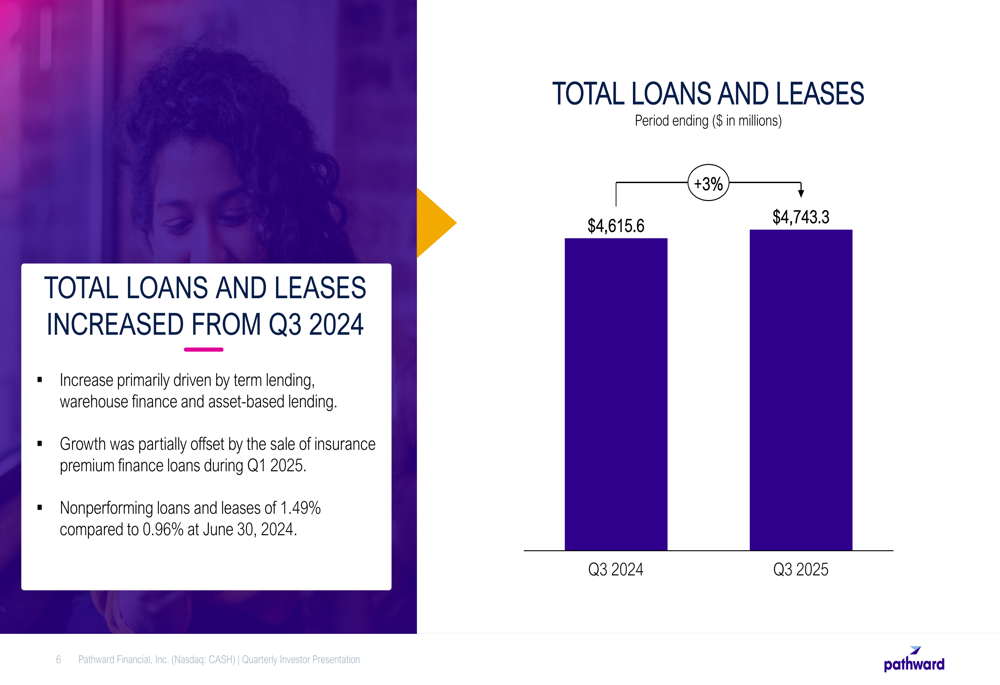
A potential area of concern is the increase in nonperforming loans and leases, which rose to 1.49% compared to 0.96% at June 30, 2024. This uptick appears to contradict CFO Greg Sigrist’s statement during the Q2 earnings call that the company was "not seeing signs of economic slowdown in our portfolio," suggesting some deterioration in credit quality during the third quarter.
Capital Return Strategy & Liquidity Position
Pathward continues to prioritize returning capital to shareholders, supported by a strong balance sheet and robust liquidity position. The company maintains diversified liquidity sources totaling $2,652 million, including off-balance sheet custodial deposits, cash and cash equivalents, unpledged investment securities, and various funding options.
The company’s liquidity sources and share repurchase activity are illustrated in the following chart:
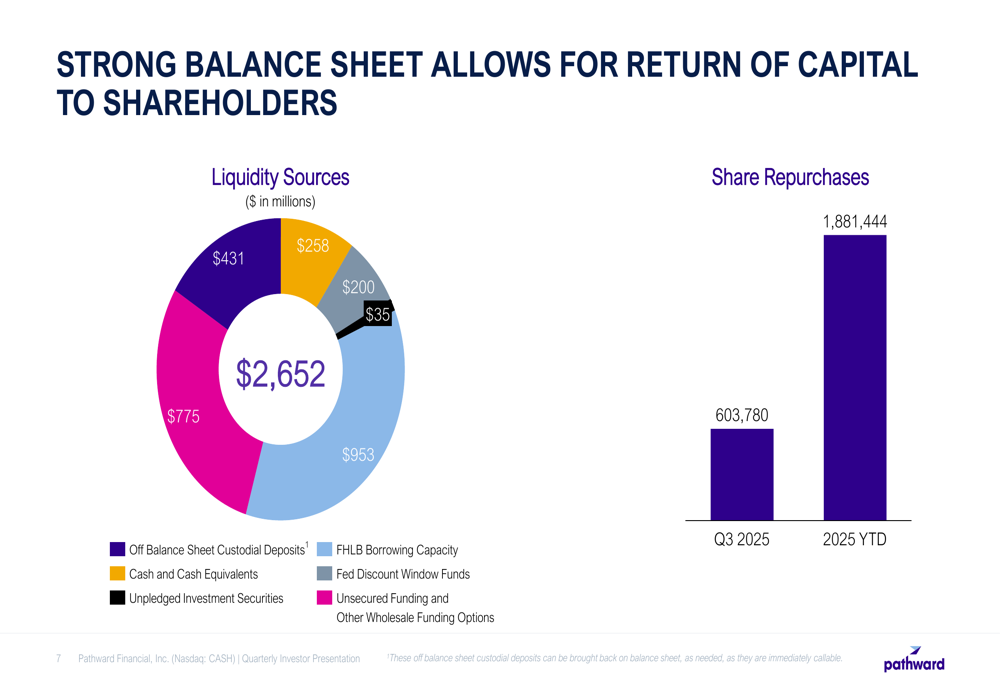
Share repurchases remained a key component of Pathward’s capital return strategy, with 603,780 shares repurchased in Q3 2025 and a total of 1,881,444 shares repurchased year-to-date for fiscal 2025. This aggressive buyback program aligns with management’s previously stated goal of maintaining an 80-90% capital return through share repurchases, building on the company’s impressive 32-year track record of consistent dividend payments.
Forward Guidance
Pathward provided preliminary guidance for both fiscal years 2025 and 2026, demonstrating management’s confidence in the company’s growth trajectory despite the mixed Q3 results. For fiscal year 2025, the company projects earnings per share between $7.50 and $7.80, assuming one rate cut in fiscal Q4 2025 and an effective tax rate of 16% to 20%. This guidance represents a slight upward revision from the $7.40-$7.80 range mentioned during the Q2 earnings call.
Looking further ahead, Pathward forecasts fiscal year 2026 earnings per share between $8.25 and $8.75, assuming no rate cuts during the year and an effective tax rate of 18% to 22%. Both projections include the expected impact of continued share repurchases.
The company’s key strategic platform elements that underpin these projections are highlighted in the following slide:
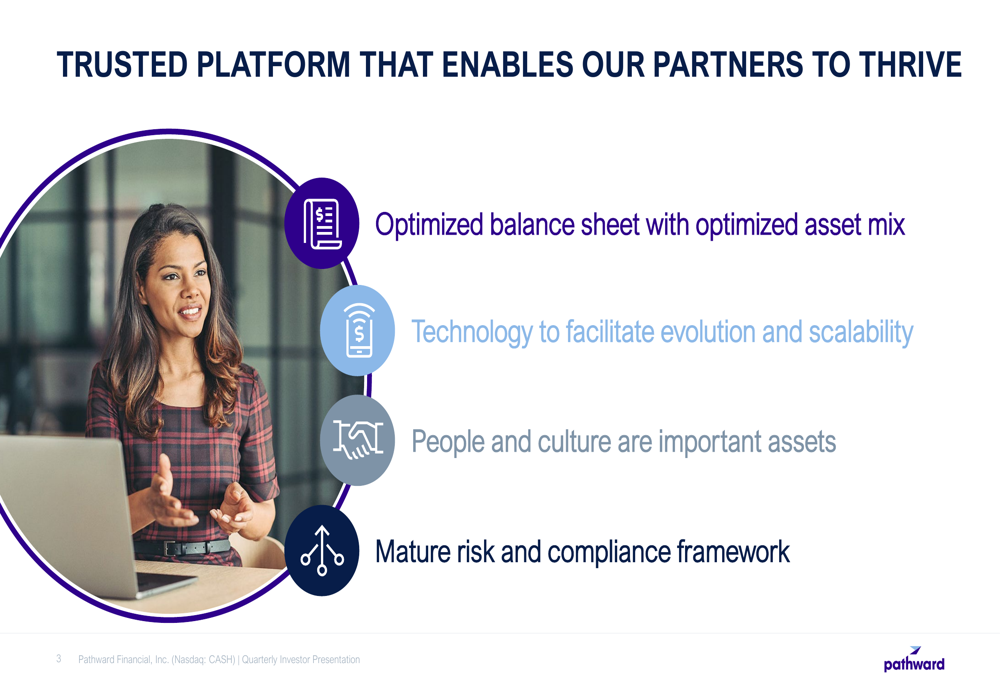
Pathward’s optimized balance sheet, technology infrastructure, emphasis on people and culture, and mature risk and compliance framework position the company to navigate economic uncertainties while pursuing sustainable growth. However, the increase in nonperforming loans bears watching as a potential indicator of broader economic pressures that could impact future performance.
As Pathward transitions into the final quarter of fiscal 2025, investors will be closely monitoring whether the company can meet its revised guidance and maintain its capital return program while addressing the slight deterioration in loan quality observed in Q3.
Full presentation:
This article was generated with the support of AI and reviewed by an editor. For more information see our T&C.