German construction sector still in recession, civil engineering only bright spot

Introduction & Market Context
Tata Consultancy Services (NSE:TCS) presented its first quarter fiscal year 2025 financial results on July 11, 2024, revealing a company successfully navigating shifting market dynamics through geographic and sector diversification. The IT services giant demonstrated resilience with improved profitability metrics despite headwinds in key markets like North America and the banking sector.
The results come amid a challenging global economic environment where technology spending patterns are evolving, with enterprises becoming more selective about their investments while continuing digital transformation initiatives. TCS’s performance reflects its ability to capitalize on growth opportunities in emerging markets while maintaining operational discipline.
Quarterly Performance Highlights
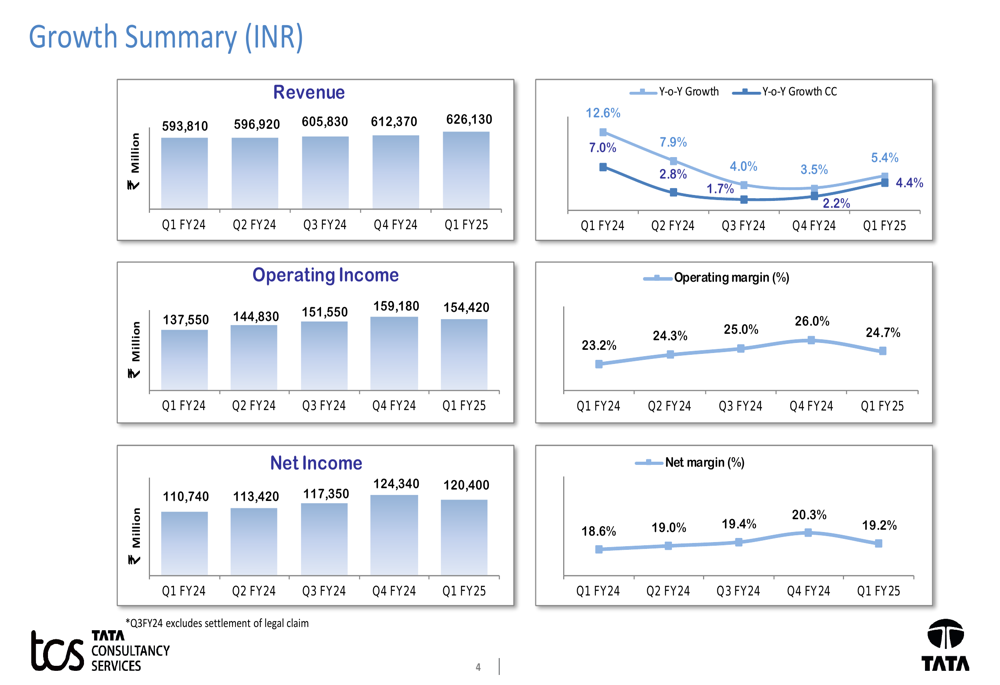
TCS reported solid financial results for Q1 FY25, with revenue reaching ₹626,130 million (approximately $7.5 billion), representing a year-over-year growth of 5.4% in INR terms and 3.9% in USD terms. On a constant currency basis, revenue grew by 4.4% compared to the same quarter last year.
Profitability showed notable improvement, with operating margin expanding to 24.7% from 23.2% in Q1 FY24. Net margin also improved to 19.2% from 18.6% in the year-ago period. The company maintained strong cash generation with cash flow from operations at 92.8% of net profit.
As shown in the following chart of quarterly revenue and margin trends:
The company secured new deals with a total contract value (TCV) of $8.3 billion during the quarter. North America contributed $4.6 billion to this order book, while the BFSI (Banking, Financial Services and Insurance) sector accounted for $2.7 billion and Consumer Business for $1.1 billion.
Geographic and Sector Performance
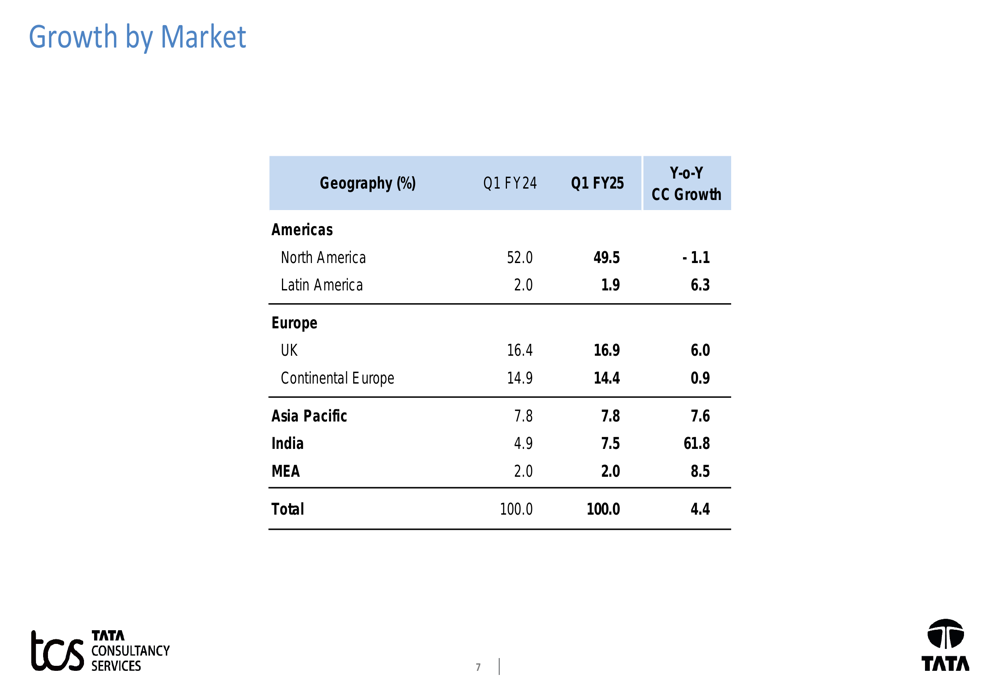
TCS’s geographic diversification strategy appears to be paying dividends, with strong growth in several markets offsetting weakness in North America. While North America, which accounts for 49.5% of revenue, experienced a 1.1% year-over-year decline in constant currency terms, the India market demonstrated exceptional growth of 61.8%, increasing its contribution from 4.9% to 7.5% of total revenue.
The UK market also performed well with 6.0% growth, while Asia Pacific and Middle East & Africa grew by 7.6% and 8.5% respectively. This regional performance breakdown is illustrated in the following chart:
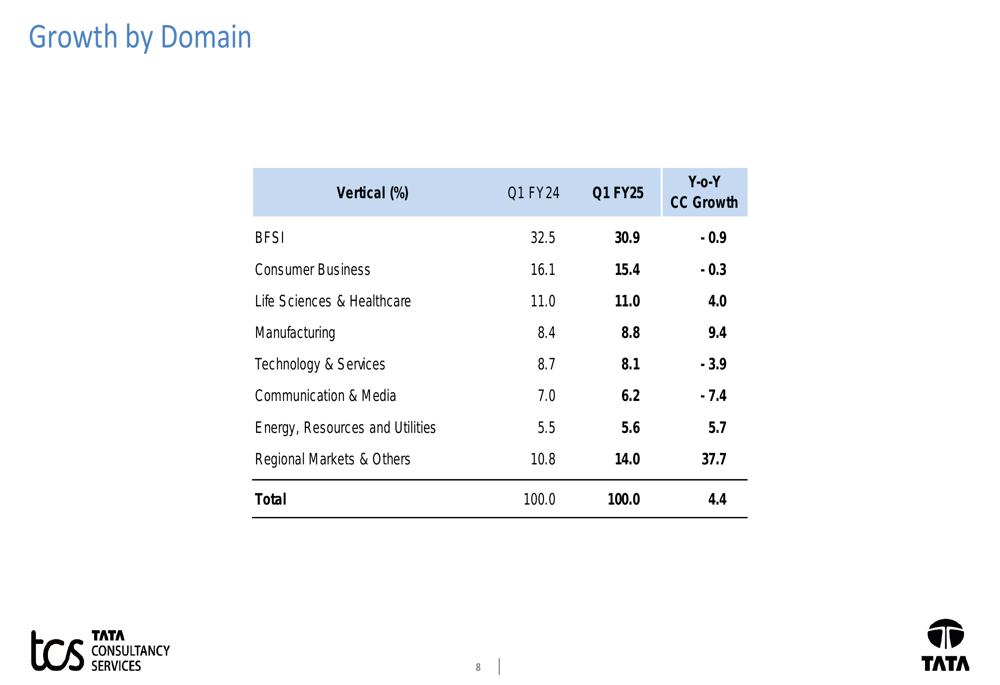
From an industry perspective, Manufacturing showed strong growth of 9.4% year-over-year, increasing its contribution to 8.8% of total revenue. The Energy, Resources and Utilities vertical grew by 5.7%, while Life Sciences & Healthcare expanded by 4.0%. However, BFSI, the company’s largest vertical, declined by 0.9% and reduced its contribution from 32.5% to 30.9% of total revenue.
The most significant growth came from Regional Markets & Others, which surged 37.7% year-over-year and now represents 14.0% of total revenue, up from 10.8% in Q1 FY24. The following chart details the performance across industry verticals:
Client and Employee Metrics
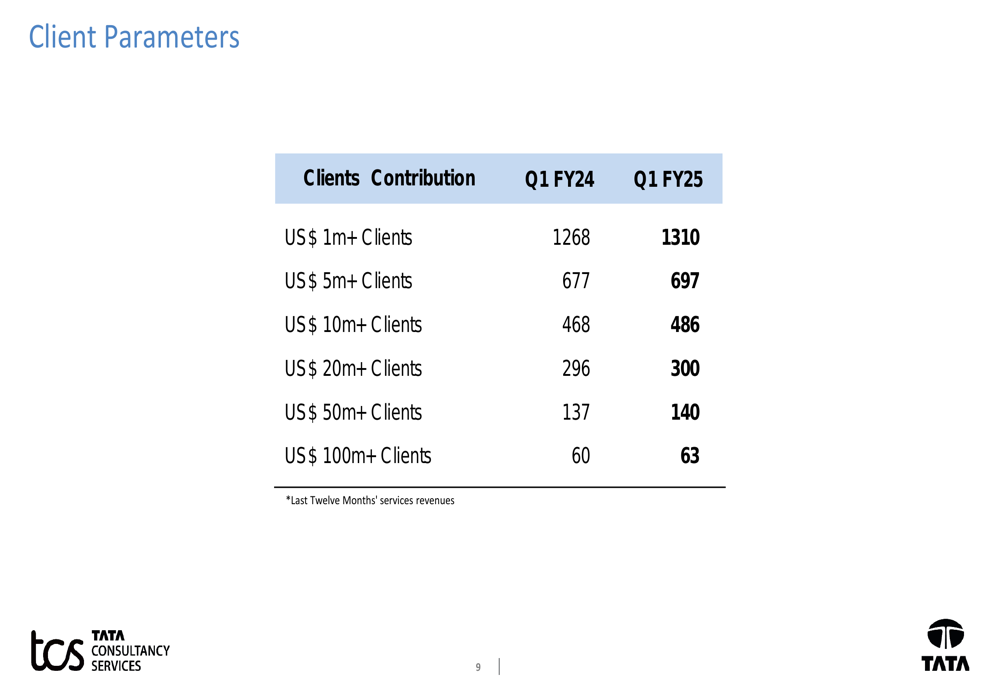
TCS continued to deepen relationships with existing clients while adding new ones across revenue tiers. The number of clients contributing more than $100 million in annual revenue increased by 3 to 63, while clients in the $50+ million category also grew by 3 to 140. The company added 18 clients in the $10+ million bracket and 42 in the $1+ million tier compared to the year-ago period.
The following chart illustrates this client progression across revenue bands:
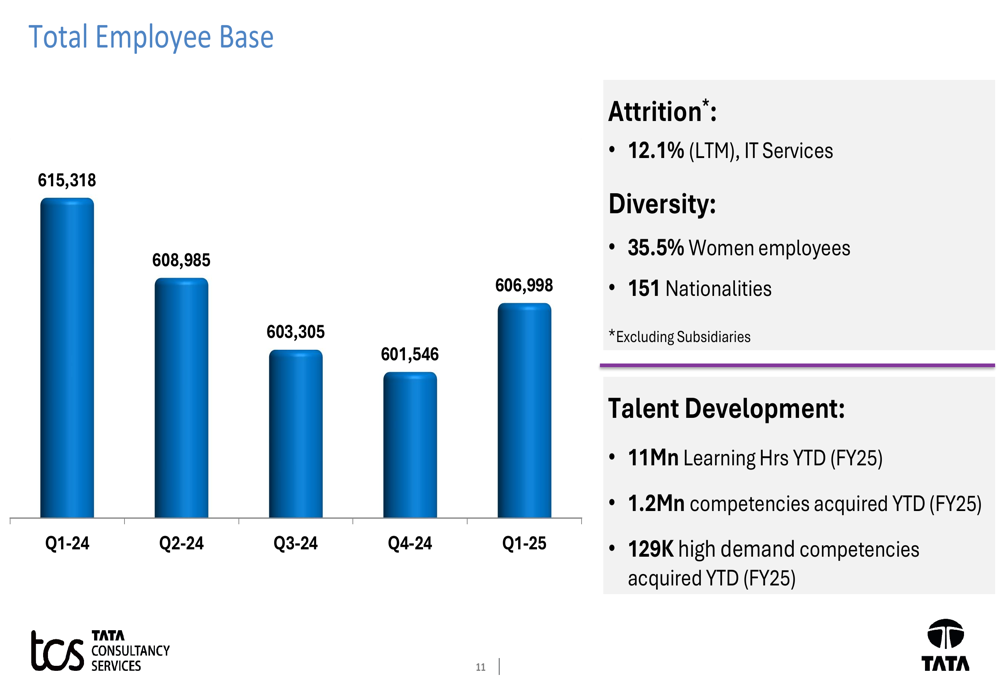
On the workforce front, TCS reported a total employee base of 606,998 at the end of Q1 FY25, representing an increase from the previous quarter’s 601,546 but a decrease from 615,318 in Q1 FY24. The company maintained healthy attrition levels with LTM (Last Twelve Months) attrition in IT services at 12.1%.
The company continues to invest in talent development, with 11 million learning hours completed year-to-date in FY25 and 1.2 million competencies acquired. Women constitute 35.5% of the total workforce, reflecting the company’s commitment to diversity. The following chart shows the workforce trends over the past five quarters:
Financial Analysis
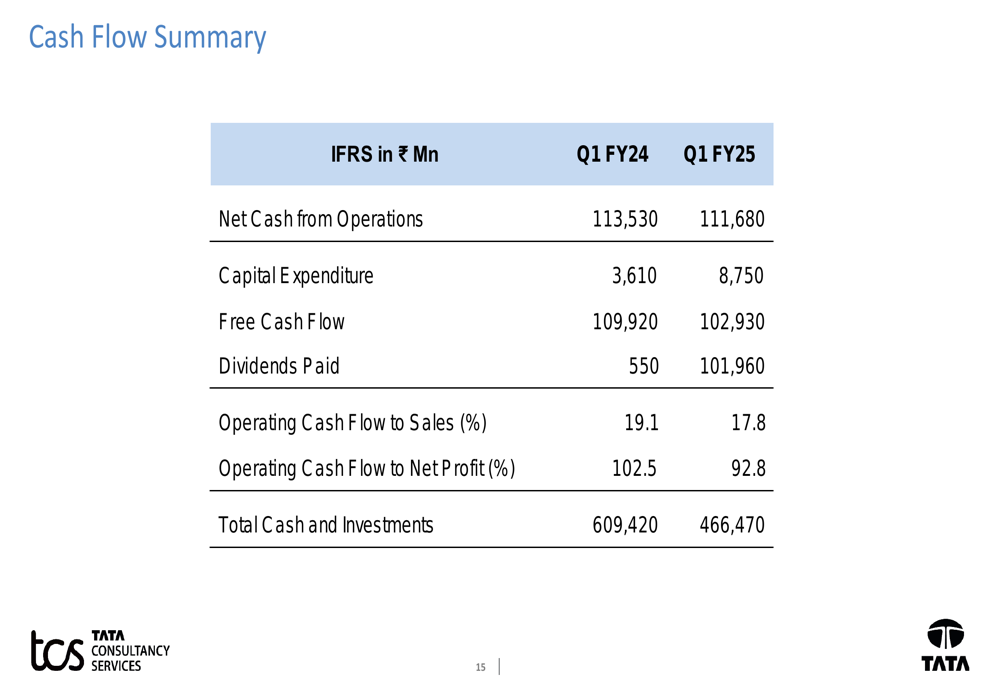
TCS maintained a strong balance sheet with total assets of ₹1,518,710 million as of June 30, 2024. The company’s cash flow from operations decreased slightly from ₹113,530 million in Q1 FY24 to ₹111,680 million in Q1 FY25. Free cash flow declined from ₹109,920 million to ₹102,930 million, primarily due to increased capital expenditure, which rose from ₹3,610 million to ₹8,750 million.
The company significantly increased its dividend payout, with dividends paid rising from ₹550 million in Q1 FY24 to ₹101,960 million in Q1 FY25. Total cash and investments stood at ₹466,470 million, down from ₹609,420 million in the year-ago period, largely due to the increased dividend payout.
The cash flow metrics are illustrated in the following summary:
From a currency perspective, the USD contribution to revenue decreased from 54.42% in Q1 FY24 to 51.50% in Q1 FY25, reflecting the company’s increasing revenue diversification across currencies and geographies.
Forward-Looking Statements
While the presentation did not include explicit forward guidance, the strong order book of $8.3 billion suggests a positive outlook for future quarters. The company’s strategic focus on geographic and sector diversification positions it well to navigate potential challenges in specific markets or industries.
The continued investment in talent development, particularly in high-demand competencies, indicates TCS’s commitment to staying at the forefront of technological advancements. The company’s ability to improve margins while investing in future capabilities demonstrates operational discipline and efficient resource allocation.
As enterprises worldwide continue their digital transformation journeys, TCS’s broad service portfolio and global delivery capabilities should enable it to capitalize on emerging opportunities, particularly in growth markets like India and in sectors such as Manufacturing and Life Sciences & Healthcare that are showing robust demand.
Full presentation:
This article was generated with the support of AI and reviewed by an editor. For more information see our T&C.