Bubble or no bubble, this is the best stock for AI exposure: analyst

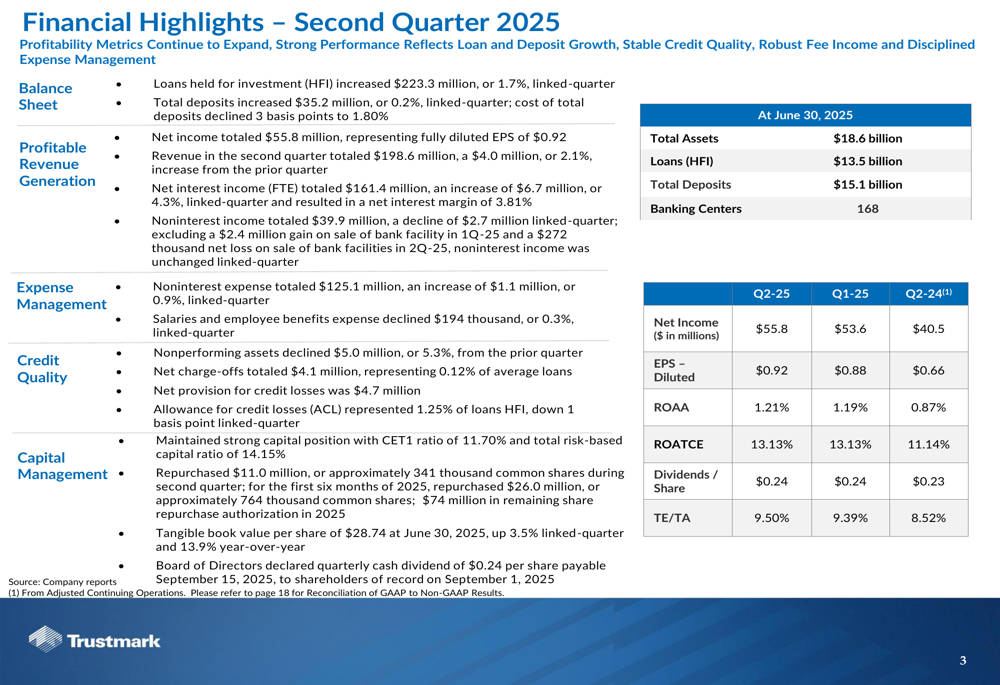
Trustmark Corporation (NASDAQ:TRMK) released its second quarter 2025 financial results presentation on July 22, 2025, showcasing improved profitability metrics, accelerated loan growth, and strong credit quality. The financial services company, which operates across six southeastern states, reported net income of $55.8 million and earnings per share of $0.92, continuing its positive momentum in key performance areas.
Quarterly Performance Highlights
Trustmark's second quarter results demonstrated solid performance across multiple financial metrics. The company reported revenue of $198.6 million, representing a 2.1% increase from the previous quarter. Net income reached $55.8 million, translating to earnings per share of $0.92, up from $0.88 in the first quarter of 2025 and significantly higher than the $0.66 reported in the same quarter last year.
Return on average assets (ROAA) improved to 1.21%, while return on average tangible common equity (ROATCE) held steady at 13.13%, both showing substantial improvement compared to the year-ago period.
As shown in the following comprehensive overview of Trustmark's second quarter performance:
Loan Portfolio and Growth Trends
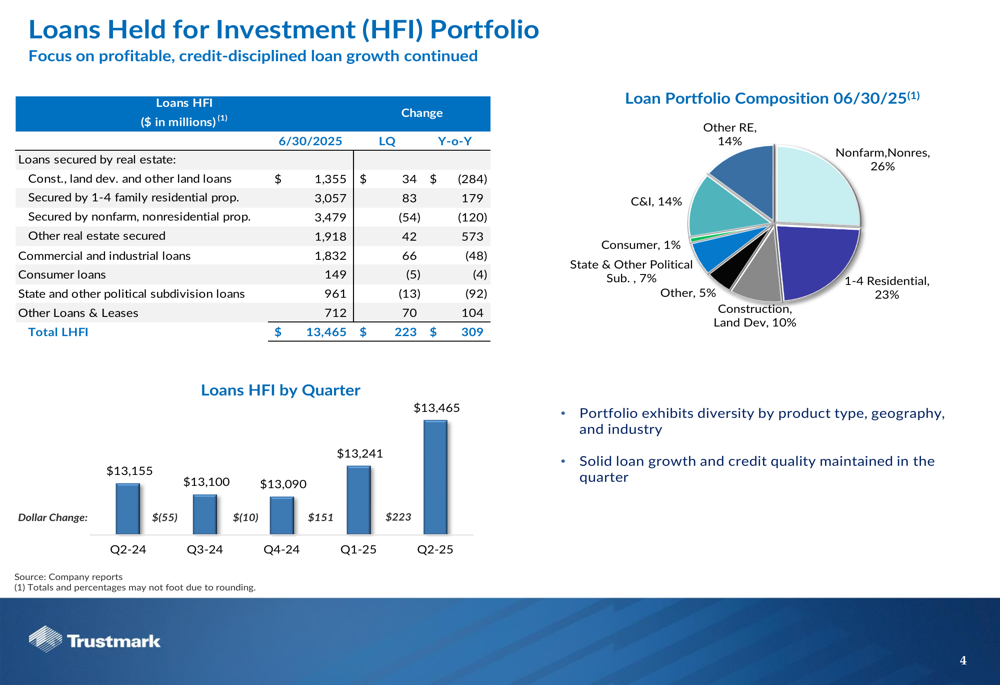
Trustmark reported total loans held for investment of $13.5 billion as of June 30, 2025, reflecting an increase of $223.3 million or 1.7% from the previous quarter. This growth represents an acceleration from recent quarters and demonstrates the company's successful execution of its lending strategy.
The loan portfolio remains well-diversified across various categories, with nonfarm, nonresidential properties representing the largest segment at 26%, followed by 1-4 residential properties at 23%. The company's loan growth was primarily driven by increases in 1-4 family residential properties ($83 million), commercial and industrial loans ($66 million), and other loans and leases ($70 million).
The following chart illustrates the composition and quarterly trend of Trustmark's loan portfolio:
The company's commercial real estate (CRE) portfolio, totaling $5.3 billion, is well-diversified across property types. Notably, office exposure is limited to just 1.7% of total loans held for investment, with zero delinquencies or non-performing loans in this segment, positioning Trustmark favorably compared to peers with higher office exposure.
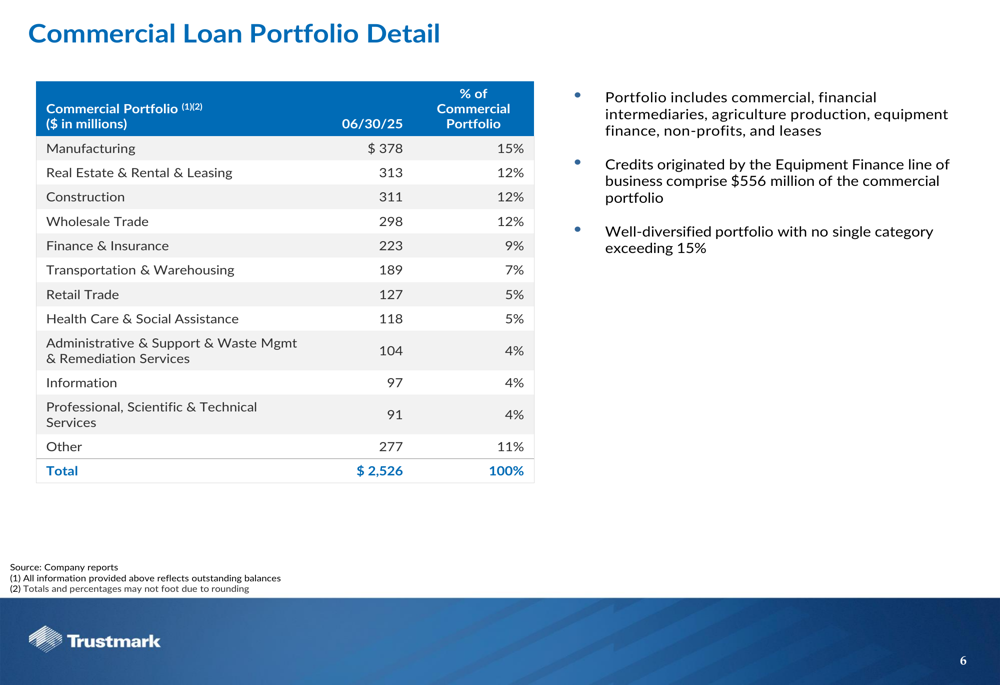
The commercial loan portfolio also demonstrates strong diversification across industries, with no single category exceeding 15% of the total:
Credit Quality and Risk Management
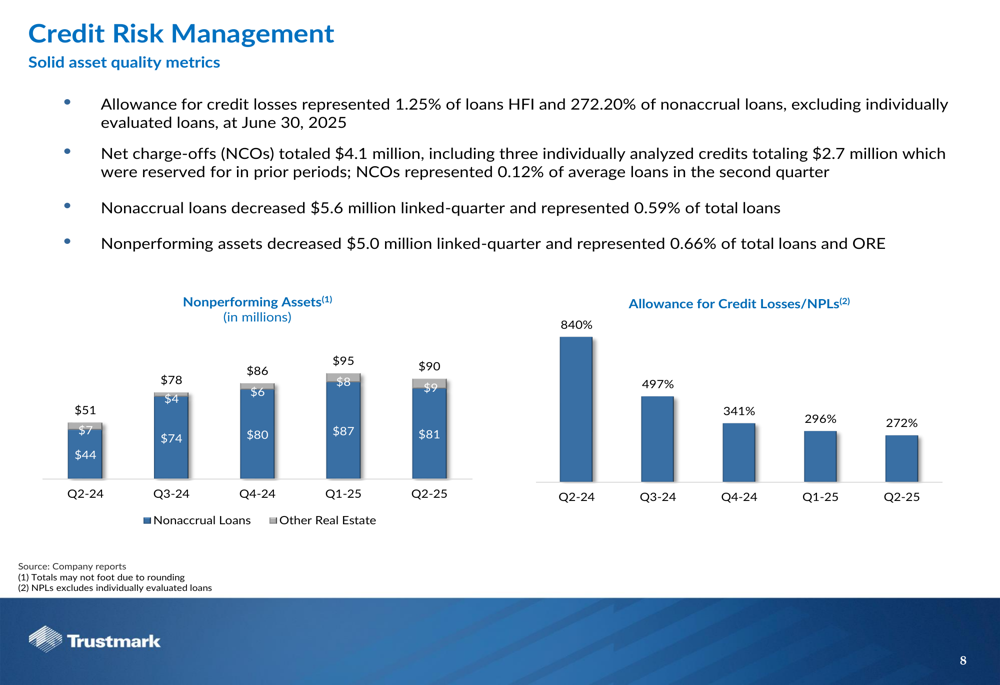
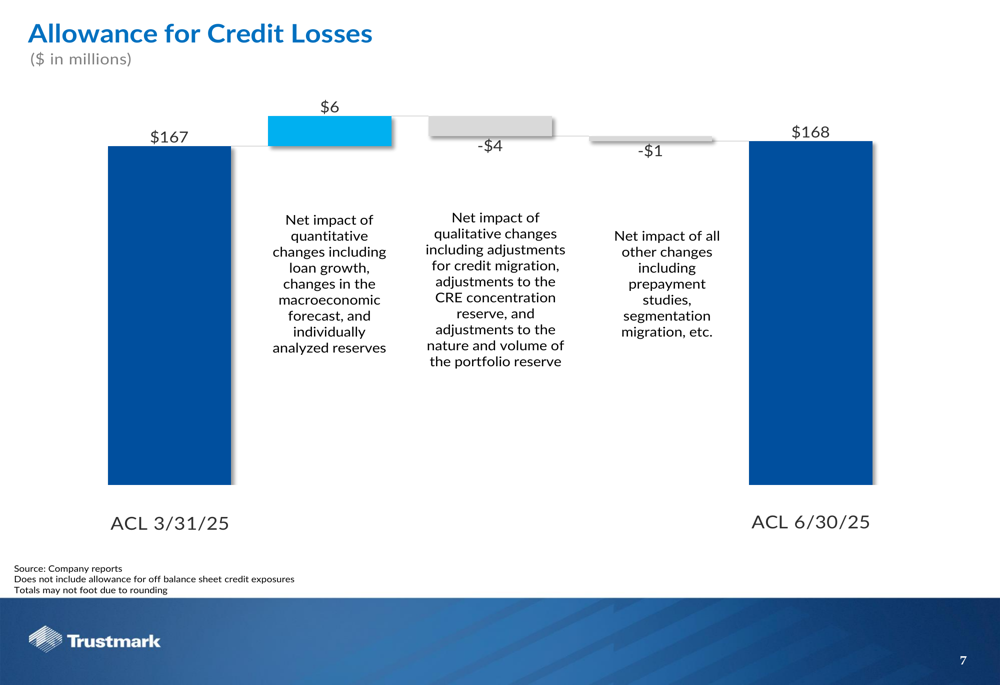
Trustmark maintained strong credit quality metrics during the quarter, with nonperforming assets decreasing by $5.0 million or 5.3% from the previous quarter. Nonaccrual loans represented just 0.59% of total loans, while the allowance for credit losses stood at $168 million, representing 1.25% of loans held for investment and 272.2% of nonaccrual loans.
Net charge-offs totaled $4.1 million for the quarter, representing 0.12% of average loans, which included three individually analyzed credits totaling $2.7 million that had been reserved for in prior periods.
The following chart details the trends in nonperforming assets and allowance coverage:
The allowance for credit losses remained relatively stable quarter-over-quarter, with a slight increase from $167 million to $168 million. This stability reflects the offsetting impacts of quantitative factors, qualitative adjustments, and other changes:
Net Interest Income and Margin
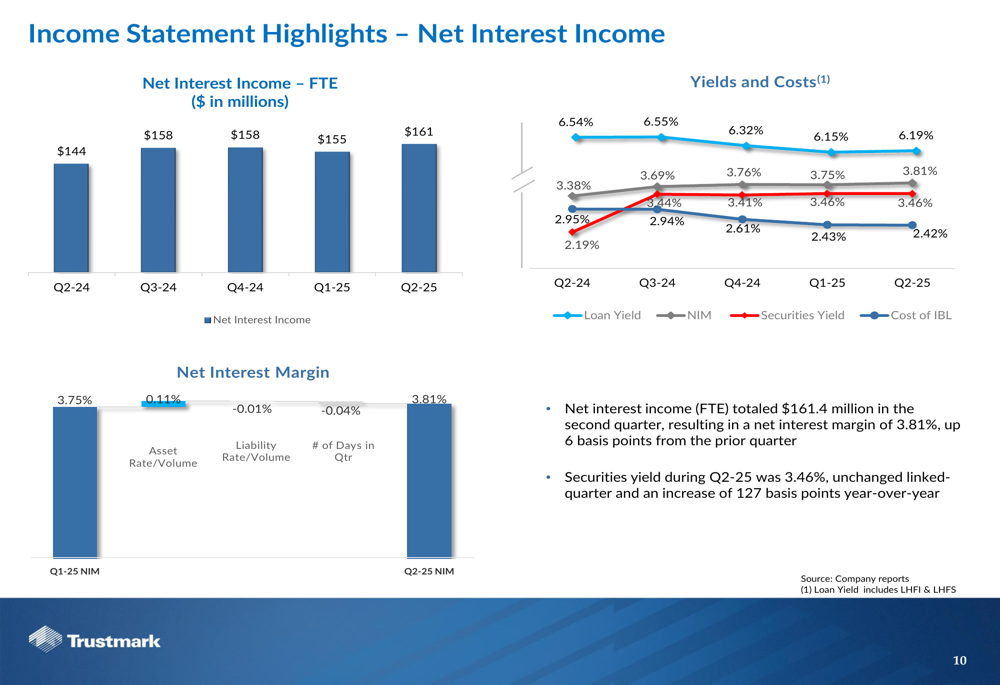
Trustmark's net interest income on a fully tax-equivalent basis reached $161.4 million in the second quarter, an increase from $155 million in the previous quarter. The net interest margin expanded to 3.81%, up 6 basis points from the prior quarter and significantly higher than the 2.9% reported in the second quarter of 2024.
The improvement in net interest margin was supported by higher loan yields and the company's asset-sensitive balance sheet positioning. The following chart illustrates the positive trend in net interest income and margin:
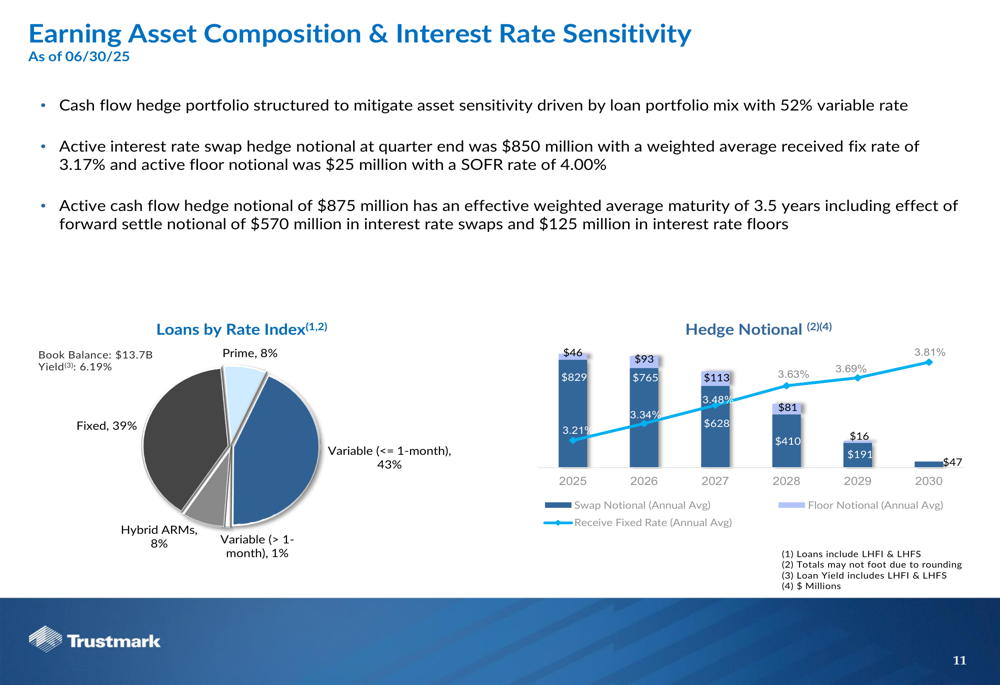
The company's earning asset composition shows a well-balanced mix of fixed and variable rate loans, with 52% in variable rate categories. This positioning, along with strategic interest rate hedges, helps Trustmark manage interest rate risk effectively:
Deposit Base and Funding
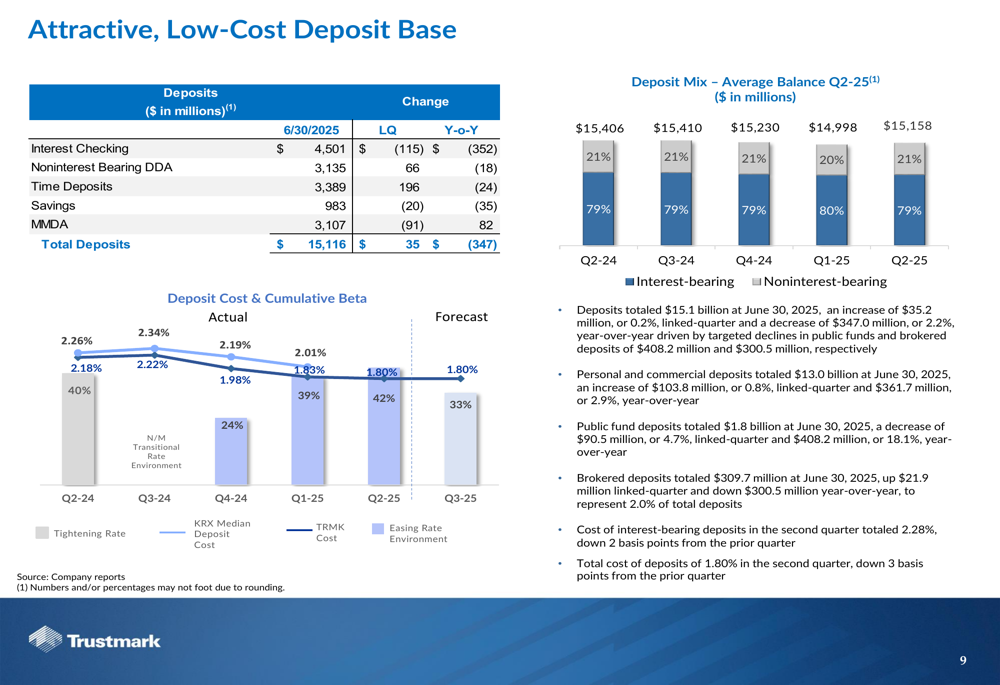
Trustmark maintained a stable and low-cost deposit base, with total deposits of $15.1 billion as of June 30, 2025, representing a slight increase of 0.2% from the previous quarter. Personal and commercial deposits, which exclude brokered deposits, increased by 0.8% quarter-over-quarter to $13.0 billion.
The deposit mix remains favorable, with noninterest-bearing deposits accounting for 21% of the total. The company's deposit costs have been well-managed throughout the interest rate cycle, as illustrated in the following chart:
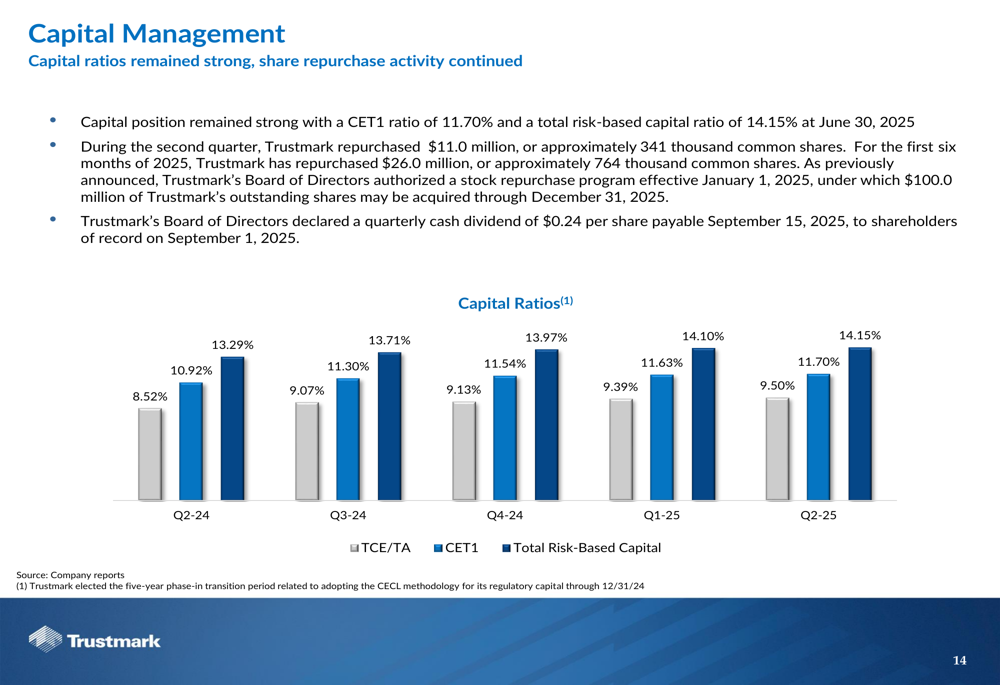
Capital Management and Shareholder Returns
Trustmark maintained a strong capital position, with a Common Equity Tier 1 (CET1) ratio of 11.70% and a total risk-based capital ratio of 14.15% as of June 30, 2025. During the quarter, the company repurchased approximately 341,000 common shares for a total of $11.0 million, demonstrating its commitment to returning capital to shareholders.
The Board of Directors declared a quarterly cash dividend of $0.24 per share, payable on September 15, 2025, continuing Trustmark's impressive streak of consecutive dividend payments.
The following chart illustrates the company's robust capital ratios:
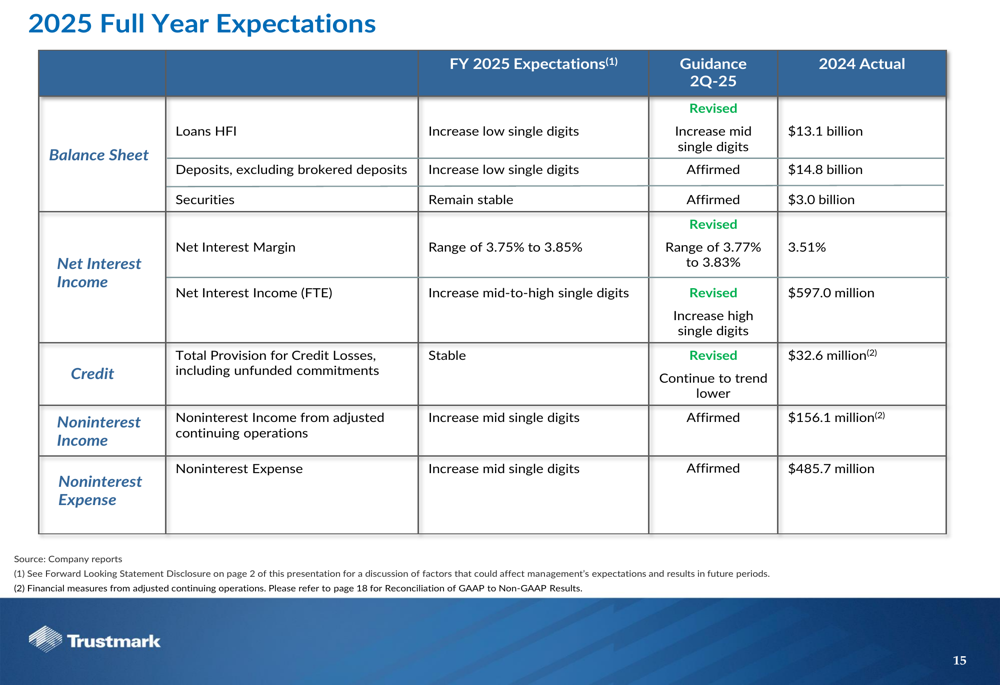
Forward Guidance
Looking ahead, Trustmark provided an optimistic outlook for the remainder of 2025. The company expects loans held for investment to increase in the mid-single digits for the full year, an upgrade from previous guidance. Net interest margin is projected to range between 3.77% and 3.83%, while net interest income is expected to increase by mid-to-high single digits.
The company also anticipates low single-digit deposit growth, stable securities balances, and mid-single-digit increases in both noninterest income and noninterest expense.
The following table summarizes Trustmark's full-year 2025 expectations:
Trustmark's stock closed at $38.33 on the most recent trading day, up 1.83%, reflecting investor confidence in the company's performance and outlook. With its strong financial results, improved profitability metrics, and solid balance sheet, Trustmark appears well-positioned to continue its positive momentum through the remainder of 2025.
Full presentation:
This article was generated with the support of AI and reviewed by an editor. For more information see our T&C.