Acadia Healthcare shares fall as guidance midpoint falls below estimates

Introduction & Market Context
United Community Banks , Inc. (NASDAQ:NYSE:UCB) released its second quarter 2025 earnings presentation on July 23, highlighting solid financial performance with improved profitability metrics and successful integration of the recently acquired ANB Holdings. Despite the positive results, UCB shares dropped 6.49% in premarket trading to $29.24, suggesting the market had higher expectations or concerns about forward guidance.
The bank reported total assets of $28.1 billion, with $24.0 billion in deposits and $18.9 billion in loans, maintaining its position as a significant regional player in the Southeast banking market with 200 banking offices across the region.
Quarterly Performance Highlights
UCB reported diluted earnings per share (GAAP) of $0.63 for Q2 2025, representing a 17% year-over-year improvement. Operating EPS came in at $0.66, up 14% from the same period last year. The bank’s return on assets (GAAP) improved to 1.11%, a 14 basis point increase year-over-year, while operating ROA reached 1.16%.
As shown in the following chart of quarterly performance metrics, the bank demonstrated consistent improvement across key financial indicators:
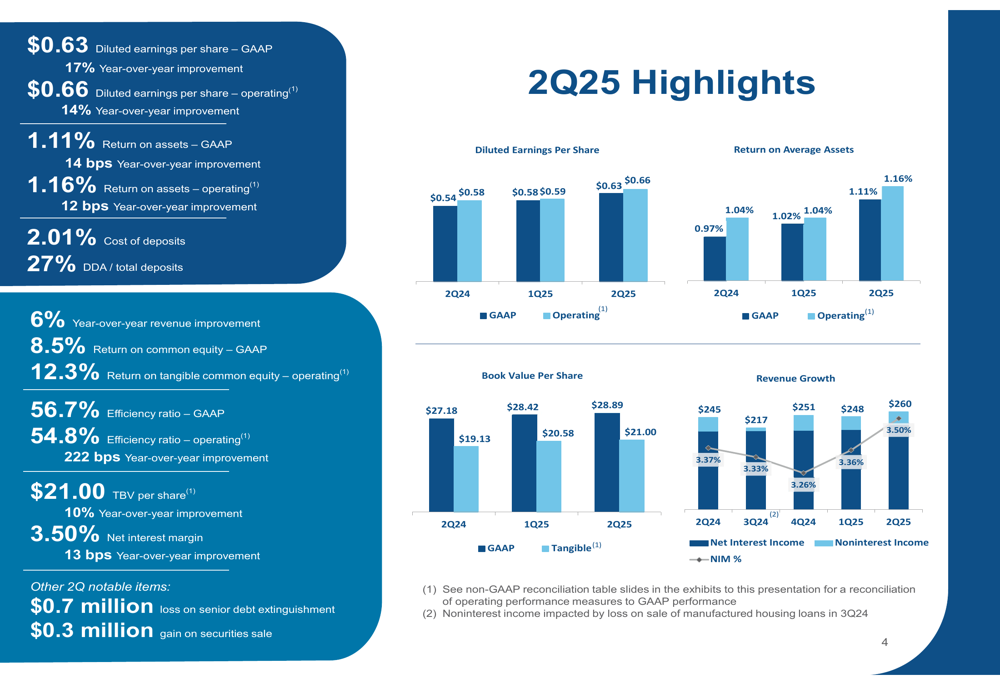
Revenue grew 6% year-over-year, with the efficiency ratio (operating) improving significantly to 54.8%, representing a 222 basis point improvement from Q2 2024. The net interest margin expanded to 3.50%, a 13 basis point improvement year-over-year and 14 basis points quarter-over-quarter, primarily due to improvements in funding costs and earning asset mix changes.
This performance builds on the momentum from Q1 2025, when the bank reported EPS of $0.59 against a forecast of $0.56, and continues to demonstrate UCB’s ability to navigate the current interest rate environment effectively.
Deposit Franchise and Funding
UCB maintained a strong deposit franchise in Q2, with customer deposits growing $64 million or 1.3% annualized from Q1 2025 (excluding public funds and ANB). The cost of deposits decreased 4 basis points quarter-over-quarter to 2.01%, driven by active management, product mix, and the benefit of CD repricing. The bank’s cumulative total deposit beta through Q2 2025 was 34%.
The following chart illustrates the bank’s deposit trends and cost management:
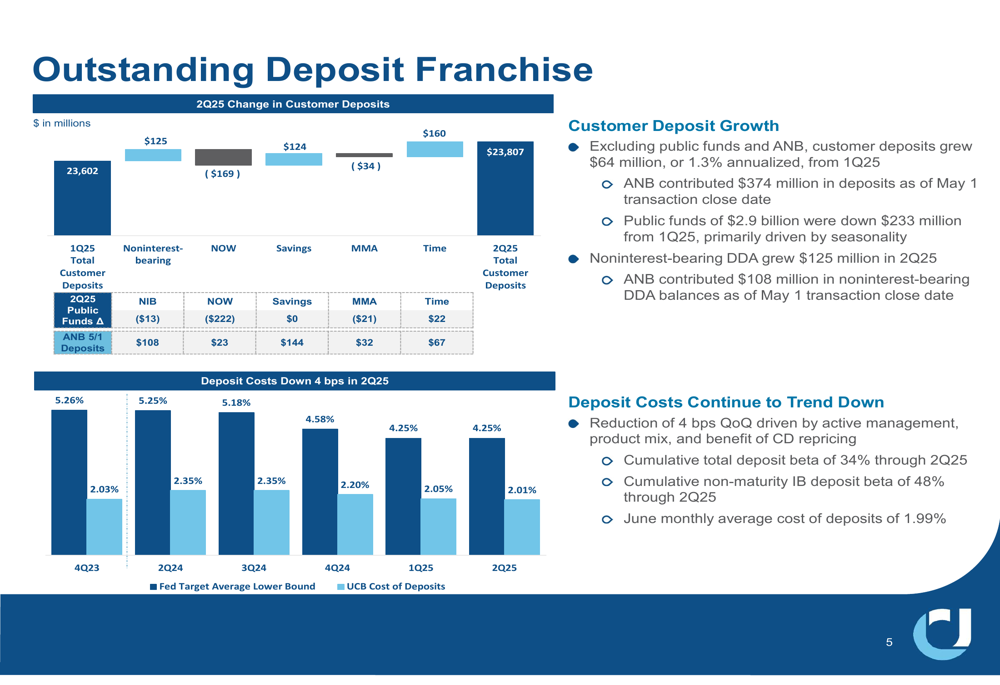
Noninterest-bearing demand deposits grew $125 million in Q2, with ANB contributing $108 million in noninterest-bearing DDA balances. The DDA to total deposits ratio stood at 27%, providing a solid base of low-cost funding.
ANB Holdings Acquisition Impact
The acquisition of ANB Holdings, which closed on May 1, 2025, contributed significantly to UCB’s growth in Q2. ANB added $374 million in deposits and $301 million in loans to UCB’s balance sheet. This acquisition aligns with UCB’s strategy of expanding its footprint in high-growth Southeast markets.
The integration appears to be proceeding as planned, with ANB contributing $2.2 million to net interest revenue in Q2 and $279,000 to purchased loan accretion. The bank also recorded a non-PCD double-dip provision of $2.5 million related to the acquisition.
Loan Growth and Credit Quality
Excluding the ANB acquisition, UCB’s loan portfolio grew at an annualized rate of 4.2% in Q2. The loan portfolio remains well-diversified, with Commercial & Industrial loans representing the largest segment at 42% of total loans, followed by Commercial Real Estate at 24% and Residential Mortgage at 17%.
The bank’s credit quality metrics showed significant improvement during the quarter. Nonperforming assets decreased by $9.3 million to 0.44% of total loans, down 6 basis points from Q1 2025. This improvement was driven by the resolution of the largest Senior Care non-accrual credit and successful exit of several C&I loans. Past due loans improved by $12.9 million to 0.14% of total loans.
The following chart illustrates the positive trends in credit quality metrics:
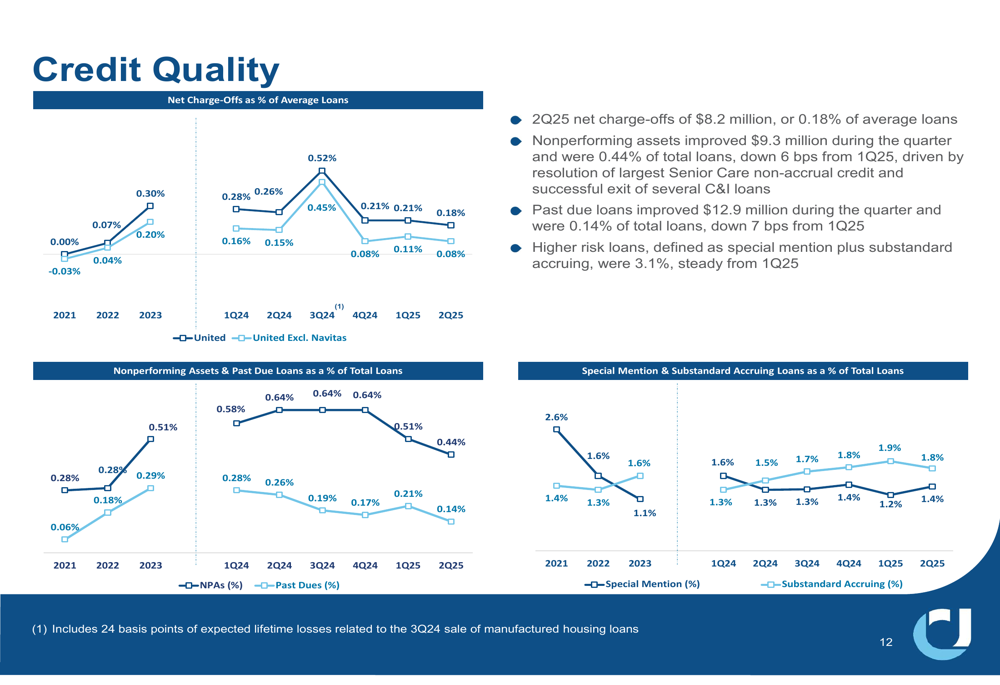
Net charge-offs for the quarter totaled $8.2 million or 0.18% of average loans, an improvement from the previous quarter. The provision for credit losses was $11.8 million, down from $15.4 million in Q1 2025, primarily driven by lower charge-offs. The allowance for credit losses remained stable at 1.21% of loans.
Capital and Liquidity Position
UCB maintained strong capital ratios in Q2 2025, with a Common Equity Tier 1 (CET1) ratio of 13.3% and a tangible common equity to tangible assets ratio of 9.45%, which increased 27 basis points from Q1. The bank’s tangible book value per share grew to $21.00, representing a 10% year-over-year improvement.
As shown in the following capital metrics chart, UCB’s capital position remains robust:
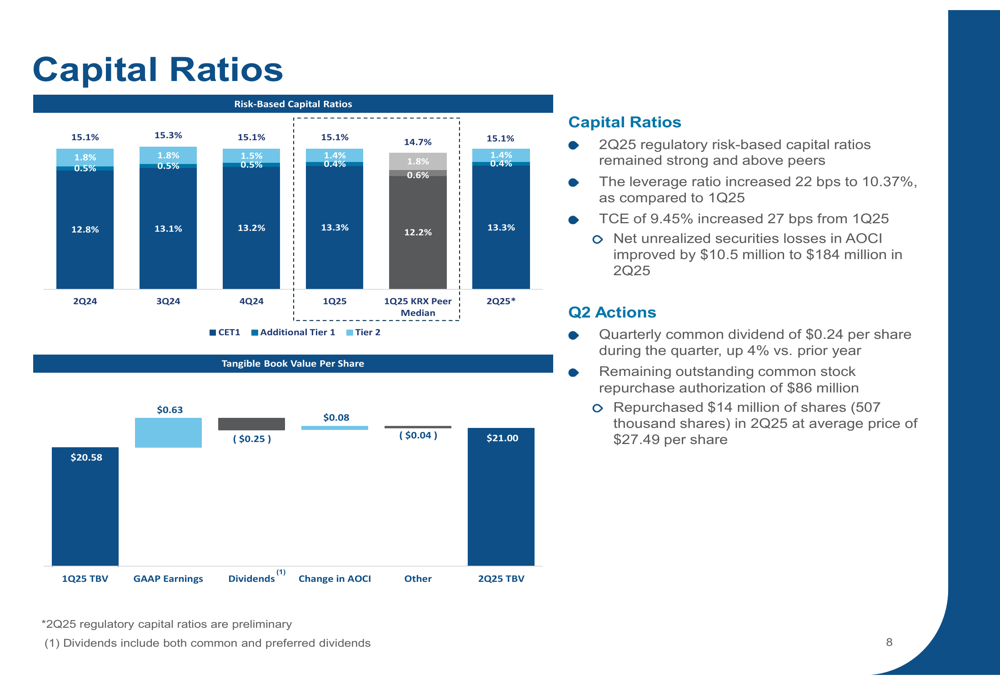
During the quarter, UCB returned capital to shareholders through a quarterly common dividend of $0.24 per share (up 4% year-over-year) and repurchased 507,000 shares at an average price of $27.49 per share, totaling $14 million. The bank still has $86 million remaining in its share repurchase authorization.
UCB also strengthened its balance sheet by redeeming $100 million of senior debt in June, incurring a $0.7 million loss on extinguishment. The bank reported no outstanding wholesale borrowings at the end of Q2 2025, and only 0.7% of total deposits were brokered, compared to 2.7% for the KRX peer median.
Net Interest Income and Margin
Net interest revenue increased $13.5 million from Q1 2025, with ANB contributing $2.2 million. The net interest margin expanded 14 basis points to 3.50%, primarily due to improvement in funding costs and earning asset mix changes.
The following chart illustrates the positive trends in net interest revenue and margin:
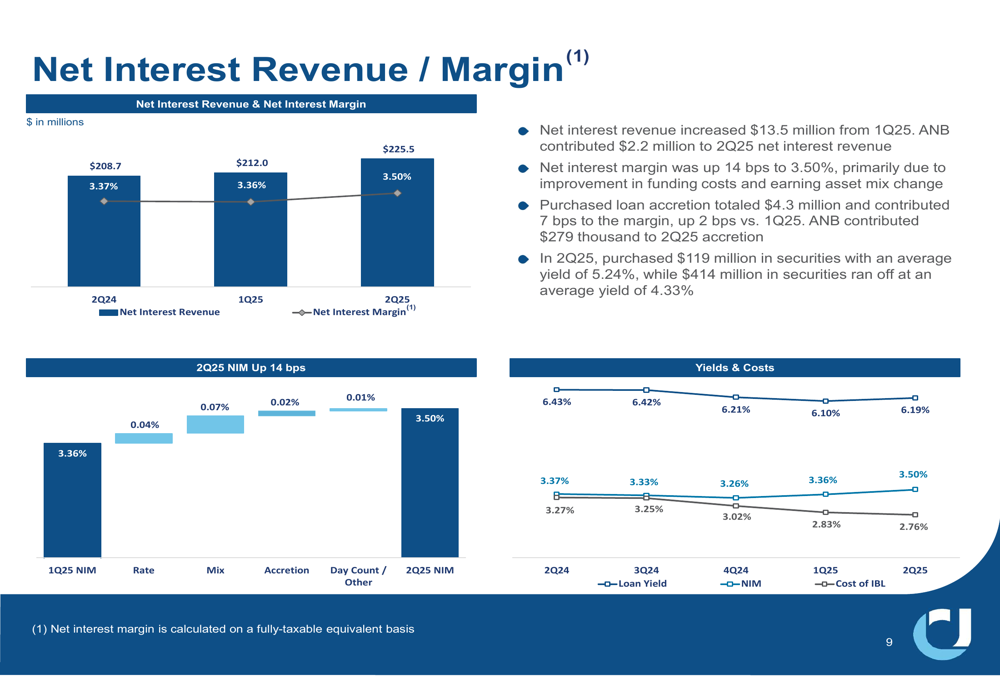
Purchased loan accretion totaled $4.3 million and contributed 7 basis points to the margin, up 2 basis points versus Q1 2025. The bank also continued to optimize its securities portfolio, purchasing $119 million in securities with an average yield of 5.24%, while $414 million in securities ran off at an average yield of 4.33%.
Strategic Focus and Outlook
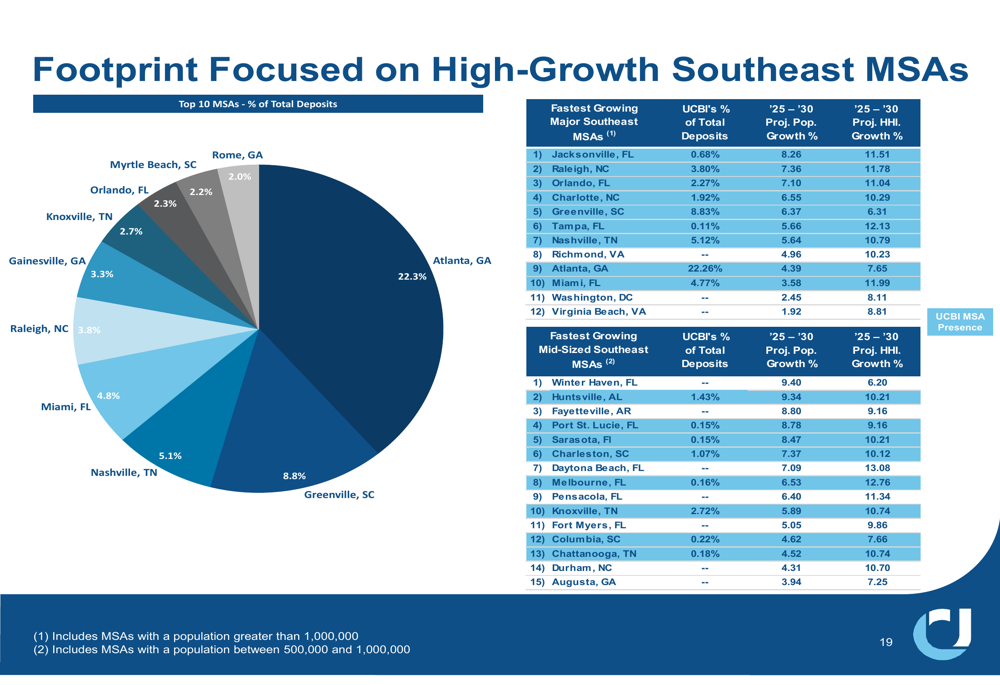
UCB continues to focus on high-growth markets in the Southeast, with a significant presence in metropolitan areas experiencing strong population and household income growth. Atlanta represents the bank’s largest market with 22.3% of total deposits, followed by Greenville, SC and Nashville, TN.
The bank’s strategic footprint is illustrated in the following geographic breakdown:
UCB’s specialized business lines, including Navitas (equipment financing) and SBA (LON:SBA) lending, continue to contribute to the bank’s diversified revenue streams. Navitas represents 9% of total loans with an allowance coverage of 2.59%, reflecting the higher risk profile of this business segment.
While the presentation did not provide specific forward guidance, the bank’s focus on operational efficiency, credit quality improvement, and strategic growth in high-potential markets suggests a continued positive trajectory. However, the market reaction indicates potential concerns about future performance or economic headwinds that may impact the banking sector.
The significant drop in premarket trading contrasts with the generally positive results presented and may reflect broader market concerns about regional banks or specific aspects of UCB’s performance that fell short of analyst expectations.
Full presentation:
This article was generated with the support of AI and reviewed by an editor. For more information see our T&C.