Interactive Brokers shares jump as it secures spot in S&P 500

Introduction & Market Context
Velocity Financial (NYSE:VEL) released its first quarter 2025 earnings presentation on May 1, highlighting record loan production amid continued growth in its real estate lending business. The company’s stock closed at $17.87 on the day of the announcement, showing no change from the previous close, according to available market data.
The presentation revealed Velocity’s continued momentum in the small balance commercial and investor property lending space, building on the strong performance reported in Q4 2024. While the company maintained robust loan origination growth, it faced some margin pressure compared to the previous quarter.
Quarterly Performance Highlights
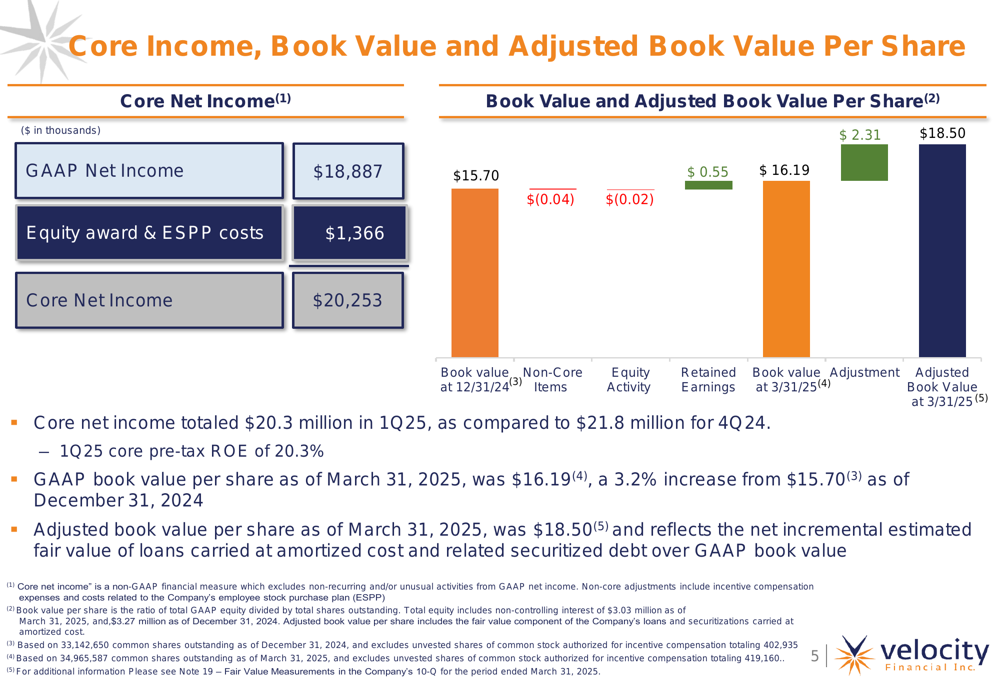
Velocity Financial reported net income of $18.9 million for Q1 2025, representing a 9.5% increase from Q1 2024. Diluted earnings per share reached $0.51, up $0.02 from the same period last year. Core net income, which excludes non-recurring items, totaled $20.3 million, an 11.0% year-over-year increase, with core diluted EPS of $0.55 compared to $0.51 in Q1 2024.
As shown in the following comprehensive overview of key metrics from the company’s quarterly highlights:
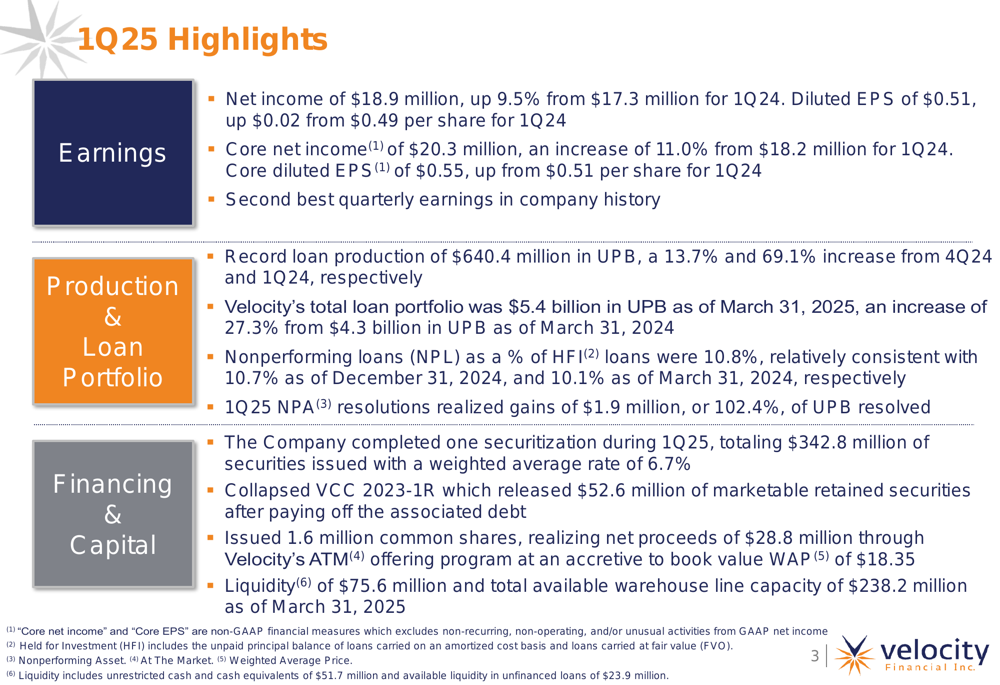
The company described Q1 2025 as its "second best quarterly earnings in company history," following the strong Q4 2024 performance when it reported EPS of $0.57. While Q1 2025 showed sequential EPS decline from Q4, the year-over-year growth remained positive.
GAAP book value per share increased to $16.19 as of March 31, 2025, up 3.2% from $15.70 at the end of 2024. The adjusted book value per share, which reflects the estimated fair value of loans carried at amortized cost and related securitized debt, reached $18.50.
The following chart illustrates the growth in book value per share:
Loan Production and Portfolio Growth
The standout metric for the quarter was Velocity’s record loan production, which totaled $640.4 million in unpaid principal balance (UPB). This represents a 13.7% increase from Q4 2024 and a remarkable 69.1% jump from Q1 2024. The growth was primarily driven by a 33.4% quarter-over-quarter increase in Investor 1-4 Rental volume and a 94.9% year-over-year increase in Traditional Commercial loans.
The following chart breaks down Velocity’s loan production by product type over the past five quarters:
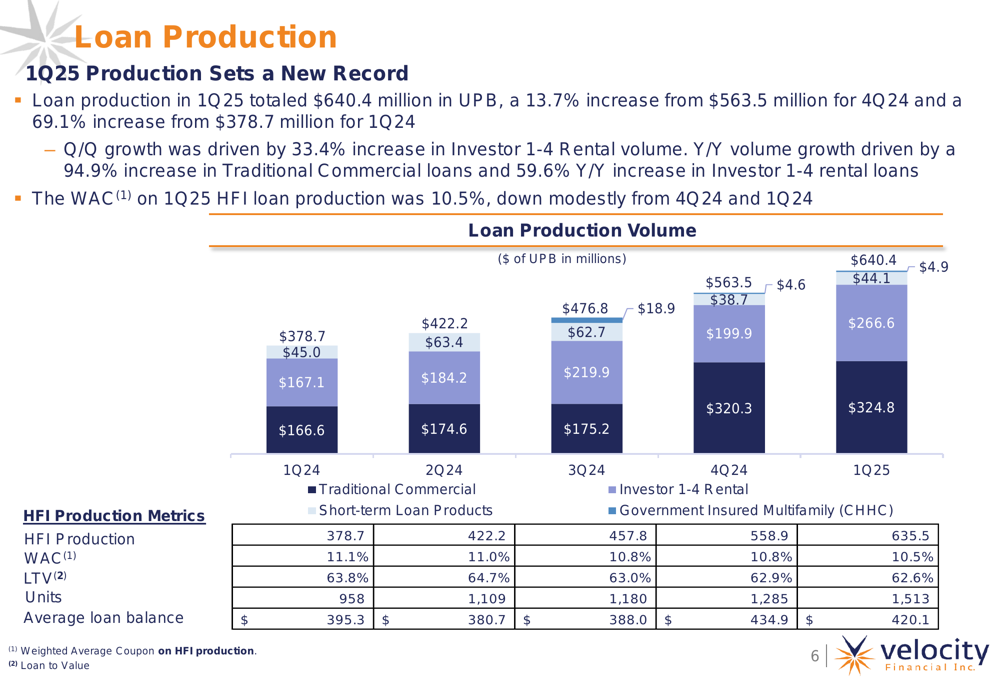
The weighted average coupon (WAC) on Q1 2025 loan production was 10.5%, showing a slight decrease from 10.8% in the previous quarter. The loan-to-value (LTV) ratio remained stable at 62.6%, indicating disciplined underwriting standards.
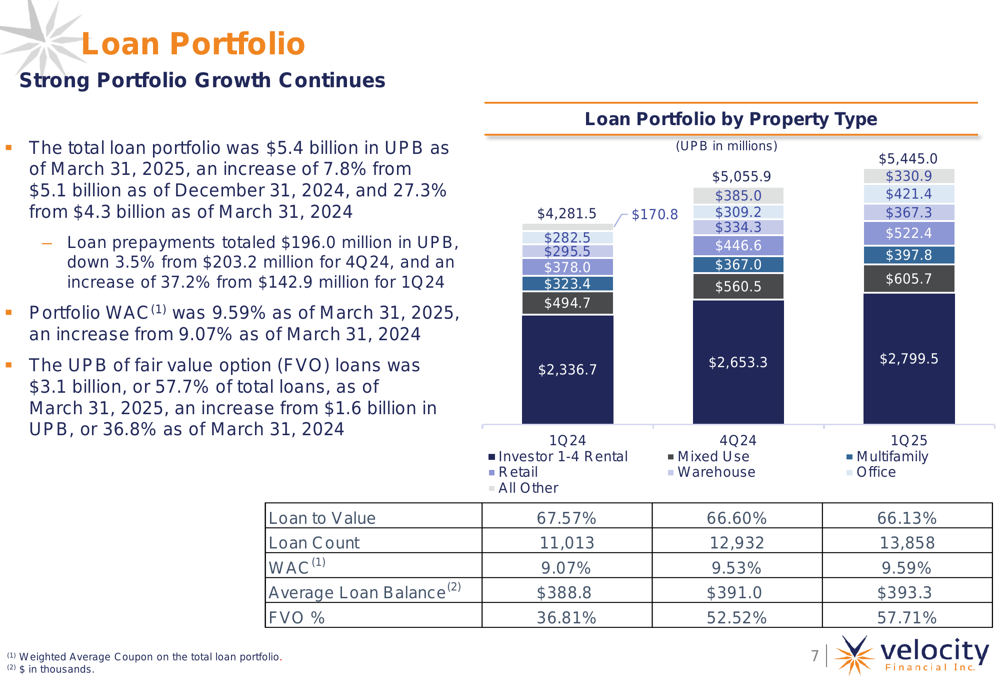
Velocity’s total loan portfolio reached $5.4 billion in UPB as of March 31, 2025, representing a 7.8% increase from December 31, 2024, and a 27.3% year-over-year growth. The portfolio composition remained diversified across property types, with Investor 1-4 Rental properties comprising the largest segment at 51.4% of the total portfolio.
As illustrated in the following portfolio breakdown by property type:
Credit Performance and Asset Quality
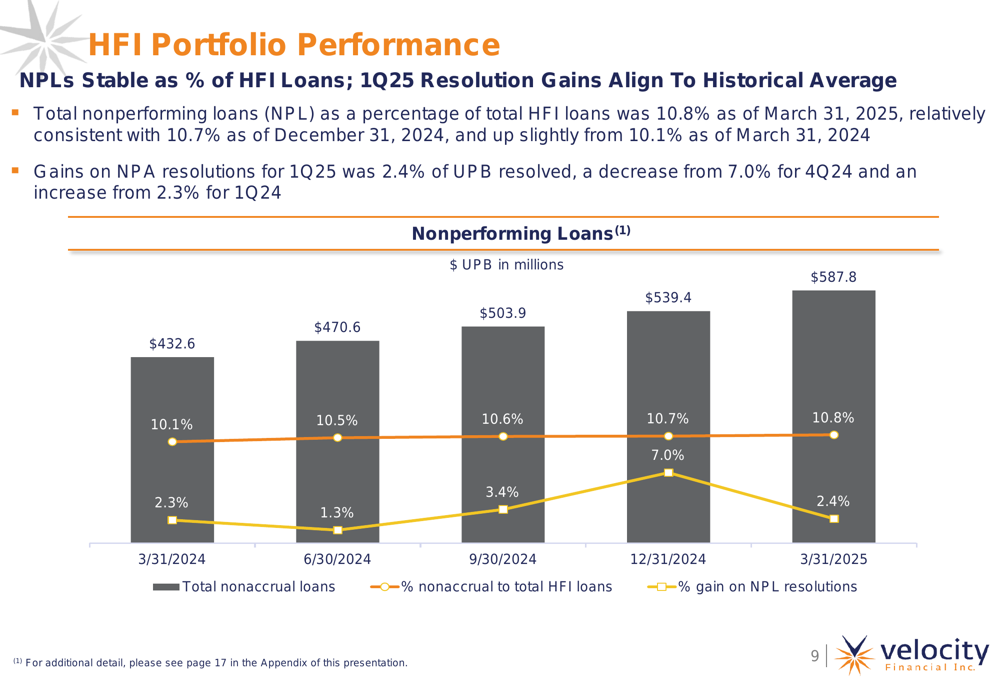
Nonperforming loans (NPLs) as a percentage of total held-for-investment loans stood at 10.8% as of March 31, 2025, showing a slight increase from 10.7% at the end of 2024. While this rate remains elevated, the company continues to successfully resolve nonperforming assets with positive outcomes.
During Q1 2025, NPA resolutions totaled $76.4 million in UPB, realizing 102.4% of UPB resolved, compared to $54.5 million and 102.3% in Q1 2024. This indicates that Velocity continues to recover more than the principal balance when resolving nonperforming assets.
The following chart shows the trend in nonperforming loans over the past five quarters:
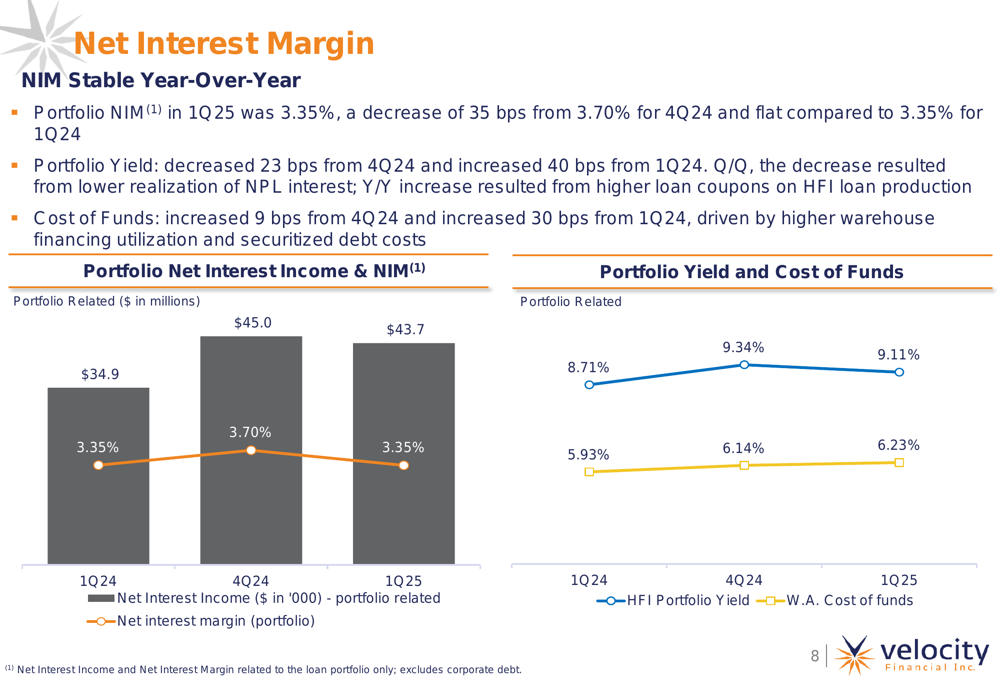
Portfolio net interest margin (NIM) in Q1 2025 was 3.35%, a decrease of 35 basis points from 3.70% in Q4 2024 but unchanged from 3.35% in Q1 2024. This compression was attributed to a 23 basis point decrease in portfolio yield combined with a 9 basis point increase in cost of funds compared to the previous quarter.
The following chart illustrates the trends in portfolio yield, cost of funds, and net interest margin:
Funding Strategy and Liquidity
Velocity maintained a strong liquidity position with $75.6 million in cash reserves and unfinanced collateral as of March 31, 2025. The company had available non-mark-to-market warehouse line capacity of $238.2 million, providing ample resources for continued loan origination.
During Q1 2025, Velocity completed one securitization totaling $342.8 million with a weighted average rate of 6.7%. Subsequent to quarter end, the company completed two additional securitizations in April totaling $488.9 million, including VCC 2025-RTL1 ($111.4 million) and VCC 2025-2 ($377.5 million) with a weighted average rate of 6.4%.
The following chart shows Velocity’s outstanding debt balances and leverage metrics:
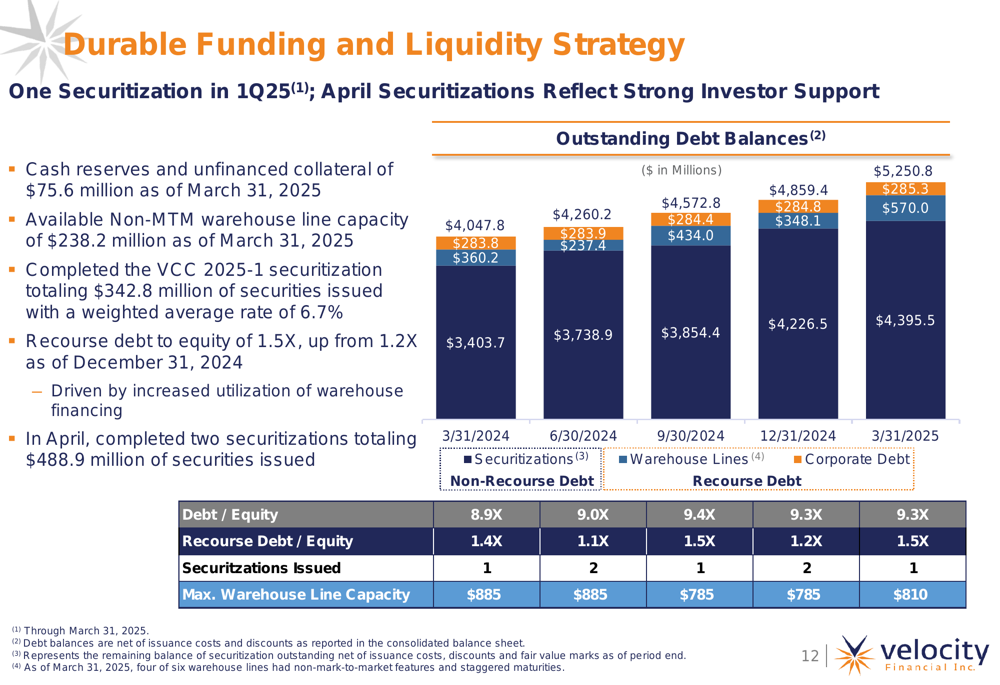
The company’s recourse debt to equity ratio stood at 1.5X as of March 31, 2025, unchanged from the same period a year ago but up from 1.2X at the end of 2024. This increase reflects the company’s strategic use of leverage to fund its growing loan portfolio.
Forward-Looking Statements
Looking ahead, Velocity Financial provided a positive outlook for its key business drivers. The company expects investor property demand to remain strong, with continued resolution of nonperforming assets. The securitization market is anticipated to remain supportive, with the next long-term loan securitization targeted for June 2025.
From an earnings perspective, Velocity projects stable net interest margins and strong interest income growth, supported by positive production growth. The company also emphasized its focus on product and revenue diversification to enhance its market position.
While the U.S. economic outlook remains uncertain, Velocity appears well-positioned to navigate potential challenges with its diversified portfolio and strong capital position. The company’s ability to maintain consistent gains on nonperforming asset resolutions suggests effective risk management practices despite the elevated NPL rate.
Full presentation:
This article was generated with the support of AI and reviewed by an editor. For more information see our T&C.