United Homes Group stock plunges after Nikki Haley, directors resign

Introduction & Market Context
Vidrala SA (BME:VID) presented its first-half 2025 results on July 24, revealing a company navigating challenging market conditions with operational improvements and strengthened financials. The glass container manufacturer’s shares rose 2.28% to €98.80 following the presentation, reflecting positive investor reception despite reported sales declines.
The presentation highlighted Vidrala’s strategic focus on geographical diversification, commercial positioning enhancement, and industrial footprint optimization in response to what the company described as a "persistently softer-than-expected global demand context." These efforts follow the divestiture of Vidrala Italia in 2024, which has affected year-over-year comparisons.
H1 2025 Financial Performance Highlights
Vidrala reported H1 2025 sales of €750.1 million, representing a 9.7% decline from the same period last year. When adjusted for constant currency and comparable scope (excluding the divested Italian operations), sales decreased by 6.7%.
Despite this revenue contraction, the company demonstrated operational resilience with EBITDA reaching €216.1 million. While this represents a 4.0% year-over-year decline in absolute terms, EBITDA remained flat on a constant currency and comparable scope basis.
As shown in the following key financial metrics:
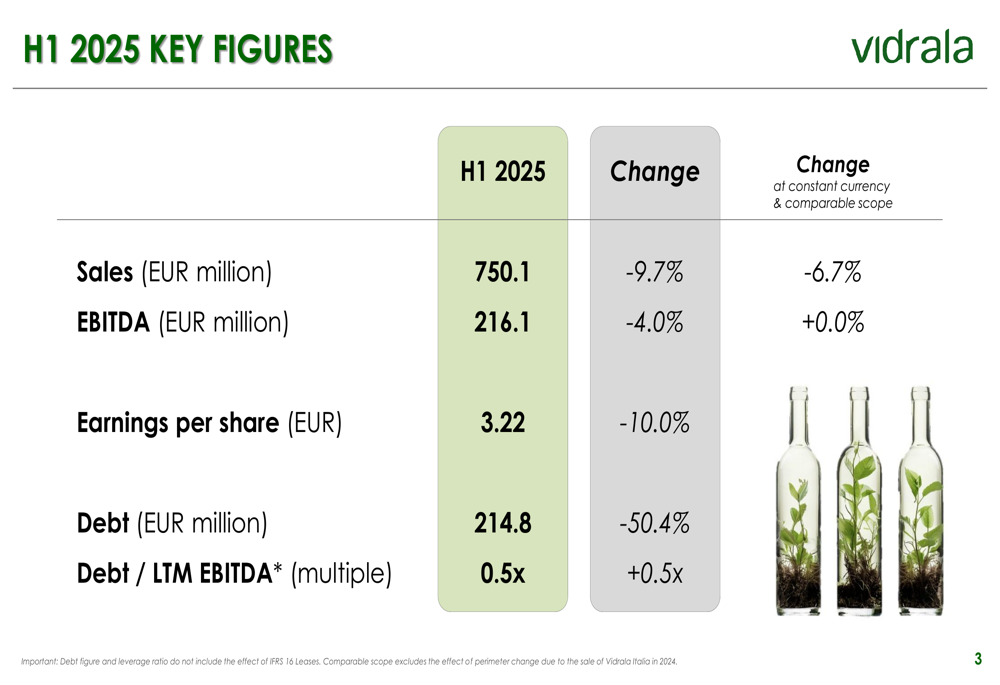
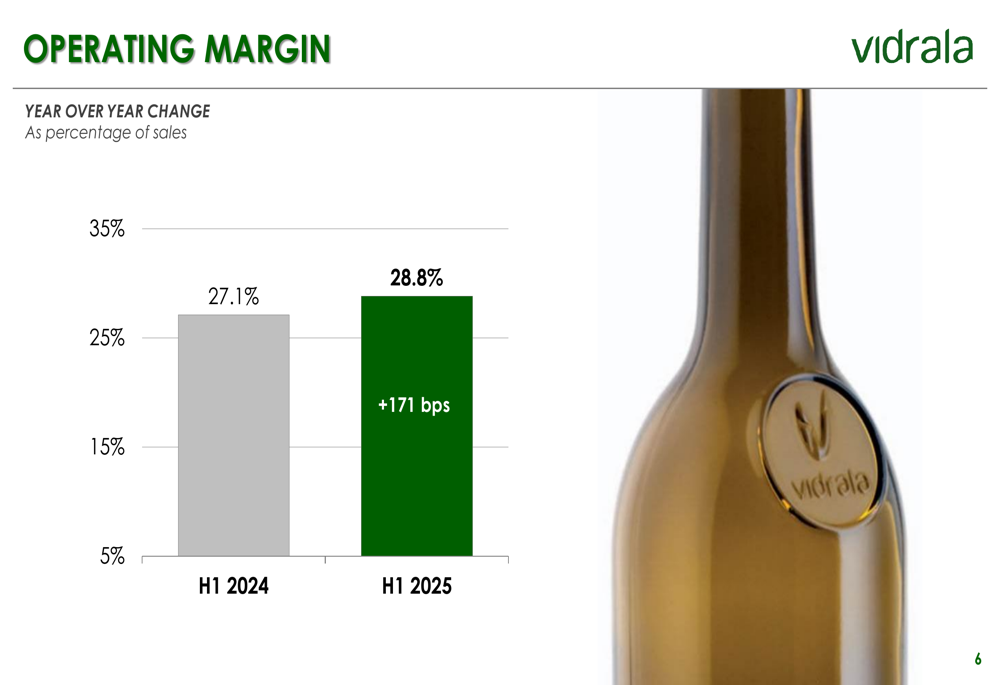
The company’s operating margin improved significantly to 28.8% in H1 2025, representing a 171 basis point increase from 27.1% in H1 2024. This margin expansion amid declining sales underscores Vidrala’s focus on operational efficiency and cost management.
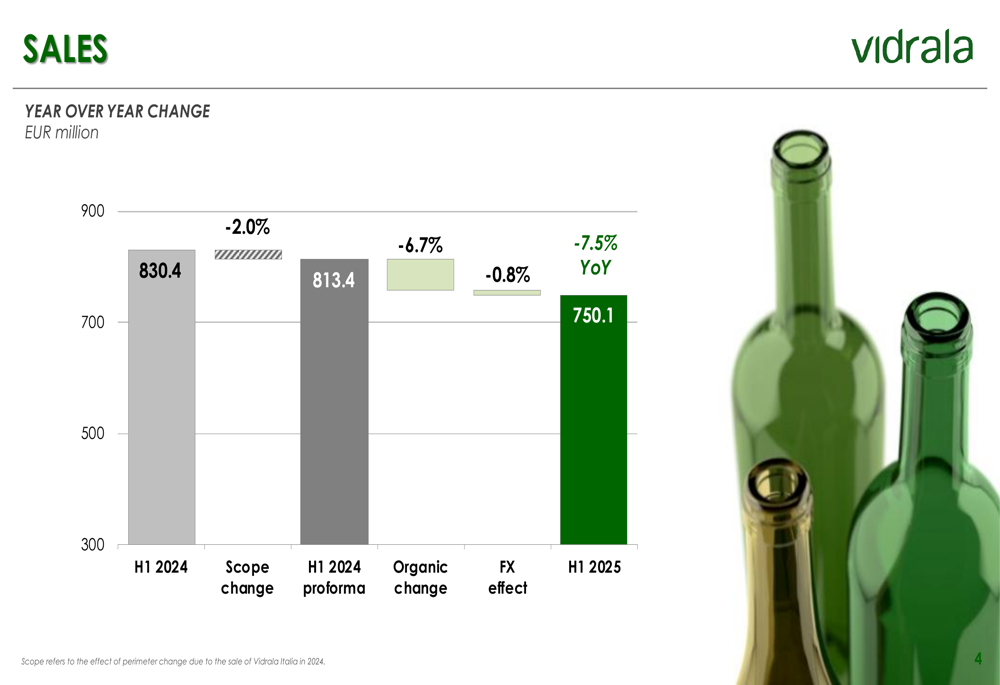
A detailed breakdown of the sales performance reveals that the 9.7% decline was driven by multiple factors, including a 2.0% reduction due to the scope change from the Italian divestiture, a 6.7% organic decline, and a 0.8% negative impact from currency fluctuations:
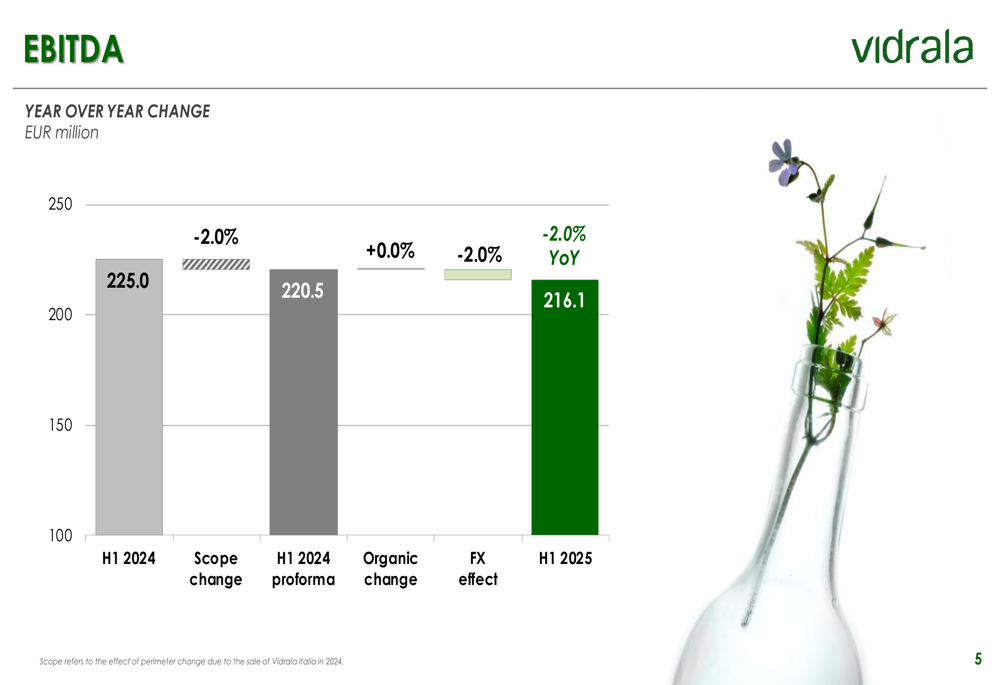
Similarly, EBITDA performance was affected by comparable factors, with the 4.0% decline attributable to a 2.0% reduction from scope change, flat organic performance, and a 2.0% negative currency impact:
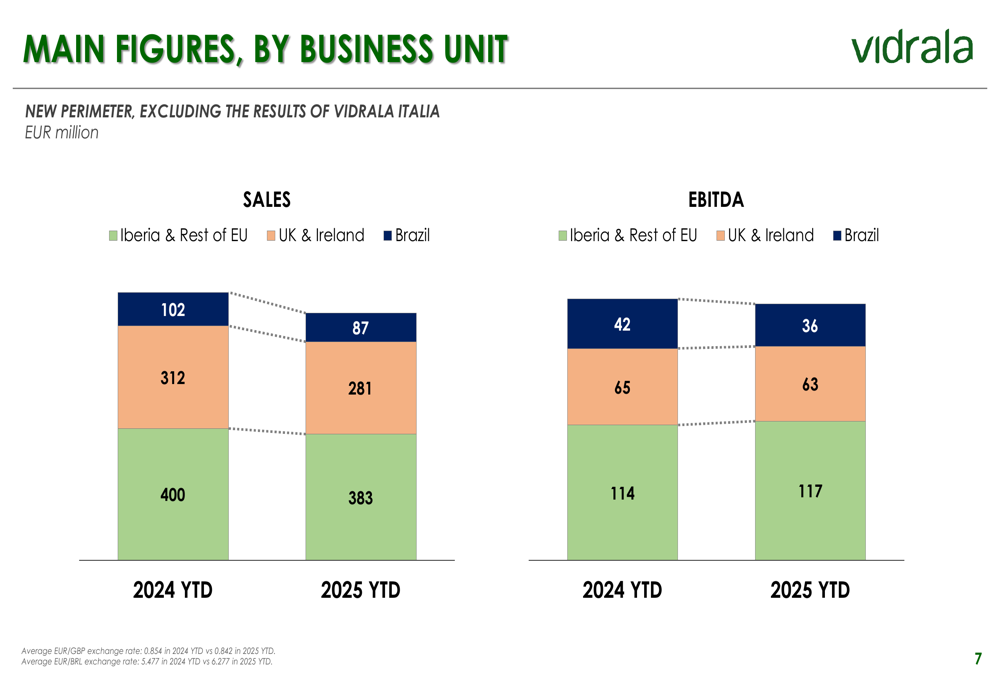
Regional Performance Analysis
Vidrala’s presentation provided insight into performance variations across its three main business units. The Iberia & Rest of EU region demonstrated relative resilience, with sales declining from €400 million to €383 million while EBITDA actually increased from €114 million to €117 million.
The UK & Ireland segment faced more significant challenges, with sales dropping from €312 million to €281 million and EBITDA declining from €65 million to €63 million. The Brazil operation experienced the most pronounced percentage declines, with sales falling from €102 million to €87 million and EBITDA decreasing from €42 million to €36 million.
This regional breakdown illustrates the varying market conditions across Vidrala’s operational footprint:
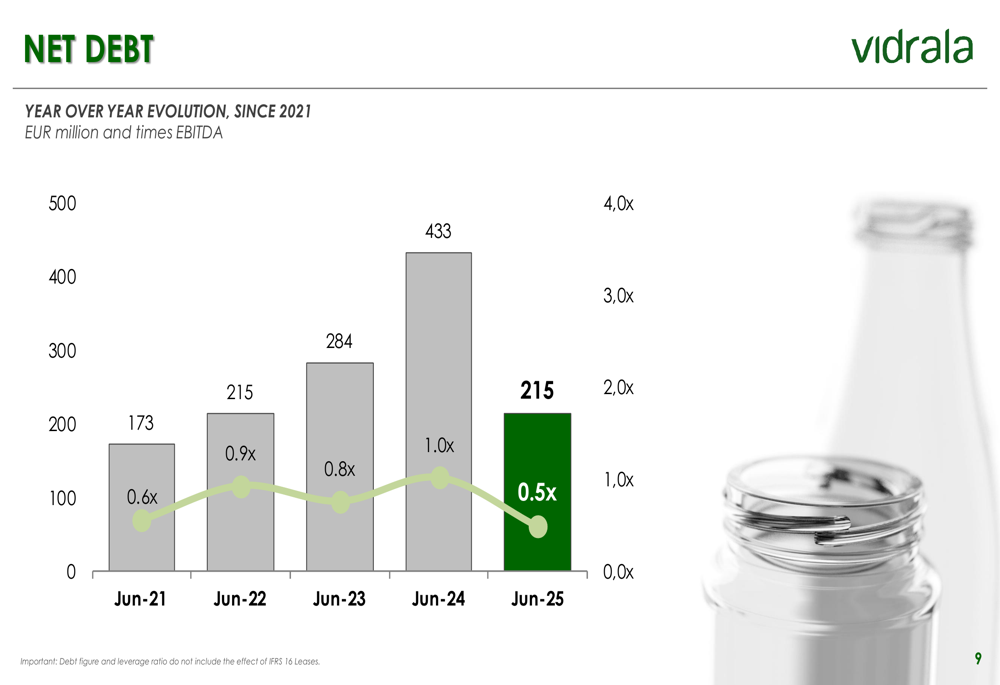
Debt Reduction and Cash Generation
A standout achievement in Vidrala’s H1 2025 results was the significant strengthening of its balance sheet. Net debt decreased dramatically to €214.8 million, representing a 50.4% reduction compared to the previous year. This improved the company’s leverage ratio to 0.5x last twelve months EBITDA, down from 1.0x in June 2024.
The five-year trend shows Vidrala’s successful debt management strategy, with the current debt level returning to levels last seen in 2021-2022:
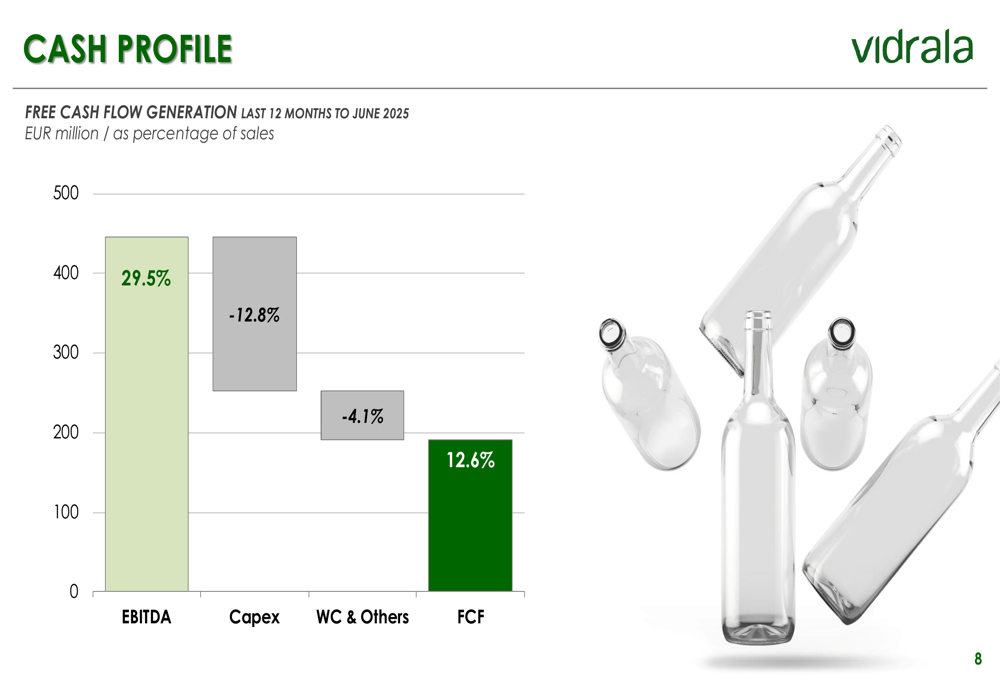
This debt reduction was supported by strong free cash flow generation, which reached 12.6% of sales for the last twelve months to June 2025. The company’s cash profile demonstrates effective capital expenditure management at 12.8% of sales, with working capital and other items consuming 4.1% of sales:
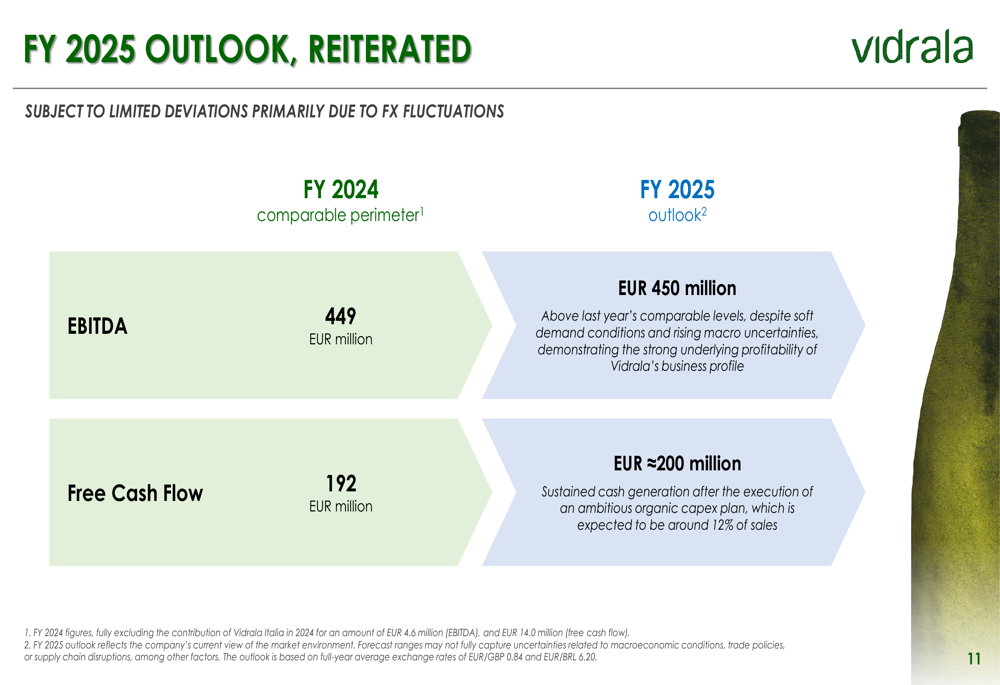
Forward Outlook and Guidance
Vidrala reiterated its full-year 2025 outlook, projecting EBITDA of €450 million, essentially flat compared to the €449 million reported for FY 2024 on a comparable perimeter basis. Free cash flow is expected to reach approximately €200 million, slightly above the €192 million generated in 2024.
The company noted that this guidance is "subject to limited deviations primarily due to FX fluctuations" and is based on full-year average exchange rates of EUR/GBP 0.84 and EUR/BRL 6.20:
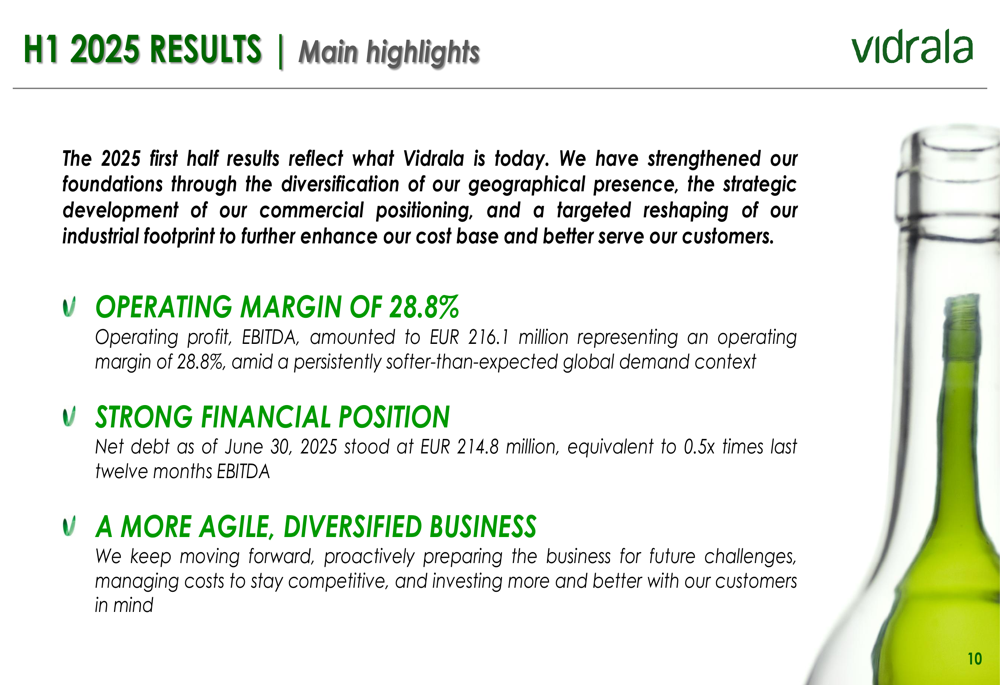
In summarizing its H1 2025 performance, Vidrala emphasized three key achievements: an operating margin of 28.8% despite challenging demand conditions, a strong financial position with significantly reduced debt, and progress toward becoming "a more agile, diversified business" through proactive preparation for future challenges:
This presentation shows a company focused on operational efficiency and financial strength amid challenging market conditions. While sales have declined, Vidrala’s improved margins and dramatically reduced debt position the company to navigate ongoing market uncertainties while maintaining its strategic focus on geographical diversification and industrial optimization.
Full presentation:
This article was generated with the support of AI and reviewed by an editor. For more information see our T&C.