CVS Group shares surge over 10% after FY25 EBITDA beats estimates

Introduction & Market Context
Vishay Intertechnology (NYSE:VSH) reported its second quarter 2025 results on August 6, showing sequential revenue growth but continued profitability challenges. The electronic components manufacturer posted revenue of $762.3 million, up 6.6% from the previous quarter and 2.8% year-over-year, while delivering GAAP earnings per share of $0.01 and adjusted EPS of -$0.07.
The stock traded slightly higher in premarket trading, up 0.12% to $16.03, suggesting investors had already priced in the mixed results following the company’s disappointing Q1 performance when the stock fell 8.11% after missing EPS expectations.
Quarterly Performance Highlights
Vishay’s Q2 2025 revenue of $762.3 million showed improvement from both Q1 2025 ($715.2 million) and Q2 2024 ($741.2 million). The company reported a book-to-bill ratio of 1.02, indicating potential continued growth, with passive components (1.06) outperforming semiconductors (0.98).
As shown in the following chart highlighting key financial metrics:
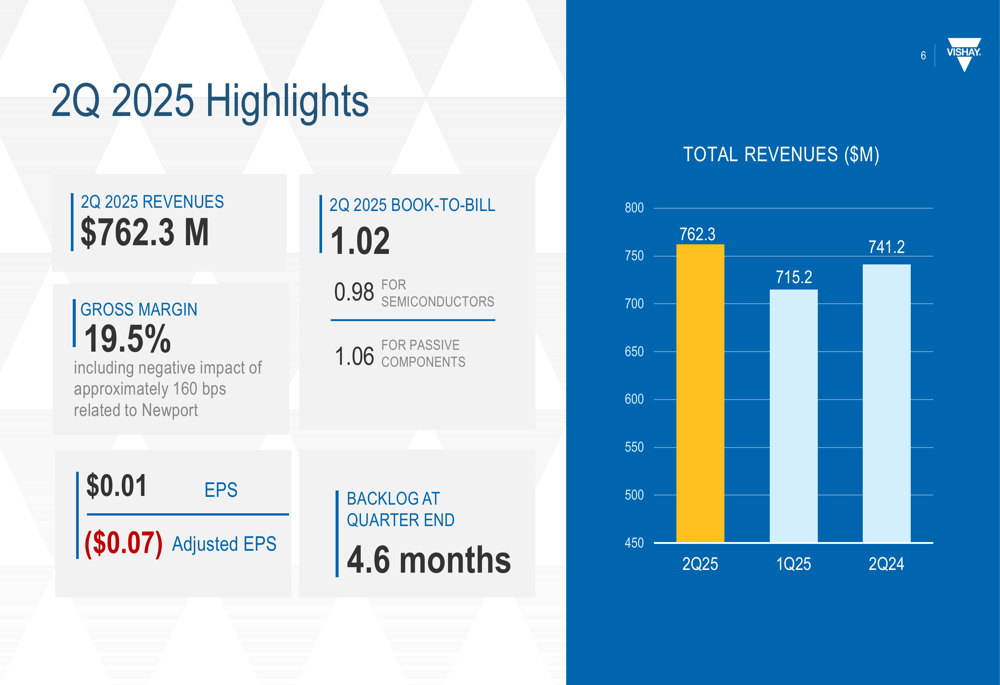
Gross margin reached 19.5%, a slight improvement from 19.0% in Q1, but still below the 22.0% achieved in Q2 2024. The company noted that Newport operations negatively impacted gross margin by approximately 160 basis points. Operating margin improved to 2.9% from 0.1% in the previous quarter, though this included an $11.3 million benefit from the favorable resolution of a contingency.
A detailed breakdown of segment performance reveals varying results across product categories:
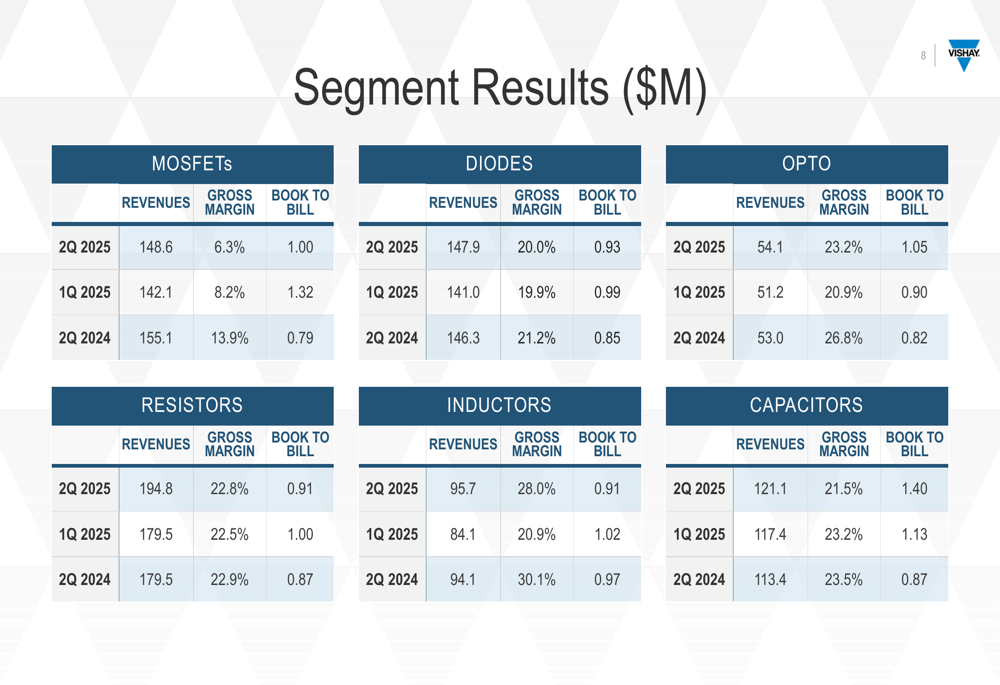
MOSFETs continued to face margin pressure, with gross margin declining to 6.3% from 8.2% in Q1 and 13.9% a year ago. Capacitors showed the strongest book-to-bill ratio at 1.40, suggesting potential growth ahead, while Inductors delivered the highest gross margin at 28.0%.
Regional and End Market Analysis
Vishay’s performance varied significantly by region, with Asia emerging as the clear growth driver. The company’s revenue mix by region shows Asia contributed 42% of total revenue, up from 40% in Q1 and 38% a year ago:
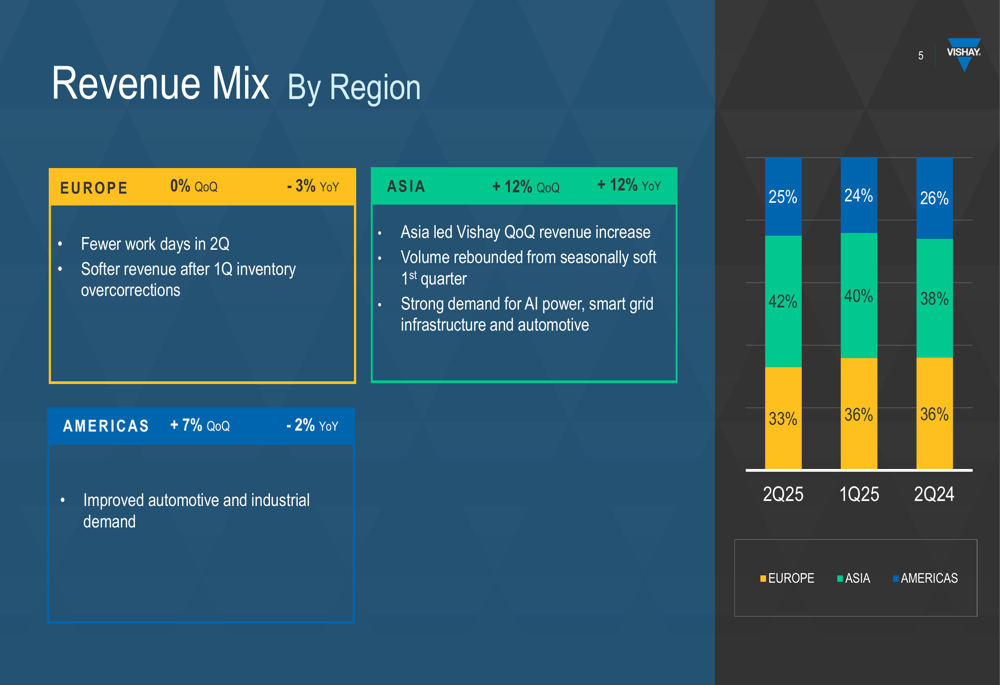
Asia delivered 12% sequential and 12% year-over-year growth, driven by AI power applications, smart grid infrastructure, and automotive demand. The Americas showed 7% sequential growth but declined 2% year-over-year, while Europe remained flat quarter-over-quarter and fell 3% year-over-year.
By end market, industrial applications led growth with a 9% sequential increase and 2% year-over-year improvement, contributing 35% of total revenue:
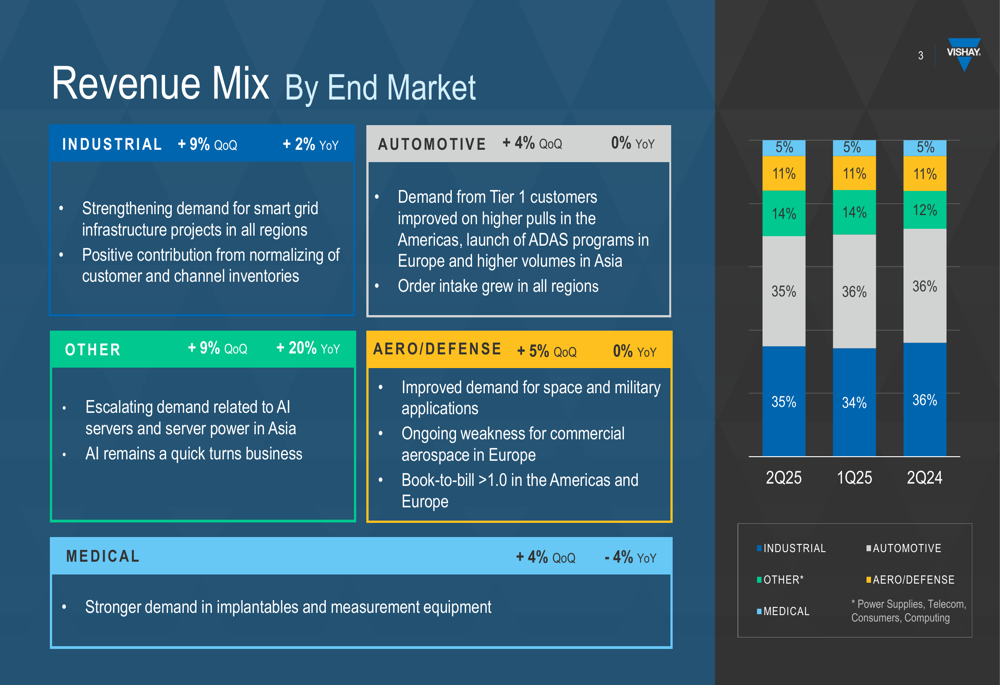
The company highlighted strengthening demand for smart grid infrastructure projects and normalization of customer and channel inventories in the industrial segment. Automotive demand from Tier 1 customers improved, especially in the Americas due to ADAS program launches in Europe and higher volumes in Asia.
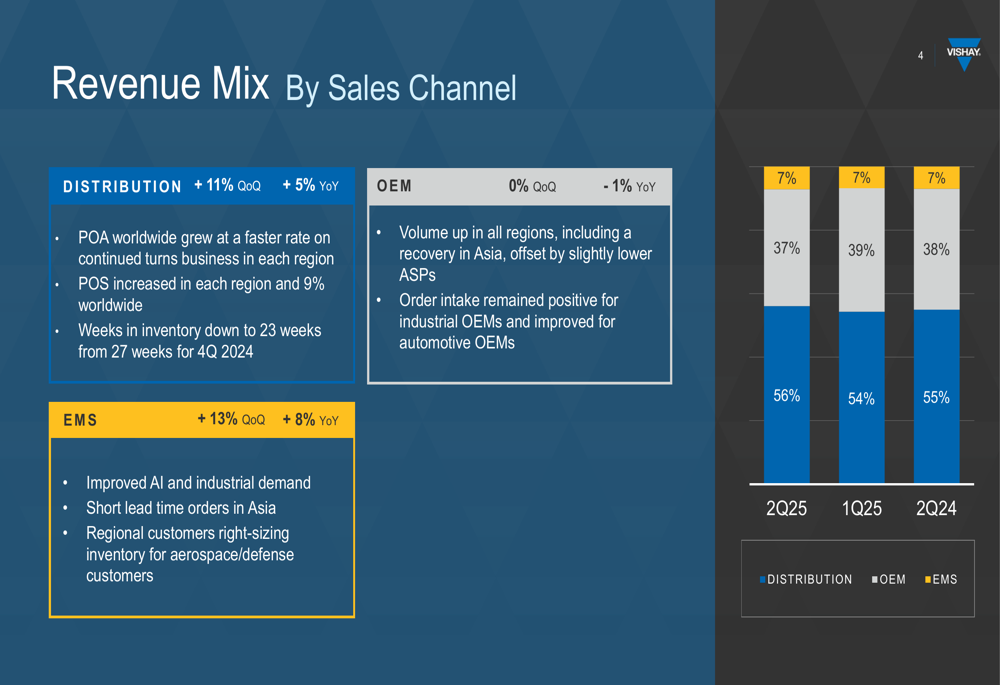
Distribution channels showed strong performance with 11% sequential and 5% year-over-year growth, contributing 56% of total revenue:
Financial Health Assessment
Despite revenue growth, Vishay continues to face cash flow challenges. The company reported negative cash flow from operations of $8.8 million in Q2 and negative free cash flow of $73.2 million, primarily due to high capital expenditures of $64.6 million.
The cash conversion cycle increased slightly to 130 days from 129 days in Q1 and 125 days a year ago, indicating some pressure on working capital efficiency. The following chart illustrates the company’s cash flow generation:
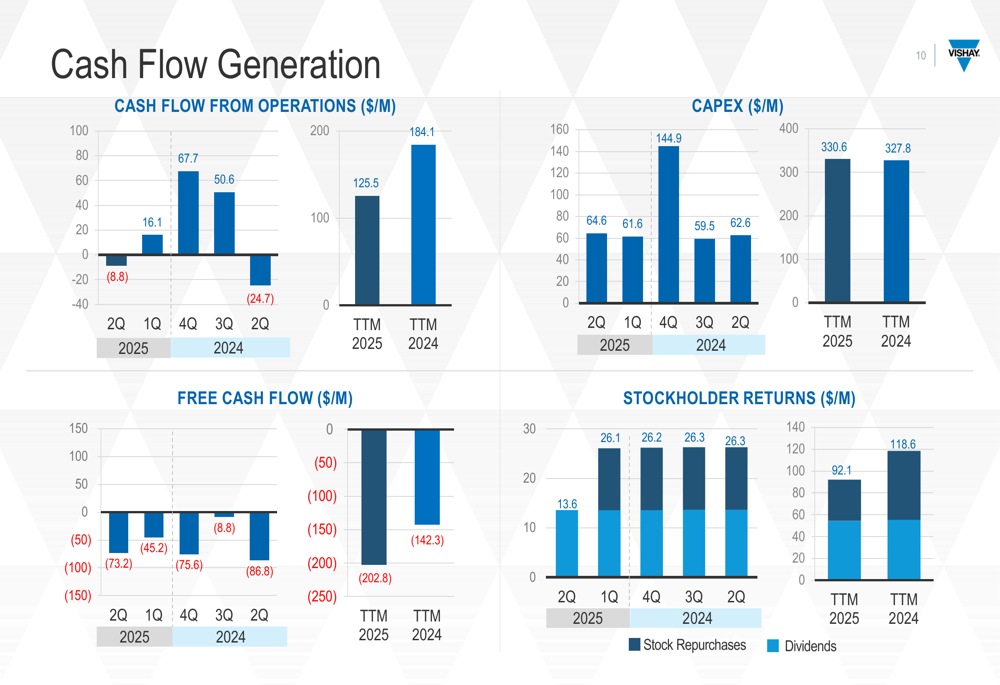
The company’s high capital expenditures reflect ongoing investments in capacity expansion, which management views as necessary for long-term growth but creates near-term pressure on free cash flow.
Strategic Initiatives and Outlook
Looking ahead, Vishay provided guidance for Q3 2025, projecting revenue of $775 million (±$20 million) and gross margin of 19.7% (±50 bps), with Newport expected to continue negatively impacting margins by 160-185 basis points:
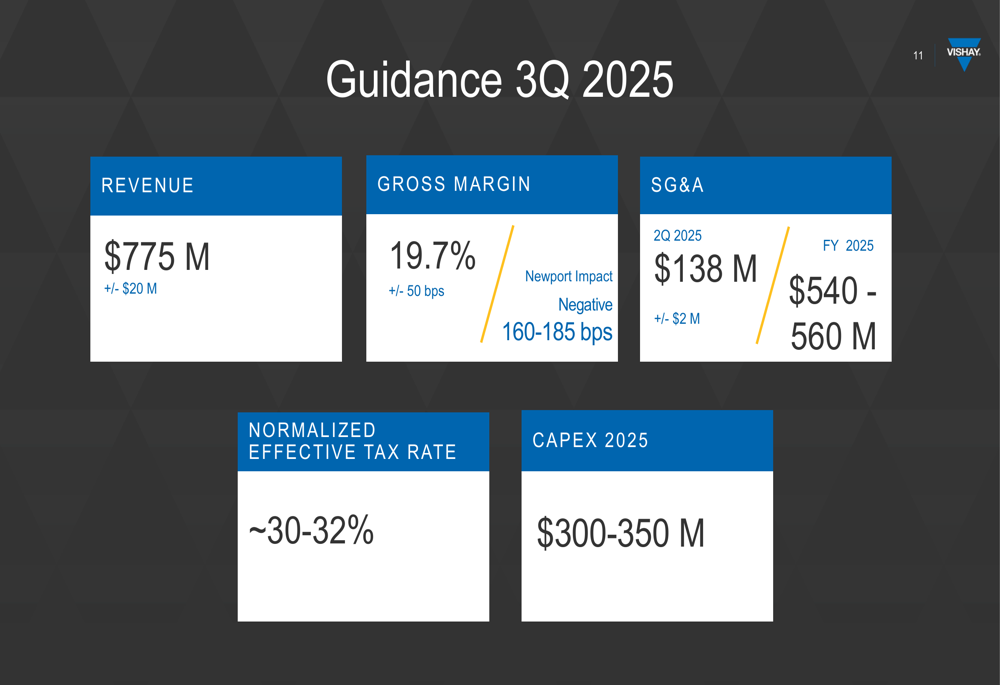
For the full year 2025, the company expects SG&A expenses of $540-560 million and capital expenditures of $300-350 million, with a normalized effective tax rate of 30-32%.
Vishay also reaffirmed its long-term financial goals for 2028, targeting significant improvements across key metrics:
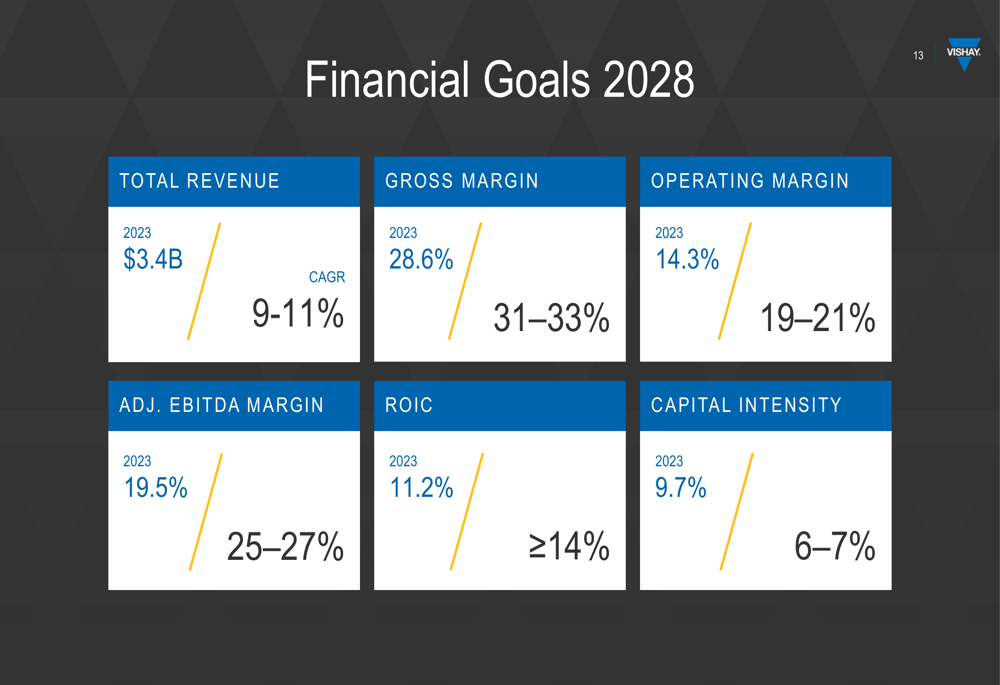
The company aims to grow revenue at a 9-11% CAGR from its 2023 base of $3.4 billion, while substantially improving profitability with gross margin targets of 31-33% (vs. 28.6% in 2023) and operating margin of 19-21% (vs. 14.3% in 2023).
Competitive Industry Position
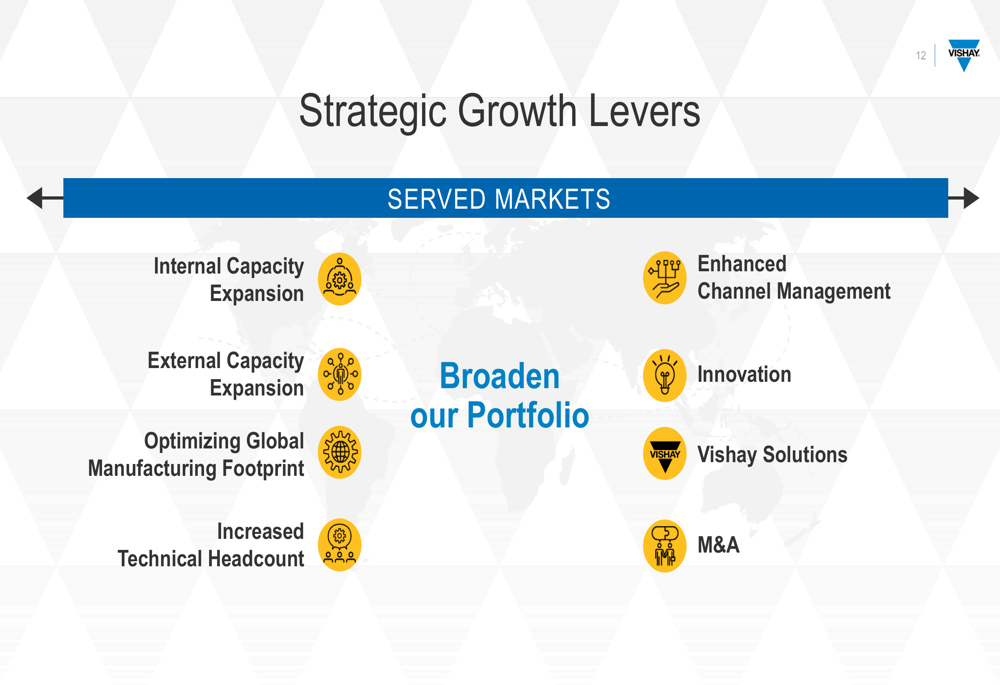
Vishay emphasized its strategic growth levers, focusing on both expanding served markets through capacity expansion and broadening its portfolio through innovation and M&A:
The company highlighted its position as a comprehensive supplier, claiming the ability to provide "~80% of BOM in power applications." Vishay’s product mix shows a strategic emphasis on custom products, which represent 49% of total revenue, followed by commodity products (27%) and certified products (24%).
While facing near-term profitability challenges, Vishay’s diverse customer base across multiple industries and regions provides some resilience. However, the significant gap between current performance and 2028 targets suggests substantial execution challenges ahead as the company works to improve margins while investing in growth.
Full presentation:
This article was generated with the support of AI and reviewed by an editor. For more information see our T&C.