Nuscale Power earnings missed by $0.02, revenue fell short of estimates

Introduction & Market Context
Vital Energy Inc (NASDAQ:NYSE:VTLE) released its second quarter 2025 earnings presentation on August 6, 2025, highlighting the company’s focus on maximizing free cash flow and reducing debt through operational efficiencies and cost optimization. The Permian Basin-focused producer’s stock closed at $16.67 on the day of the presentation, with a 1.56% gain in after-hours trading, still significantly below its 52-week high of $39.21.
The presentation comes after Vital Energy reported better-than-expected Q1 2025 earnings of $2.37 per share in May, though revenue fell short of forecasts at $512.18 million. The company’s Q2 presentation reveals an increased focus on balance sheet improvement amid ongoing volatility in energy markets.
Quarterly Performance Highlights
Vital Energy reported solid operational performance in Q2 2025, with total production of 137.9 MBOE/d, exceeding the midpoint of guidance despite weather-related disruptions that reduced quarterly average production by 780 BOE/d. Oil production reached 62.1 MBO/d, within the company’s guidance range of 61.0-65.0 MBO/d.
The company generated $252 million in cash flows from operating activities and $338 million in consolidated EBITDAX during the quarter. Adjusted free cash flow totaled $36 million, supporting the company’s debt reduction initiatives.
As shown in the following chart comparing Q2 2025 guidance with reported results:
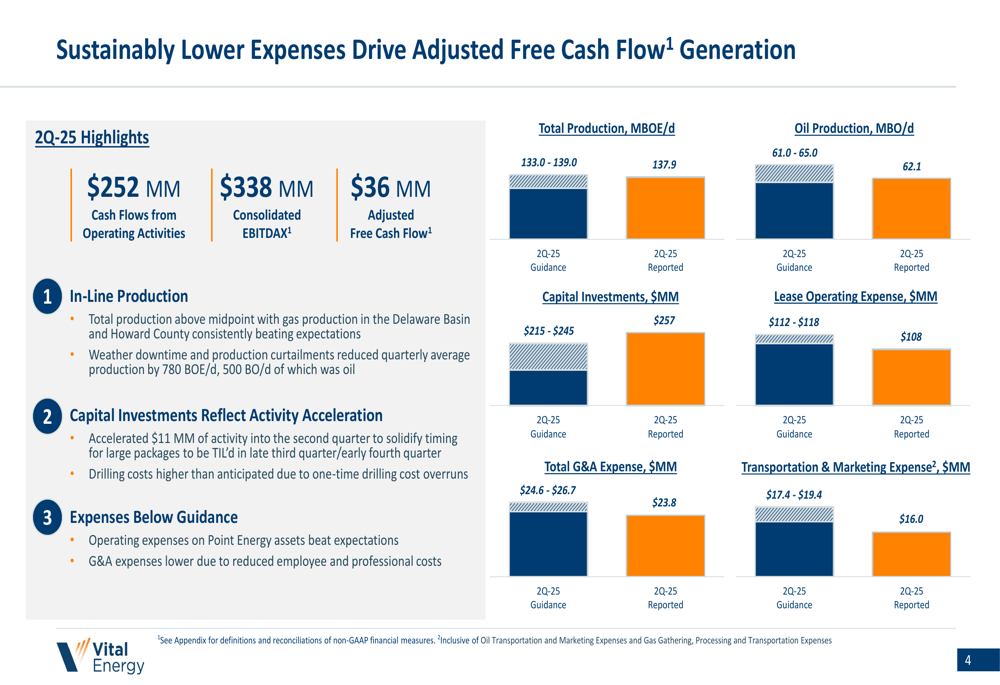
Capital investments of $257 million exceeded guidance of $215-245 million due to accelerated activity and one-time drilling cost overruns. However, the company achieved better-than-expected results in operating expenses, with lease operating expenses, G&A expenses, and transportation and marketing expenses all coming in below guidance.
Cost Optimization Initiatives
A key focus of Vital Energy’s presentation was its successful cost optimization efforts, which have reduced ongoing expenses by approximately 6% versus initial expectations. These savings come from renegotiated service contracts, conversion to high-line power, consolidation of lease operator routes, and optimization of chemical treatment parameters.
The company has also reduced its G&A expense outlook by nearly 20% since the Point Energy acquisition, partly through a 10% reduction in employee and contractor headcount implemented in June 2025.
The following chart illustrates the company’s cost optimization progress and future guidance:
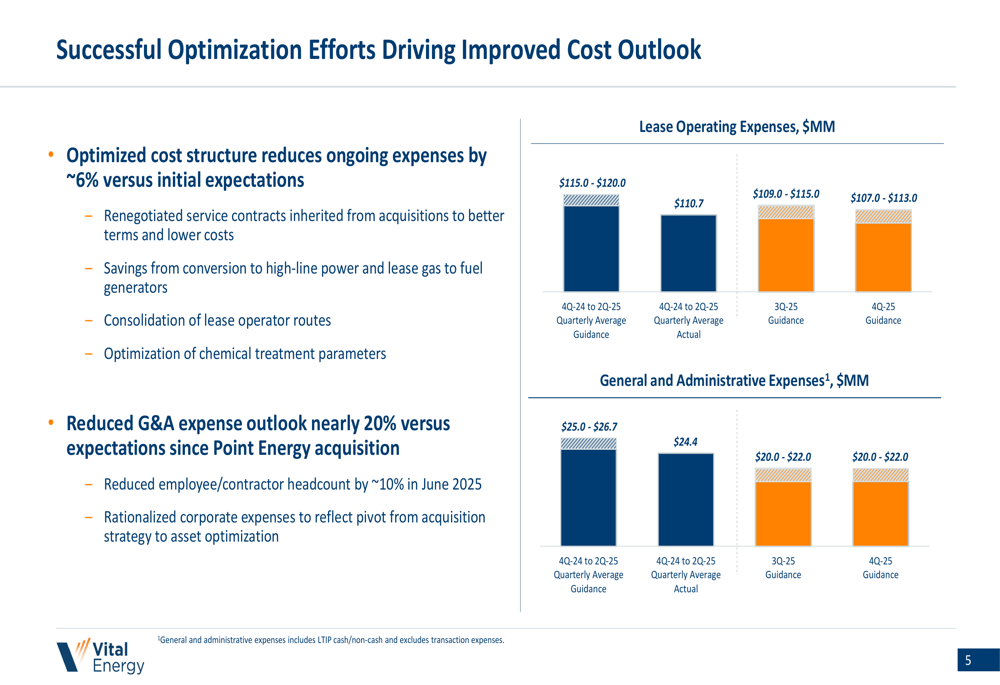
For the second half of 2025, Vital Energy expects further reductions in lease operating expenses to $109-115 million in Q3 and $107-113 million in Q4. Similarly, G&A expenses are projected to decrease to $20-22 million in both Q3 and Q4, down from the $24.4 million quarterly average in the first half of the year.
Capital Efficiency and Well Design Innovations
Vital Energy highlighted significant improvements in capital efficiency for the second half of 2025, particularly through longer lateral lengths and innovative well designs. The company is implementing advanced drilling techniques, including horseshoe and J-hook well designs, which are extending and improving inventory while lowering breakeven costs.
As illustrated in the following comparison of productivity and costs between first and second half 2025:
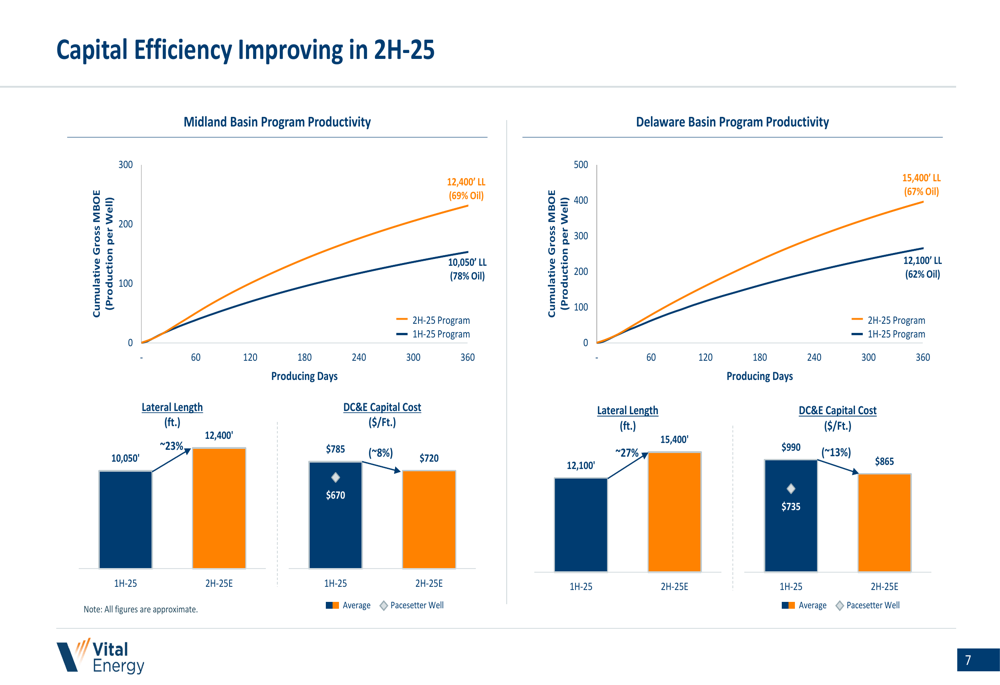
In the Midland Basin, lateral lengths are increasing by approximately 23% to 12,400 feet in 2H-25, while the Delaware Basin is seeing a 27% increase to 15,400 feet. These longer laterals, combined with reduced drilling, completion, and equipment costs, are expected to improve capital efficiency significantly.
The company’s innovative well designs are also contributing to inventory improvement:
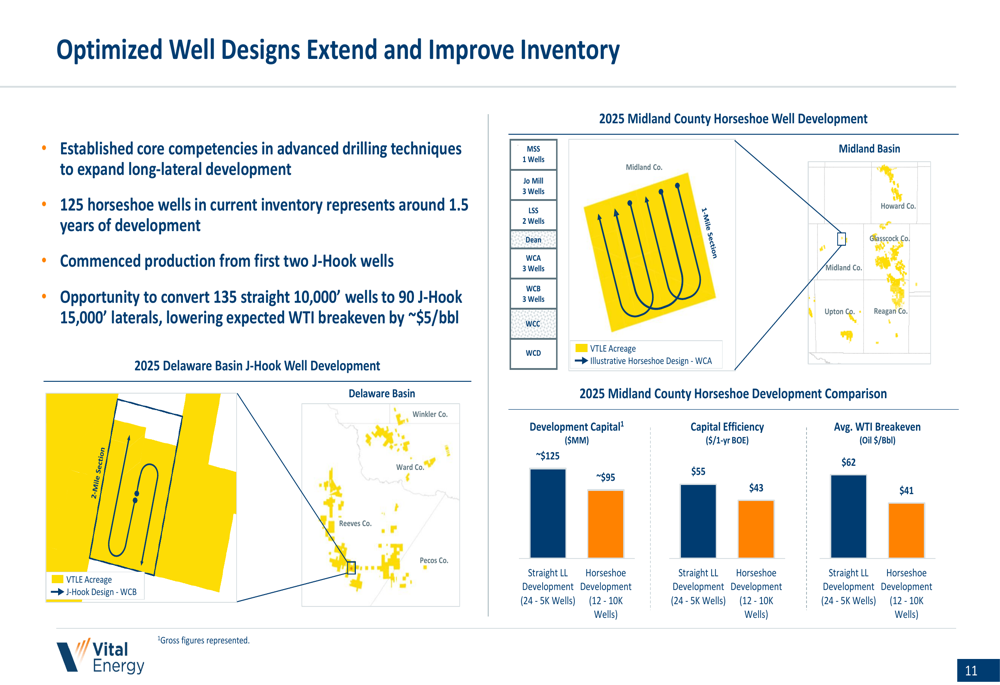
Horseshoe well designs are showing improved economics compared to straight laterals, with development capital reduced from ~$125 million to ~$95 million and WTI breakeven prices lowered from $43 to $41 per barrel. The company has also begun production from its first two J-Hook wells and sees an opportunity to convert 135 straight 10,000’ wells to 90 J-Hook 15,000’ laterals, potentially lowering expected WTI breakeven by approximately $5/bbl.
Balance Sheet Improvement Strategy
Debt reduction emerged as the central theme of Vital Energy’s presentation, with the company targeting approximately $310 million in debt repayment by year-end 2025. This includes $27 million from non-core asset sales, with the remainder coming from free cash flow generation.
The following chart details the company’s debt maturity profile and expected net debt reduction:
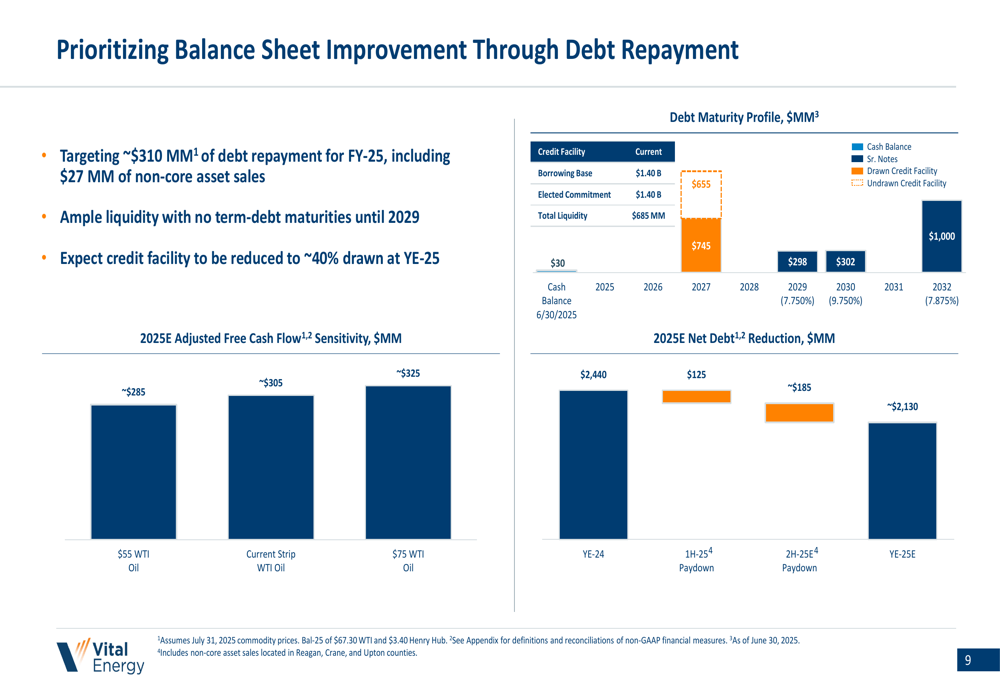
As of June 30, 2025, Vital Energy had a cash balance of $30 million and $745 million drawn on its credit facility. The company expects the credit facility to be approximately 40% drawn by year-end 2025, providing ample liquidity with no term-debt maturities until 2029.
The company’s 2025 adjusted free cash flow is projected at approximately $305 million based on current strip pricing, with sensitivity analysis showing $285 million at $55 WTI and $325 million at $75 WTI. This represents an increase from the $265 million projection mentioned in the Q1 earnings call, reflecting the company’s improved cost structure and operational efficiencies.
Production and Free Cash Flow Outlook
Vital Energy reaffirmed its full-year 2025 production guidance of 136.5-139.5 MBOE/d, with oil production expected to be 63.3-65.3 MBO/d. However, the company anticipates a temporary dip in production during Q3 before rebounding strongly in Q4.
The quarterly production outlook is illustrated in the following chart:
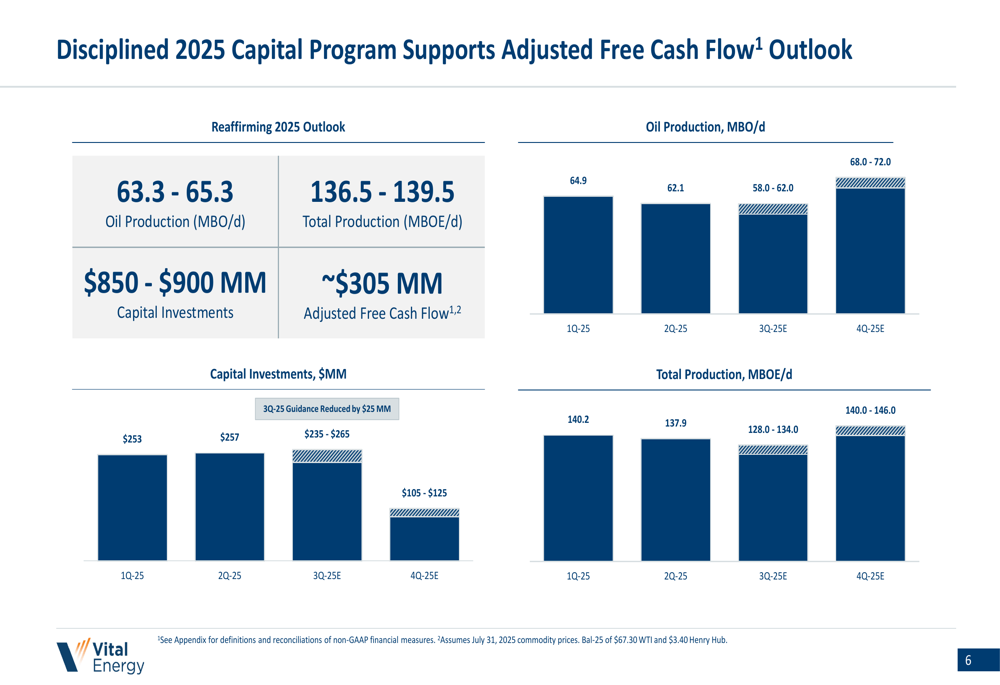
Oil production is expected to decline to 58.0-62.0 MBO/d in Q3 before increasing to 68.0-72.0 MBO/d in Q4. Similarly, total production is projected to drop to 128.0-134.0 MBOE/d in Q3 before recovering to 140.0-146.0 MBOE/d in Q4.
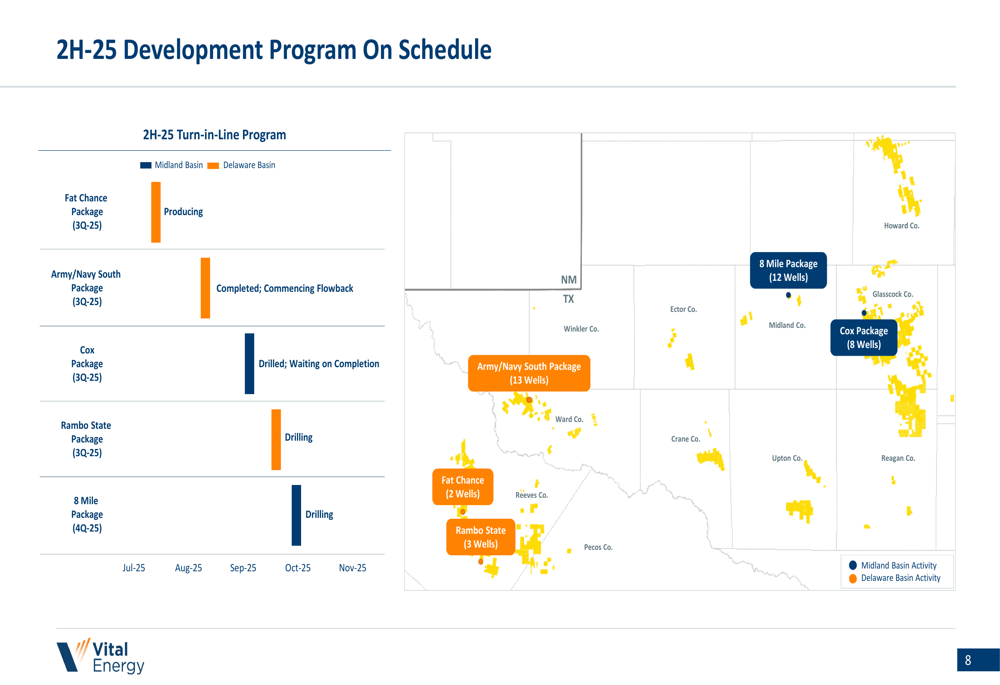
The company’s 2H-25 development program is on schedule, with several packages at various stages of completion:
To support its cash flow targets, Vital Energy has implemented an active hedging program, with approximately 95% of expected 2H-25 oil production hedged at around $69 per barrel WTI. This hedging position helps underpin the company’s free cash flow generation and debt reduction goals despite potential commodity price volatility.
Long-Term Inventory and Sustainability
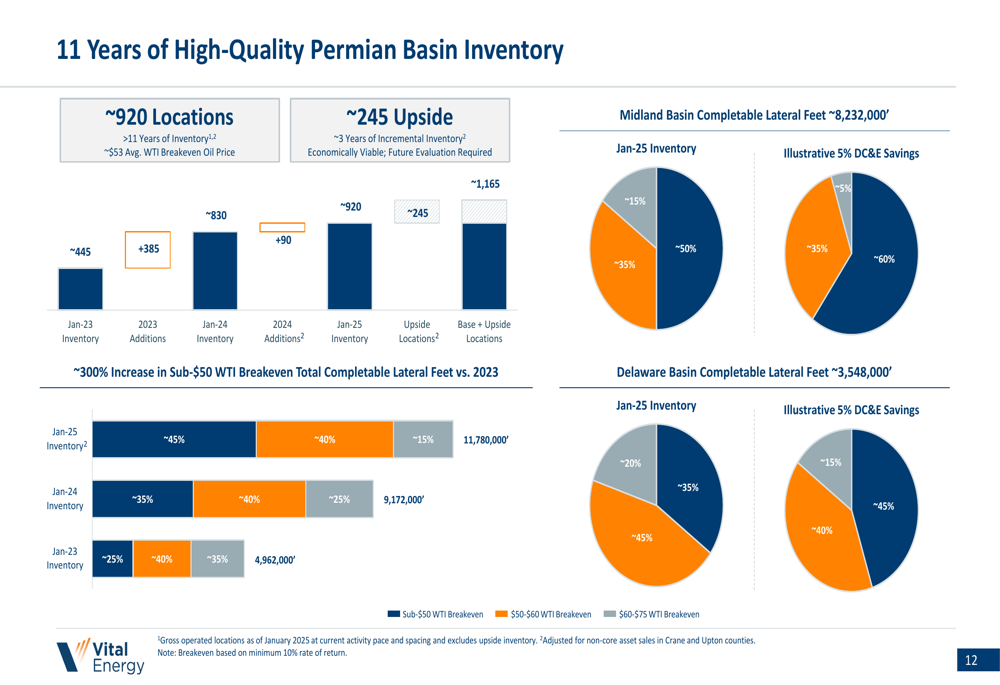
Vital Energy emphasized its deep inventory of high-quality drilling locations in the Permian Basin, with approximately 920 locations representing over 11 years of inventory at an average WTI breakeven oil price of $53 per barrel.
The following chart illustrates the company’s inventory depth and quality:
The company also highlighted its sustainability achievements, with all 2023 performance metrics meeting or exceeding targets:
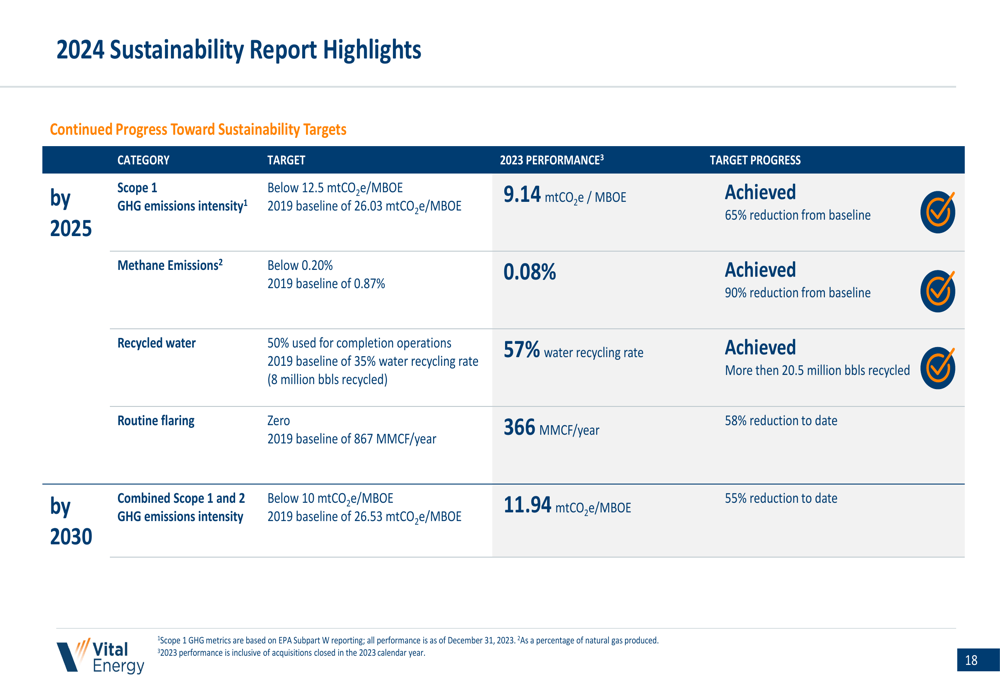
Notable achievements include reducing Scope 1 GHG emissions intensity to 9.14 mtCO2e/MBOE (target:below 12.5), lowering methane emissions to 0.08% (target:below 0.20%), and achieving a 57% water recycling rate (target:50%).
Conclusion
Vital Energy’s Q2 2025 presentation outlines a clear strategy focused on maximizing free cash flow generation and reducing debt through operational efficiencies, cost optimization, and innovative well designs. The company’s projected $305 million in adjusted free cash flow for 2025 is expected to fund approximately $310 million in debt reduction, improving the balance sheet while maintaining production levels.
While the company faces challenges, including a temporary production dip in Q3 and the need to manage its still-significant debt load, the presentation demonstrates progress in cost control and capital efficiency that could position Vital Energy for improved financial performance in the coming quarters.
Full presentation:
This article was generated with the support of AI and reviewed by an editor. For more information see our T&C.