U.S. stocks edge higher after weekly jobless claims; Salesforce gains

Introduction & Market Context
Viva Wine Group AB (NASDAQ:VIVA) presented its second quarter 2025 results on August 28, 2025, highlighting significant revenue growth driven primarily by its recent acquisition of Delta Wines. The company's stock declined 3.59% to 37.60 SEK following the presentation, suggesting investor concerns about margin compression and increased debt levels despite the substantial top-line growth.
As the market leader in Nordic wine markets with a 22.6% share, Viva Wine Group operates through two main segments: B2B (88% of business) and B2C (12%). The company's presentation revealed both the benefits and challenges of its recent expansion strategy, with the Delta Wines acquisition marking a significant milestone in its European growth ambitions.
Quarterly Performance Highlights
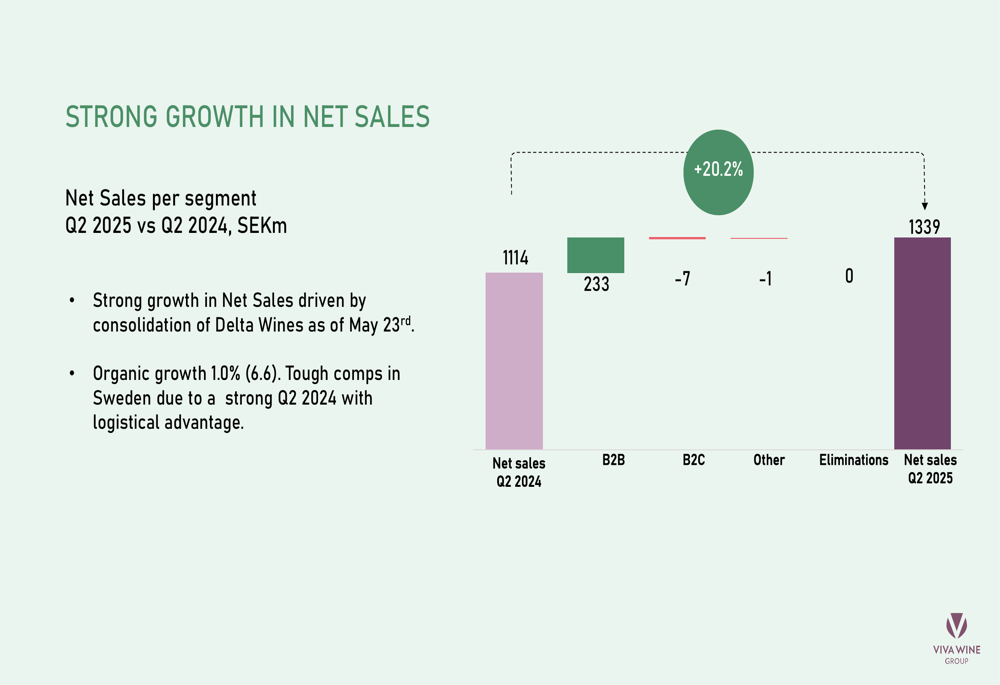
Viva Wine Group reported a 20.2% increase in net sales for Q2 2025, reaching 1,339 million SEK compared to 1,114 million SEK in Q2 2024. However, organic growth slowed to just 1.0%, down from 6.6% in the previous year. The company attributed this deceleration to challenging market conditions and tough comparisons with a strong Q2 2024 that benefited from logistical advantages in Sweden.
As shown in the following chart of quarterly revenue growth:
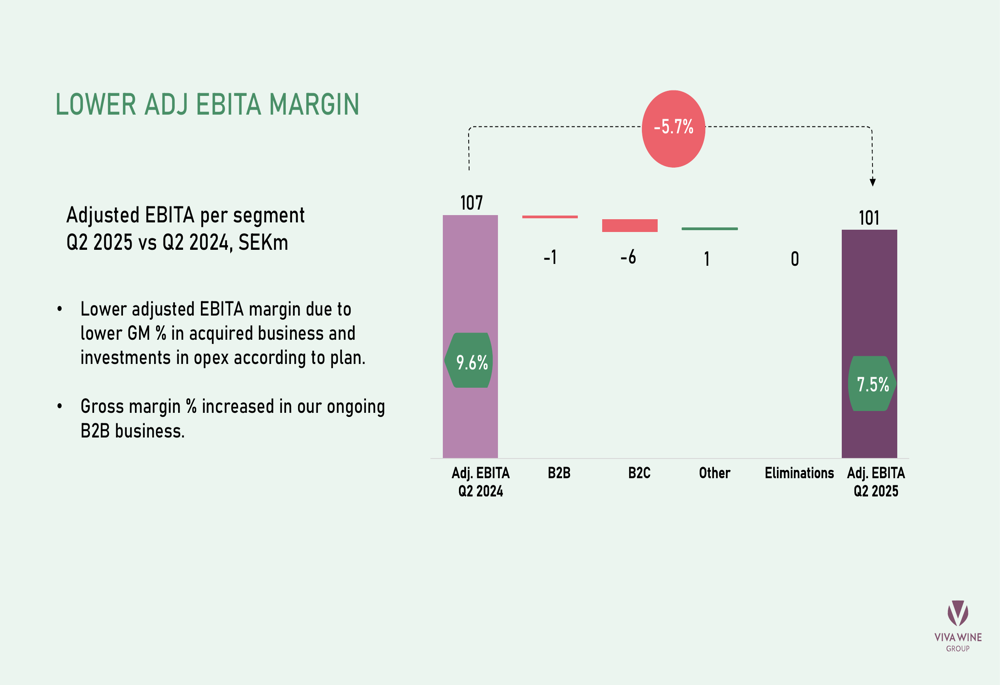
Despite the impressive top-line growth, the company's adjusted EBITA margin declined to 7.5% from 9.6% in the same period last year. This margin compression was primarily attributed to lower gross margins in the acquired Delta Wines business and planned operational investments.
The following chart illustrates the decline in adjusted EBITA margin:
Detailed Financial Analysis
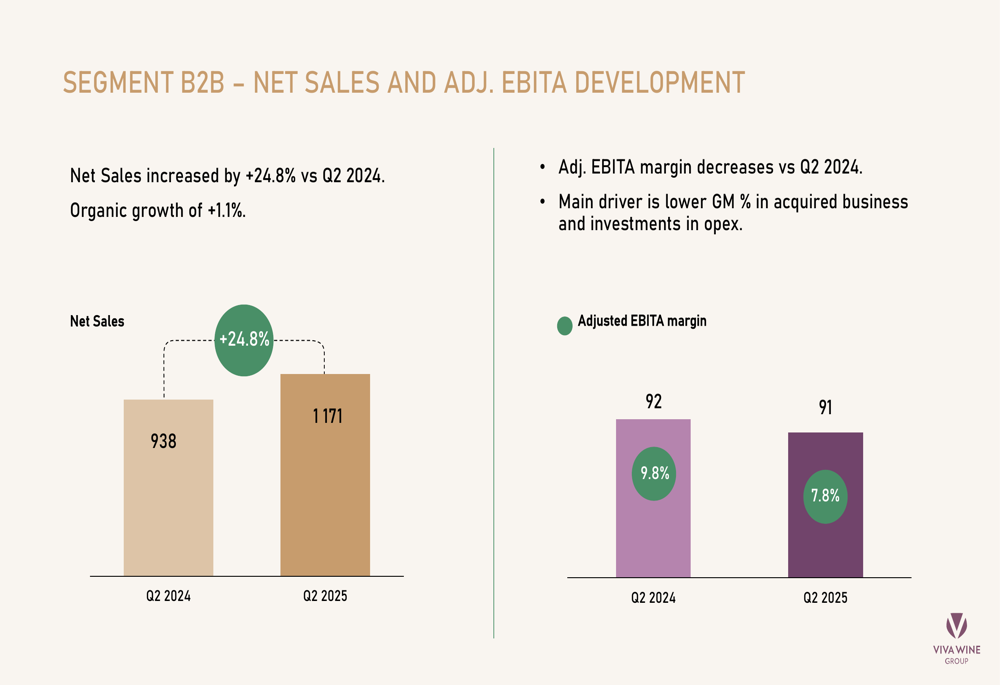
The B2B segment, which constitutes 88% of Viva Wine Group's business, saw net sales increase by 24.8% to 1,171 million SEK, though organic growth was limited to 1.1%. The segment's adjusted EBITA margin decreased from 9.8% to 7.8%, reflecting lower gross margins in the acquired business and increased operational expenses.
The segment performance is illustrated in this chart:
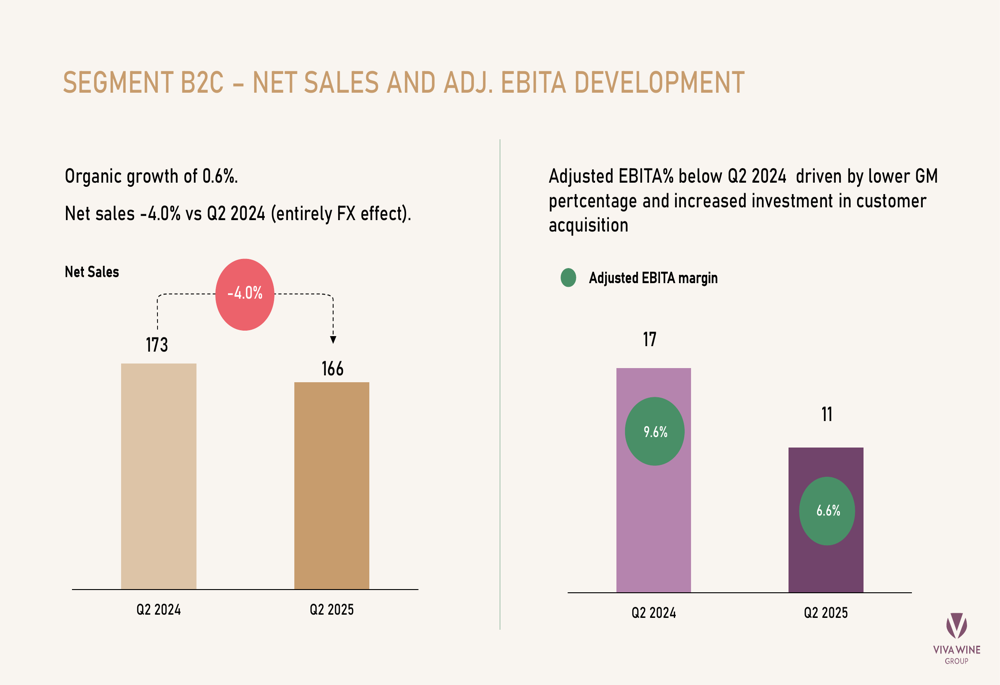
Meanwhile, the B2C segment experienced a 4.0% decline in net sales to 166 million SEK, which the company attributed entirely to foreign exchange effects. Organic growth in this segment was positive at 0.6%. The adjusted EBITA margin for B2C fell more significantly, from 9.6% to 6.6%.
The B2C segment results are shown here:
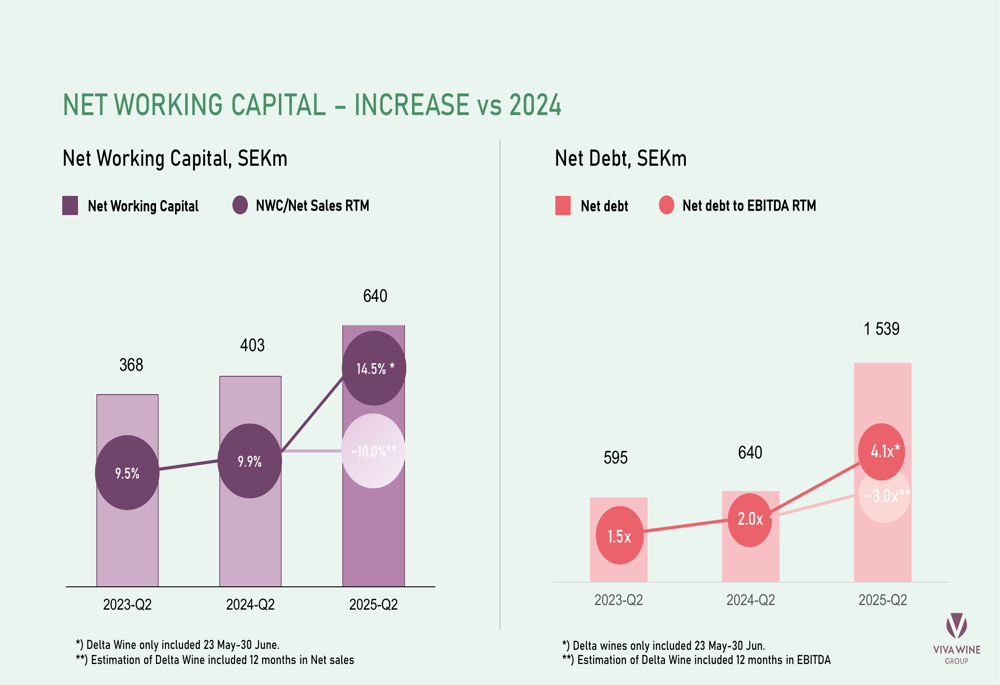
The acquisition strategy has significantly impacted Viva Wine Group's balance sheet. Net debt increased to 1,539 million SEK from 640 million SEK in Q2 2024, with the net debt to EBITDA ratio rising to 4.1x. The company noted that when accounting for a full 12 months of Delta Wines' contribution, this ratio would be approximately 3.0x.
The following chart shows the evolution of net working capital and net debt:
Cash flow analysis revealed that while operating activities generated 10 million SEK, the company paid 569 million SEK in dividends and invested significantly in acquisitions, necessitating 843 million SEK in new financing.
Strategic Initiatives
The acquisition of Delta Wines represents a cornerstone of Viva Wine Group's European expansion strategy. The company highlighted that the integration is proceeding according to plan, with positive reception from producers, customers, and employees.
The Delta Wines business overview is presented here:
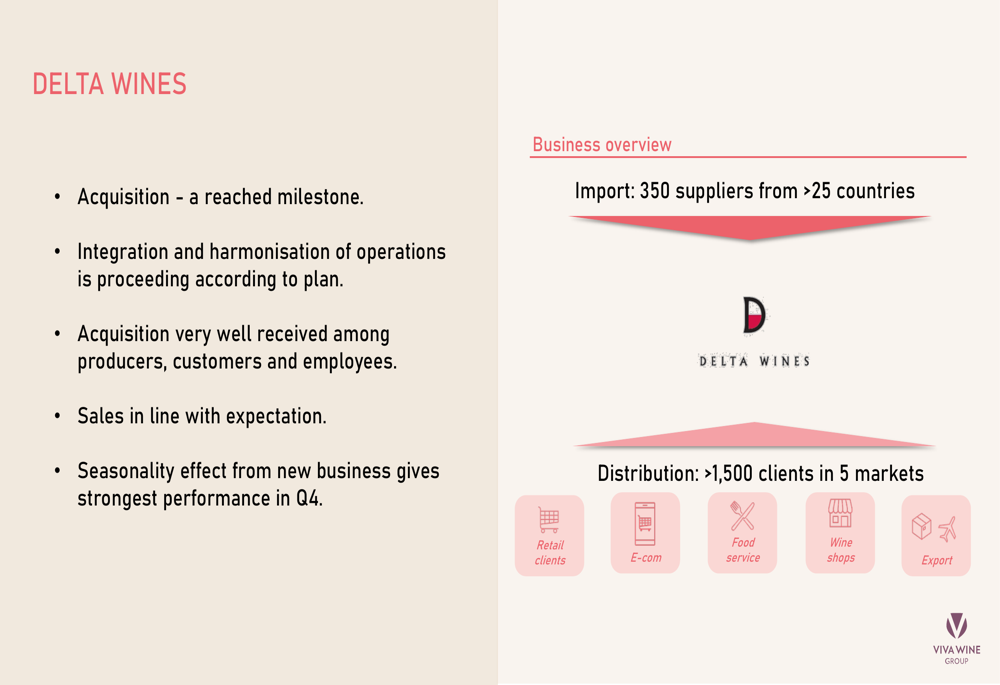
The acquisition significantly expands Viva's distribution network, adding over 1,500 clients across five markets and relationships with 350 suppliers from more than 25 countries. Management noted that Delta Wines exhibits strong seasonality, with its strongest performance expected in Q4.
In the Nordic monopoly markets, Viva Wine Group maintained its position as the clear market leader with a 22.6% share, despite a slight decrease from 22.9% in the previous year. The company noted that cold weather and cautious consumer sentiment negatively impacted the overall market, which declined by 1.5% in volume.
Forward-Looking Statements
Viva Wine Group's management expressed confidence in the company's strategic direction, emphasizing that the Delta Wines acquisition has increased its European footprint and created a strong foundation for future growth. The company also noted an increased deal flow for potential M&A opportunities, suggesting further acquisitions may be on the horizon.
On the sustainability front, Viva Wine Group published its Annual and Sustainability Report for 2024 during the spring, representing the first report consolidating sustainability data for the entire group. The company highlighted that 73% of its total volumes in 2024 were sold in low-climate-impact packaging, demonstrating its commitment to environmental responsibility.
The Q2 results represent a mixed picture for Viva Wine Group, with strong acquisition-led growth counterbalanced by margin pressure and increased debt levels. As the company continues to integrate Delta Wines and pursue its European expansion strategy, investors will be watching closely to see if it can maintain its market leadership while improving profitability metrics in the coming quarters.
Full presentation:
This article was generated with the support of AI and reviewed by an editor. For more information see our T&C.