5 big analyst AI moves: Apple lifted to Buy, AI chip bets reassessed

Introduction & Market Context
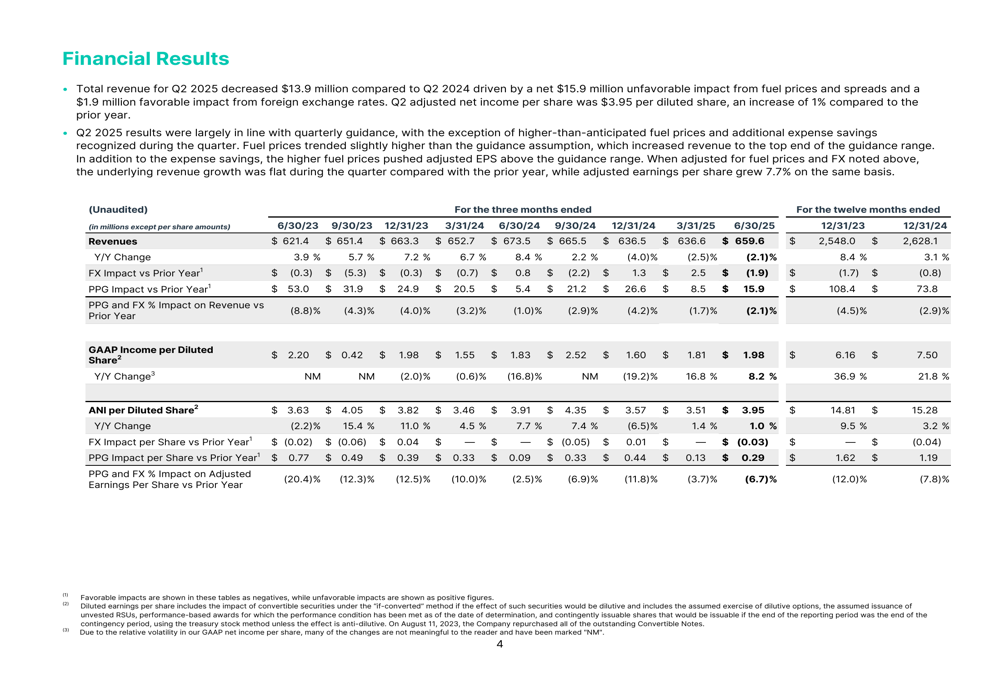
WEX Inc. (NYSE:WEX) released its second quarter 2025 supplemental presentation on July 23, 2025, revealing a mixed performance characterized by modest earnings growth despite revenue challenges. The payment solutions provider reported adjusted earnings per share (EPS) of $3.95, representing a 1% increase year-over-year, while total revenue declined by 2.1% to $659.6 million compared to the same period last year.
The market initially responded positively to the results, with WEX shares rising 1.7% to $150.6 following the announcement. However, premarket trading on October 14 showed a 1.39% decline to $148.5, suggesting ongoing investor uncertainty about the company’s growth trajectory.
Quarterly Performance Highlights
WEX’s Q2 2025 results demonstrated the company’s ability to maintain earnings growth despite top-line pressure. The revenue decline of $13.9 million year-over-year was primarily attributed to a $15.9 million unfavorable impact from fuel prices and spreads, partially offset by a $1.9 million favorable impact from foreign exchange rates.
As shown in the following financial results overview, when adjusting for these factors, underlying revenue growth was flat year-over-year, while adjusted EPS grew 7.7% on the same basis:
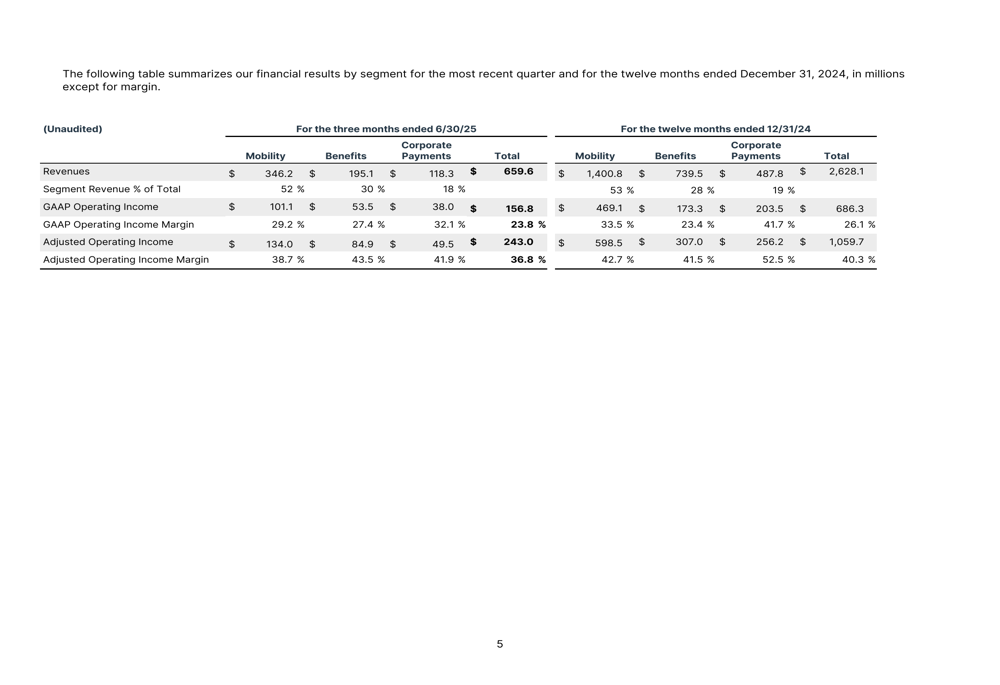
The company’s performance varied significantly across its three business segments. Benefits emerged as the growth driver, while both Mobility and Corporate Payments faced challenges. The segment breakdown reveals these divergent trends:
Segment Analysis
Mobility Segment
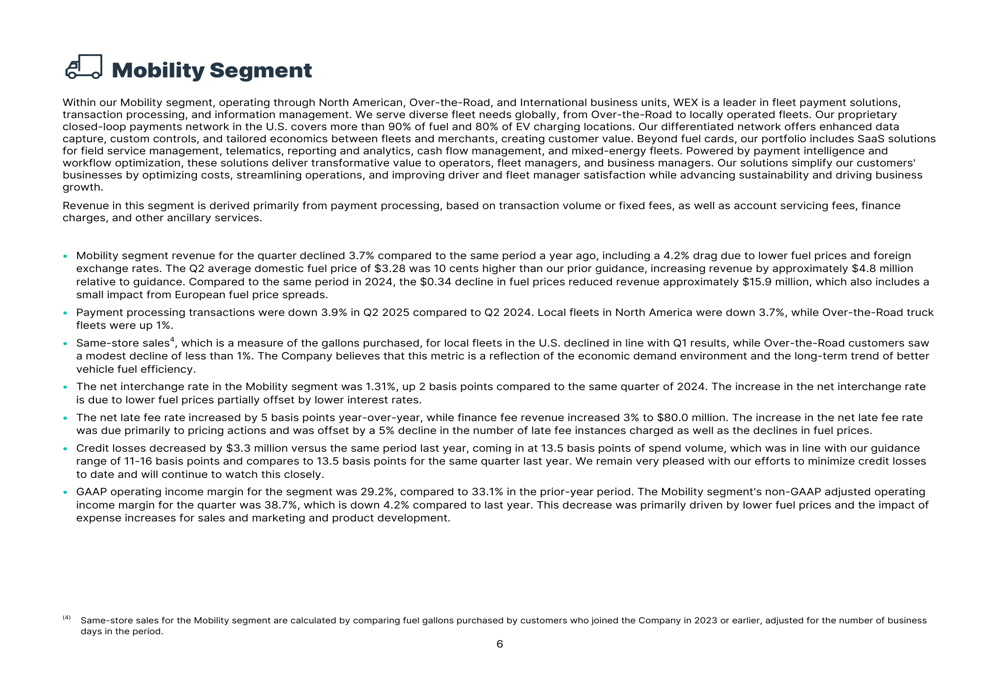
The Mobility segment, which represents 52% of total revenue, experienced a 3.7% revenue decline compared to Q2 2024, including a 4.2% drag due to lower fuel prices and foreign exchange rates. Payment processing transactions decreased by 3.9% year-over-year, reflecting ongoing challenges in fleet activity.
Despite these headwinds, the segment maintained a strong adjusted operating income margin of 38.7%, though this was down 4.2 percentage points from the prior year. Credit losses improved, decreasing by $3.3 million versus the same period last year and representing just 13.5 basis points of spend volume.
As highlighted in the Mobility segment overview, WEX maintains a strong market position with its proprietary closed-loop payments network covering more than 90% of fuel and 80% of EV charging locations in the U.S.:
Benefits Segment
The Benefits segment emerged as WEX’s growth engine in Q2 2025, with revenue increasing 8.5% year-over-year to $195.1 million. This growth was driven primarily by strong performance in the Health Savings Account (HSA) business, with HSA account growth of 7% and average SaaS accounts increasing 6.0% to 21.2 million.
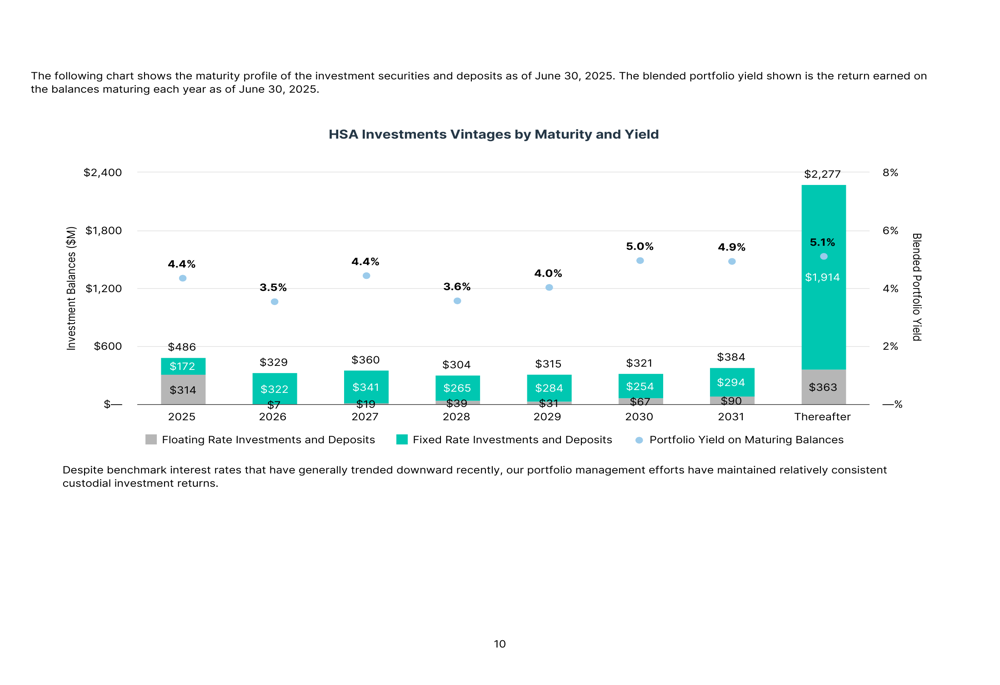
The segment’s adjusted operating income margin was impressive at 43.5%, demonstrating the scalability and profitability of this business line. Average custodial cash assets totaled $4.7 billion, an 11.2% increase compared to the prior year, generating $57.8 million in revenue.
The following chart illustrates the maturity profile and yield of WEX’s HSA investments, showing a well-structured portfolio with yields ranging from 3.5% to 5.1% across different maturity periods:
Corporate Payments Segment
The Corporate Payments segment faced the most significant challenges in Q2 2025, with revenue decreasing 11.8% to $118.3 million. This decline was primarily attributed to a revenue model change with a major online travel agency (OTA) customer. Total purchase volumes issued by WEX decreased 20.4% due to this transition.
Despite the revenue challenges, the segment maintained strong profitability with a GAAP operating income margin of 32.1% and an adjusted operating income margin of 41.9%. Management expressed confidence in a return to growth for this segment in the latter half of 2025.
Balance Sheet and Capital Allocation
WEX maintained a solid balance sheet with strategic capital allocation priorities. As of June 30, 2025, the company reported $659.6 million in cash and cash equivalents and $4.1 billion in long-term debt. The leverage ratio stood at 3.5x, at the higher end of the company’s target range.
The following chart provides a comprehensive view of WEX’s balance sheet metrics and debt maturity profile:
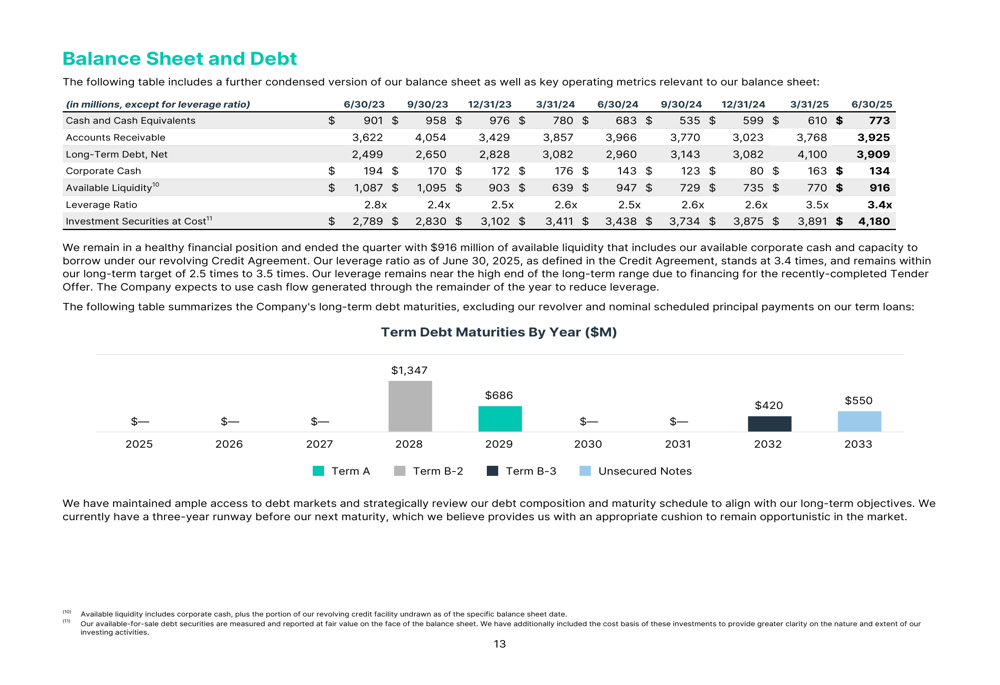
In a significant capital allocation move, WEX commenced a modified "Dutch auction" tender offer in February 2025 to repurchase up to $750.0 million worth of its common stock, demonstrating confidence in the company’s long-term prospects and commitment to returning value to shareholders.
The company generated strong cash flow, with adjusted free cash flow of $194 million in Q2 2025 and $570 million over the trailing twelve months, providing flexibility for strategic investments and capital returns.
Forward Guidance
WEX provided guidance for both Q3 and full-year 2025, projecting continued earnings growth despite modest revenue expectations. For Q3 2025, the company expects revenue between $669 million and $689 million, with adjusted EPS ranging from $4.30 to $4.50.
For the full year 2025, WEX forecasts revenue between $2.605 billion and $2.645 billion, with adjusted EPS between $15.37 and $15.77, as shown in the following guidance table:
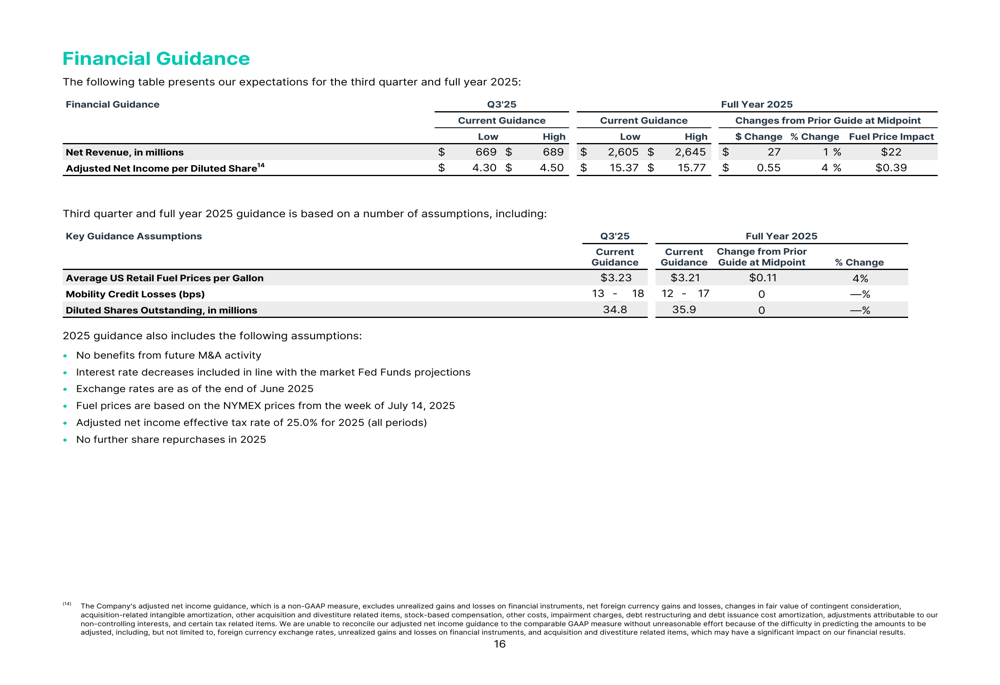
The company’s guidance includes several key assumptions, including average U.S. retail fuel prices of $3.23 per gallon, interest rate decreases in line with Federal Reserve projections, and an adjusted net income effective tax rate of 25%.
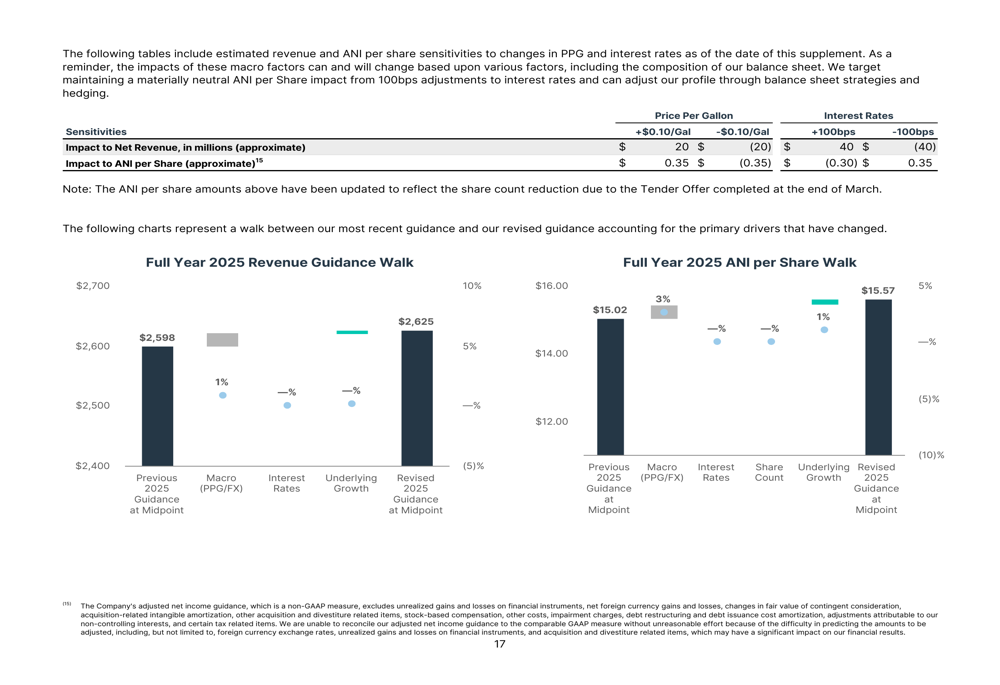
WEX also provided a sensitivity analysis showing the impact of macroeconomic factors on its financial results. Each $0.10 per gallon change in fuel prices affects annual revenue by approximately $20 million and adjusted EPS by $0.35, while a 100 basis point change in interest rates impacts annual revenue by approximately $40 million and adjusted EPS by $0.30-0.35:
Conclusion
WEX’s Q2 2025 results demonstrate the company’s resilience in maintaining earnings growth despite revenue challenges. The divergent performance across segments highlights both opportunities and challenges, with the Benefits segment showing strong momentum while Mobility and Corporate Payments face headwinds.
CEO Melissa Smith emphasized the company’s strong financial results, stating, "We delivered stronger financial results in the second quarter than anticipated," while highlighting WEX’s ability to win top-tier customers. With a solid balance sheet, strong cash flow generation, and strategic capital allocation, WEX appears well-positioned to navigate the current environment while investing in long-term growth opportunities.
As the company progresses through the remainder of 2025, investors will be closely watching for signs of recovery in the Mobility and Corporate Payments segments, continued growth in Benefits, and the impact of macroeconomic factors such as fuel prices and interest rates on overall performance.
Full presentation:
This article was generated with the support of AI and reviewed by an editor. For more information see our T&C.