Oil prices hold sharp losses with focus on secondary India tariffs

Introduction & Market Context
Woodward Inc (NASDAQ:WWD) released its second quarter fiscal year 2025 results on April 28, 2025, showing overall growth despite mixed segment performance. The company’s stock rose 3.89% in aftermarket trading to $188.50, reflecting positive investor sentiment toward the narrowed guidance and strong aerospace performance.
Chairman and CEO Chip Blankenship commented on the results: "Our strong second quarter results were in line with our expectations, reflecting the dedication of our members in a volatile environment. Our long-term value proposition remains intact, and we are committed to achieving sustainable growth and enhancing shareholder value."
Quarterly Performance Highlights
Woodward reported net sales of $884 million for Q2 FY25, representing a 6% increase compared to $835 million in the same period last year. Adjusted net earnings rose 3% to $103 million, while adjusted earnings per share increased 4% to $1.69.
As shown in the following consolidated results chart, the company’s reported net earnings and EPS actually outperformed the adjusted figures, coming in at $109 million and $1.78 respectively:
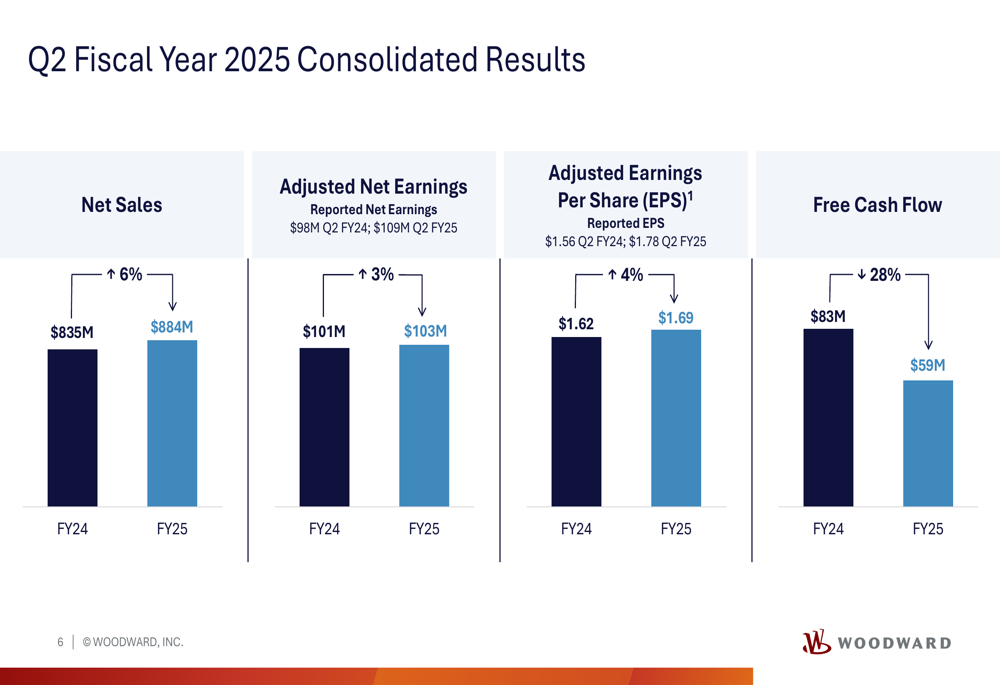
Free cash flow declined 28% to $59 million compared to $83 million in Q2 FY24, with cash from operations falling to $78 million from $97 million in the prior year period.
The company’s performance was driven by a clear divergence between segments, as illustrated in this sales and adjusted EPS bridge:
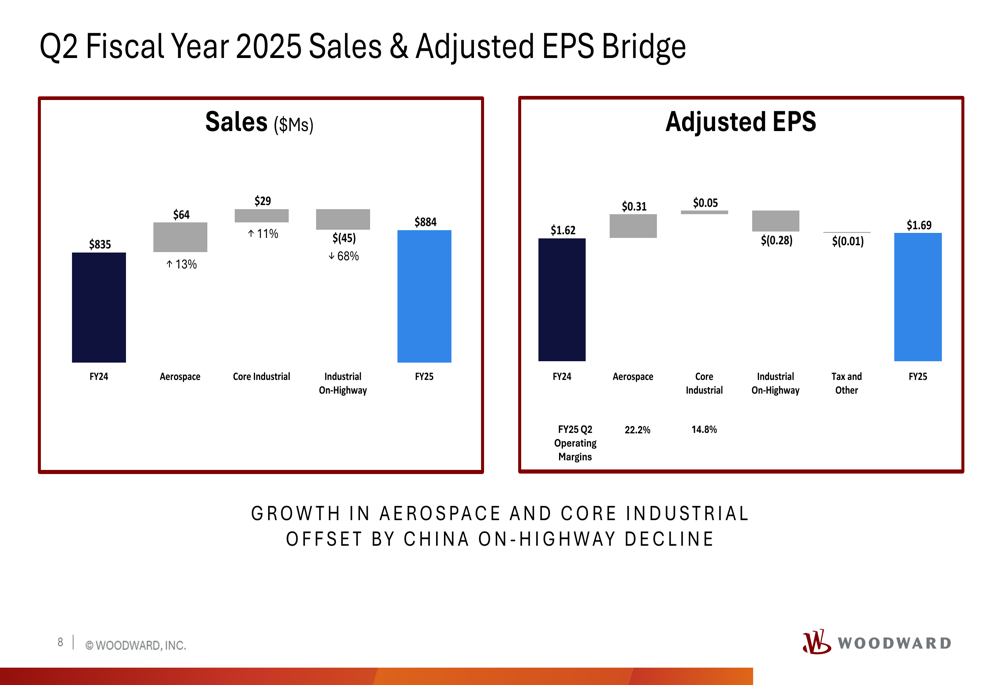
The chart demonstrates how growth in aerospace (+$64M) and core industrial (+$29M) was partially offset by a significant decline in industrial on-highway sales (-$45M), particularly in China. Similarly, the positive EPS contributions from aerospace (+$0.31) and core industrial (+$0.05) were partially negated by the industrial on-highway decline (-$0.28).
Aerospace Segment Analysis
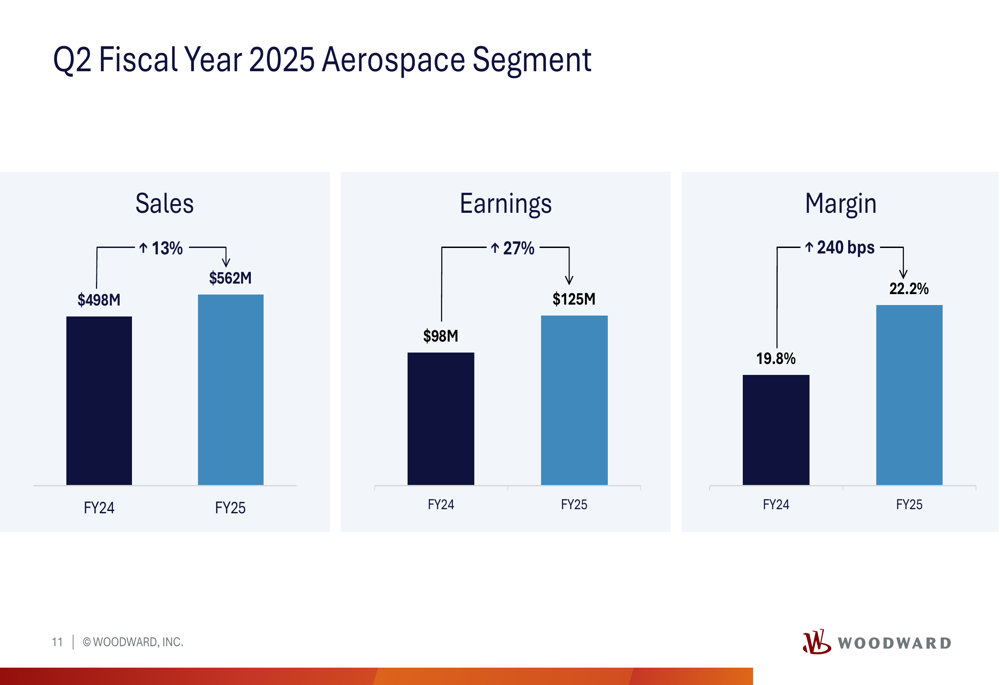
The aerospace segment delivered exceptional performance, with sales increasing 13% to $562 million and segment earnings growing 27% to $125 million. Margin expanded significantly, improving 240 basis points to 22.2%.
The following chart illustrates the aerospace segment’s strong performance metrics:
Within the aerospace segment, performance varied by market. Commercial aftermarket sales grew impressively at 23%, driven by high legacy aircraft utilization and growing passenger traffic, though the company noted concerns about soft forward bookings. Commercial OEM sales declined 9%, despite improving OEM build rates, as industry supply chain challenges persisted.
Defense markets showed even greater divergence, with defense OEM sales surging 52% due to strong demand for defense products and robust smart defense order activity. Meanwhile, defense aftermarket sales declined 8%, despite a large growing installed base with steady utilization.
Industrial Segment Analysis
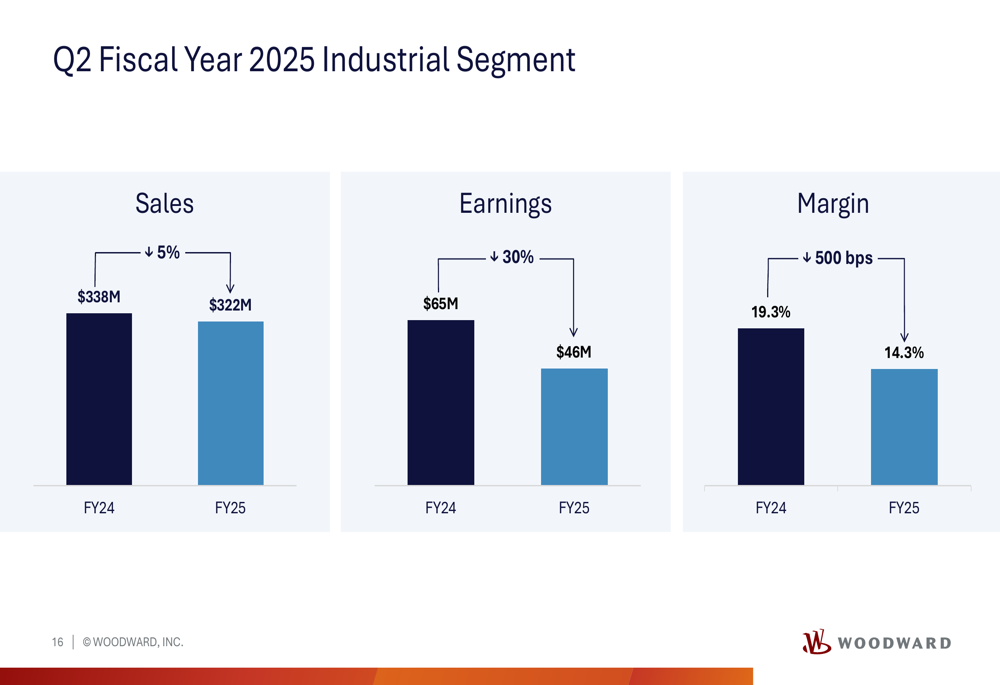
The industrial segment presented a more challenging picture, with overall sales declining 5% to $322 million and segment earnings dropping 30% to $46 million. Margin contracted significantly, falling 500 basis points to 14.3%.
The following chart details the industrial segment’s performance:
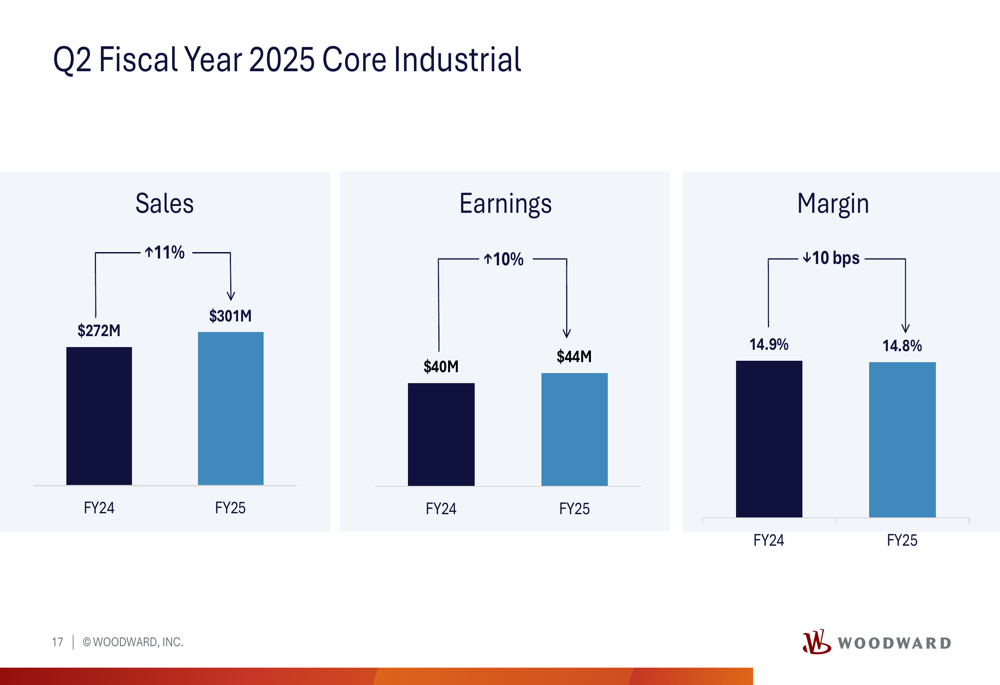
However, when excluding the China on-highway business, Woodward’s core industrial performance was much stronger, with sales increasing 11% to $301 million and earnings growing 10% to $44 million, maintaining a solid 14.8% margin:
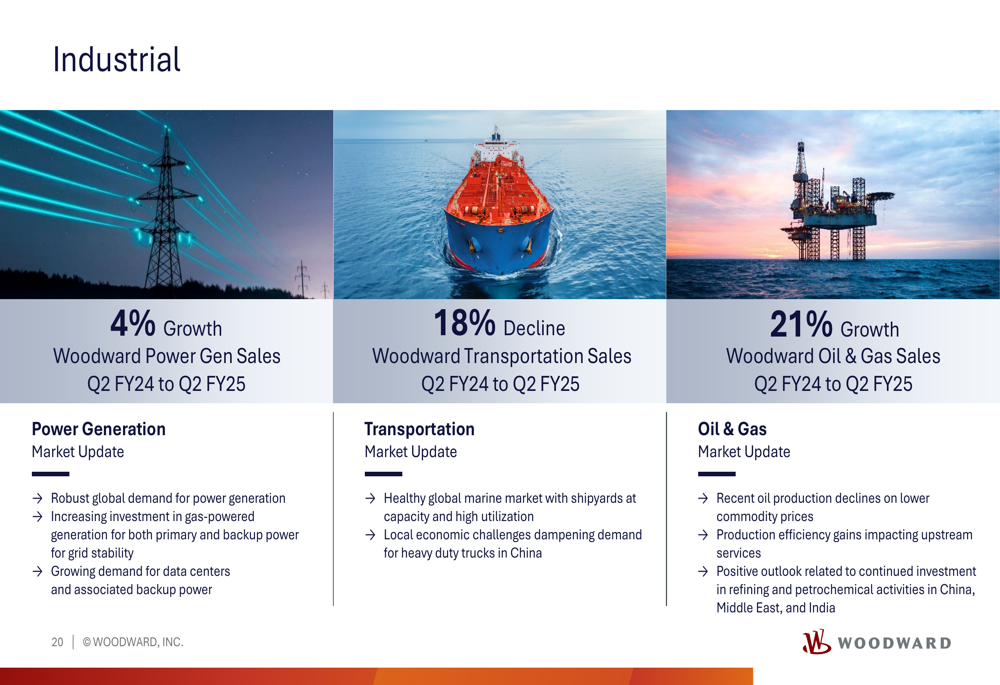
The industrial market showed varied performance across subsegments. Power generation sales grew 4%, supported by robust global demand, increasing investment in gas-powered generation, and growing demand for data centers. Oil & gas sales increased 21%, despite recent oil production declines, with a positive outlook for refining and petrochemical activities. Transportation sales declined 18%, reflecting local economic challenges dampening demand for heavy-duty trucks in China, though the global marine market remained healthy.
The following chart provides a detailed breakdown of the industrial market performance:
Revised Guidance and Outlook
Based on the Q2 results, Woodward narrowed its fiscal year 2025 guidance, raising the lower end of both sales and EPS projections. The company now expects total sales between $3,375 million and $3,500 million, compared to the previous range of $3,300 million to $3,500 million. Adjusted EPS guidance was narrowed to $5.95-$6.25 from the previous $5.85-$6.25.
The following chart details the revised guidance across key metrics:
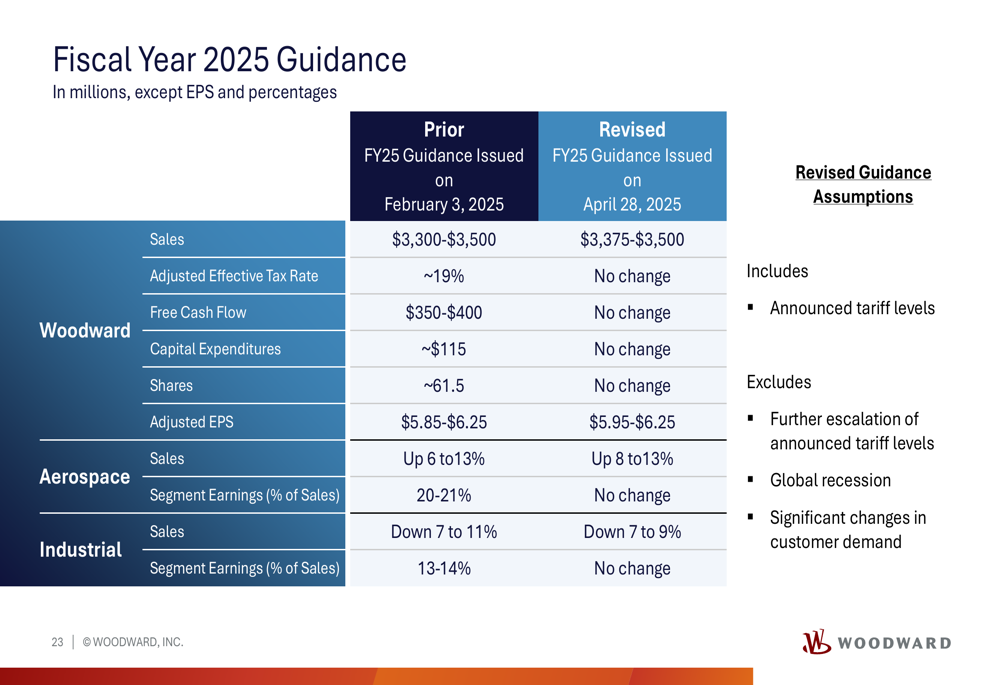
Notably, aerospace sales are now expected to grow between 8% and 13%, an improvement from the previous guidance of 6% to 13%. Industrial sales are projected to decline between 7% and 9%, a narrower range than the previously expected 7% to 11% decline.
The guidance revision reflects increased confidence in the company’s outlook despite ongoing challenges in certain markets. The guidance assumptions include announced tariff levels but exclude further escalation of tariffs, global recession, or significant changes in customer demand.
Strategic Positioning
Woodward continues to focus on its four value driver pillars: Growth, Operational Excellence, Innovation, and Capital Allocation. During the first half of fiscal 2025, the company allocated $52 million to capital expenditures and returned $111 million to shareholders through dividends and share repurchases.
This performance follows Woodward’s record-breaking fiscal year 2024, when the company exceeded $3 billion in annual revenue for the first time. The current results demonstrate Woodward’s ability to leverage its strong aerospace business while managing challenges in the industrial segment, particularly the significant decline in the China on-highway market.
As global aerospace demand remains robust and industrial markets show mixed signals, Woodward appears well-positioned to navigate the varied market conditions through the remainder of fiscal year 2025, with its diversified business model providing resilience against sector-specific challenges.
Full presentation:
This article was generated with the support of AI and reviewed by an editor. For more information see our T&C.