Nvidia among investors in xAI’s $20 bln capital raise- Bloomberg

Introduction & Market Context
WSFS Financial Corporation (NASDAQ:WSFS) reported strong first-quarter 2025 results, with core earnings per share of $1.13 exceeding analyst expectations of $1.04. The company’s performance was driven by net interest margin expansion and year-over-year fee revenue growth, despite facing some credit quality challenges.
The financial institution, which closed at $51.97 on May 1, 2025, delivered a core return on assets (ROA) of 1.29% and a core return on tangible common equity (ROTCE) of 16.97% for the quarter. These results came amid a cautious economic environment where clients remain hesitant about expansion.
Quarterly Performance Highlights
WSFS reported core net income of $66.1 million for Q1 2025, with core pre-provision net revenue (PPNR) of $104.6 million, representing an 11% increase quarter-over-quarter. The company’s efficiency ratio improved to 59.0% on a core basis.
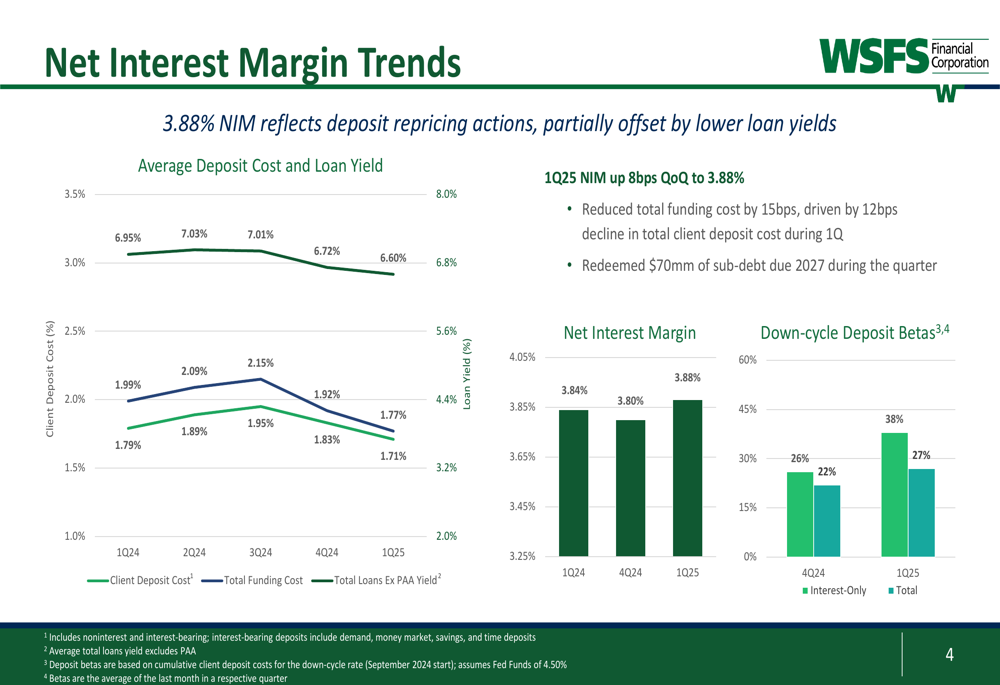
A key driver of performance was the expansion in net interest margin (NIM), which increased by 8 basis points quarter-over-quarter to 3.88%. This improvement was primarily attributed to deposit repricing actions, as client deposit costs decreased by 12 basis points to 1.71% during the quarter.
As shown in the following chart of NIM trends and deposit/loan yields:
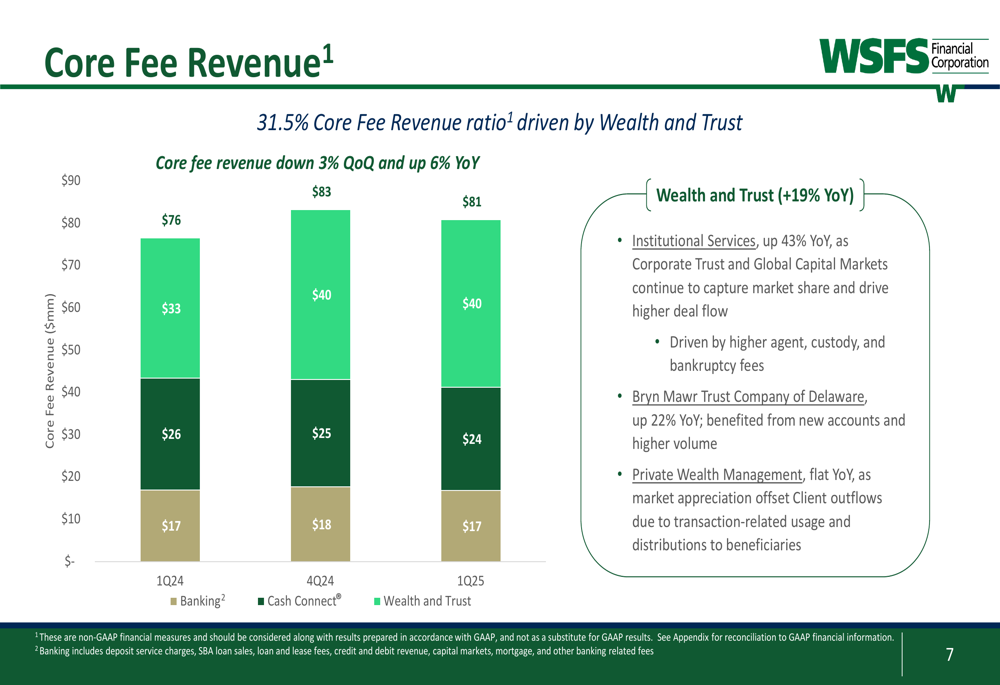
Core fee revenue reached $80.9 million, representing 31.5% of total revenue. While this was down 3% quarter-over-quarter, it showed a healthy 6% increase year-over-year. The Wealth and Trust segment was particularly strong, with 19% year-over-year growth, driven by a 43% increase in Institutional Services and a 22% rise in Bryn Mawr Trust Company of Delaware.
The following chart illustrates the core fee revenue breakdown:
Capital and Liquidity Position
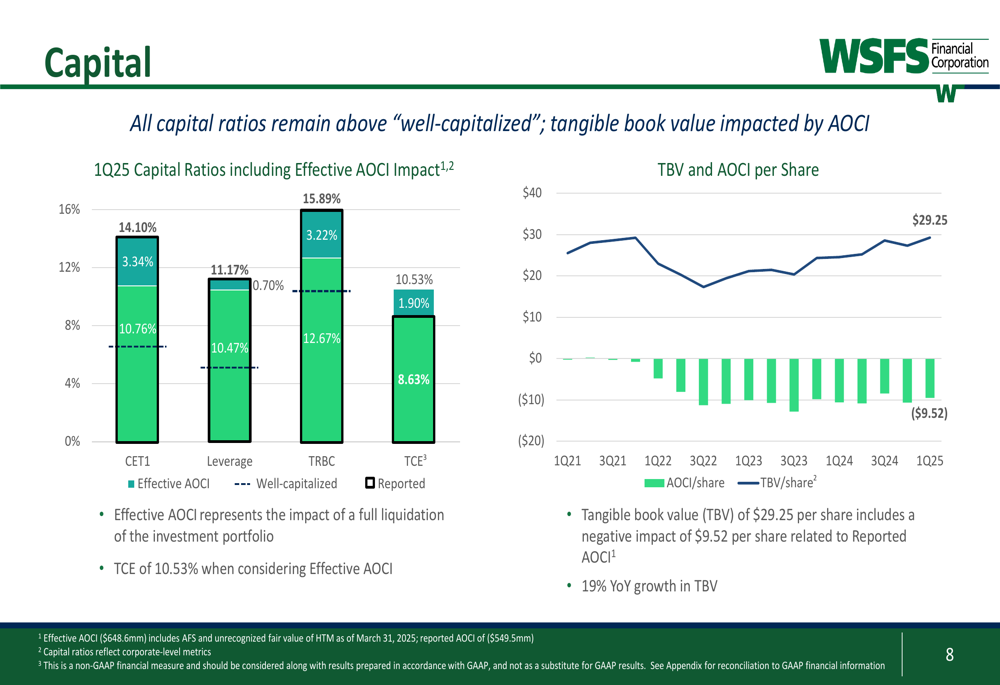
WSFS maintained strong capital ratios, with Common Equity Tier 1 (CET1) at 14.10%, well above regulatory requirements. The company’s tangible book value reached $29.25 per share, representing 19% year-over-year growth, despite a negative impact of $9.52 per share related to accumulated other comprehensive income (AOCI).
The following chart shows the company’s capital ratios and tangible book value:
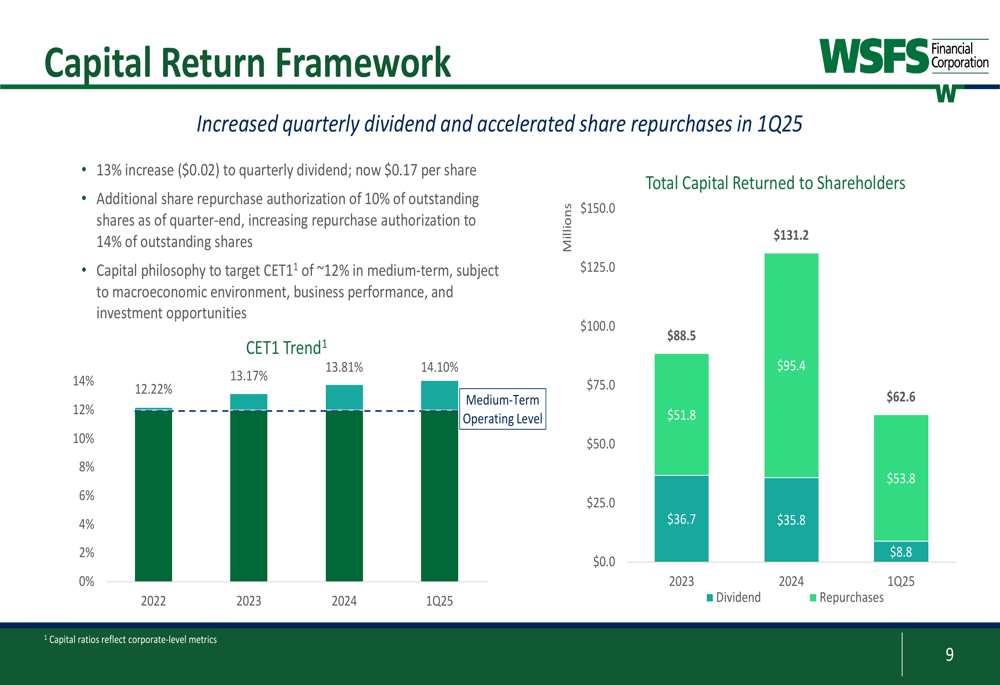
The company returned $62.6 million to shareholders during the quarter, with $53.8 million through share repurchases. Additionally, the Board approved an additional share repurchase authorization of 5.8 million shares, representing 10% of outstanding shares, and increased the quarterly dividend by 13% to $0.17 per share.
WSFS outlined its capital return framework as follows:
Credit Quality and Loan Portfolio
Total (EPA:TTEF) gross loans stood at $13.16 billion as of March 31, 2025, a slight decrease from $13.24 billion at the end of the previous quarter. Commercial loans remained flat, which the company attributed to economic uncertainty and muted originations.
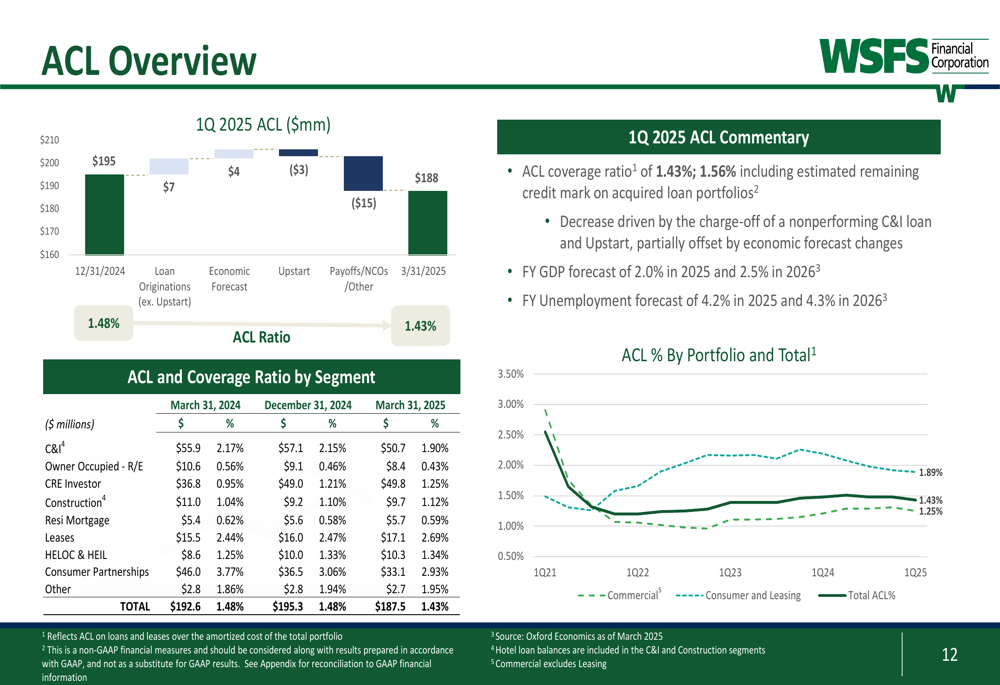
The allowance for credit losses (ACL) ratio was 1.43%, or 1.56% when including the estimated remaining credit mark on acquired loan portfolios. The decrease in the ACL ratio was primarily driven by the charge-off of a nonperforming C&I loan and Upstart (NASDAQ:UPST) portfolio losses, partially offset by economic forecast changes.
The following chart provides an overview of the ACL:
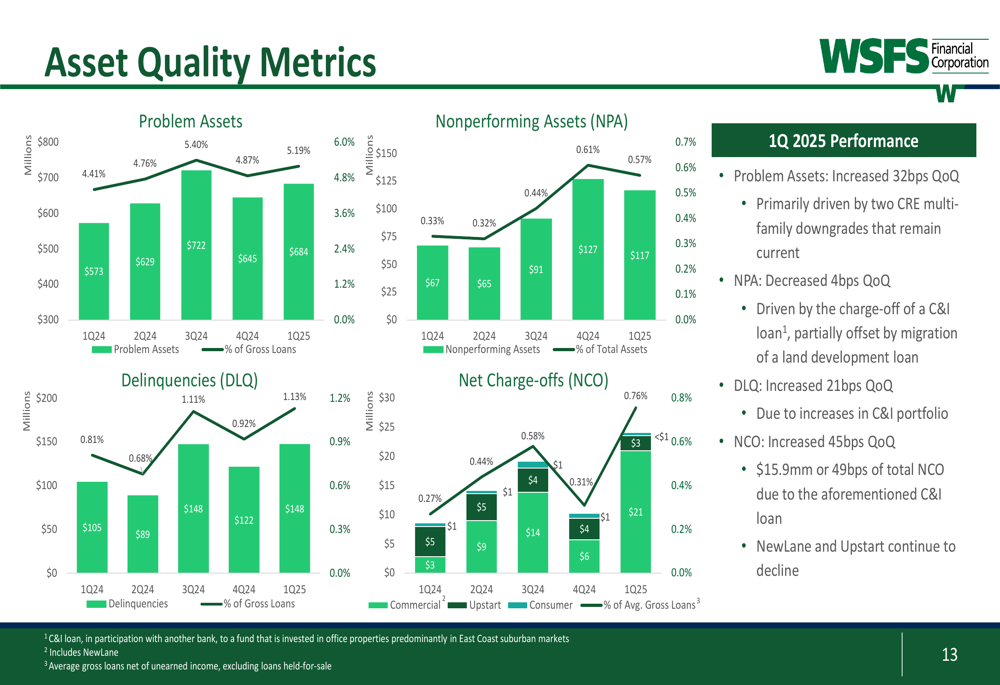
Asset quality metrics showed some deterioration, with problem assets increasing by 32 basis points quarter-over-quarter, primarily due to two CRE multi-family downgrades that remain current. Net charge-offs increased by 45 basis points quarter-over-quarter, with $15.9 million (or 49 basis points) attributed to a specific C&I loan.
The following chart illustrates the asset quality metrics:
Strategic Initiatives and Outlook
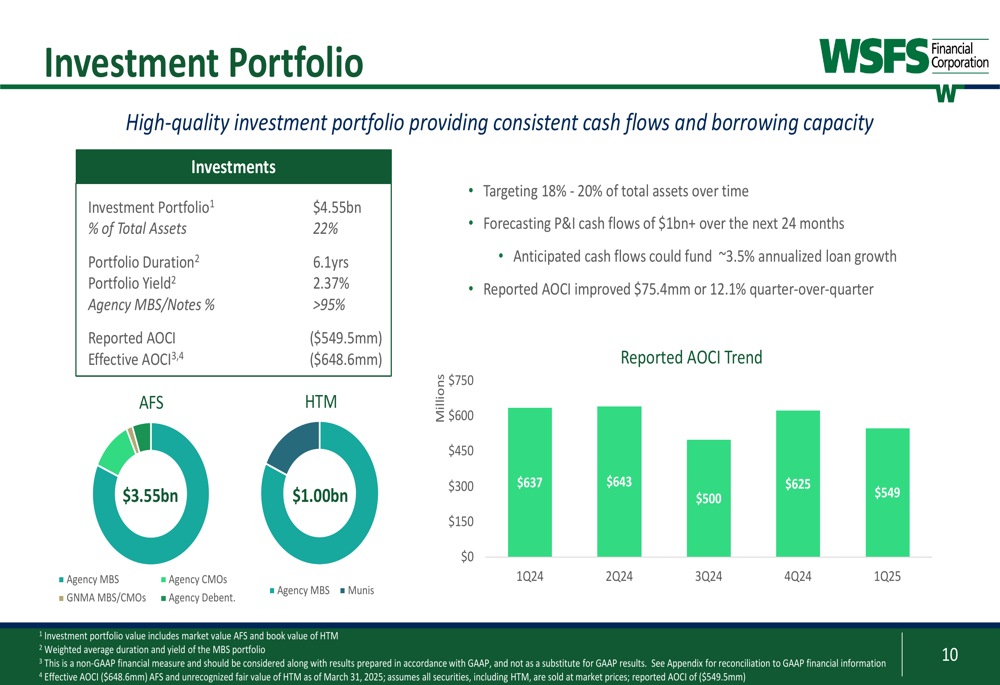
WSFS maintains a high-quality investment portfolio of $4.55 billion, representing 22% of total assets. The portfolio is predominantly composed of Agency MBS/Notes (>95%) and provides consistent cash flows and borrowing capacity. The company is targeting an investment portfolio of 18-20% of total assets over time and forecasts principal and interest cash flows of over $1 billion in the next 24 months.
The investment portfolio details are shown here:
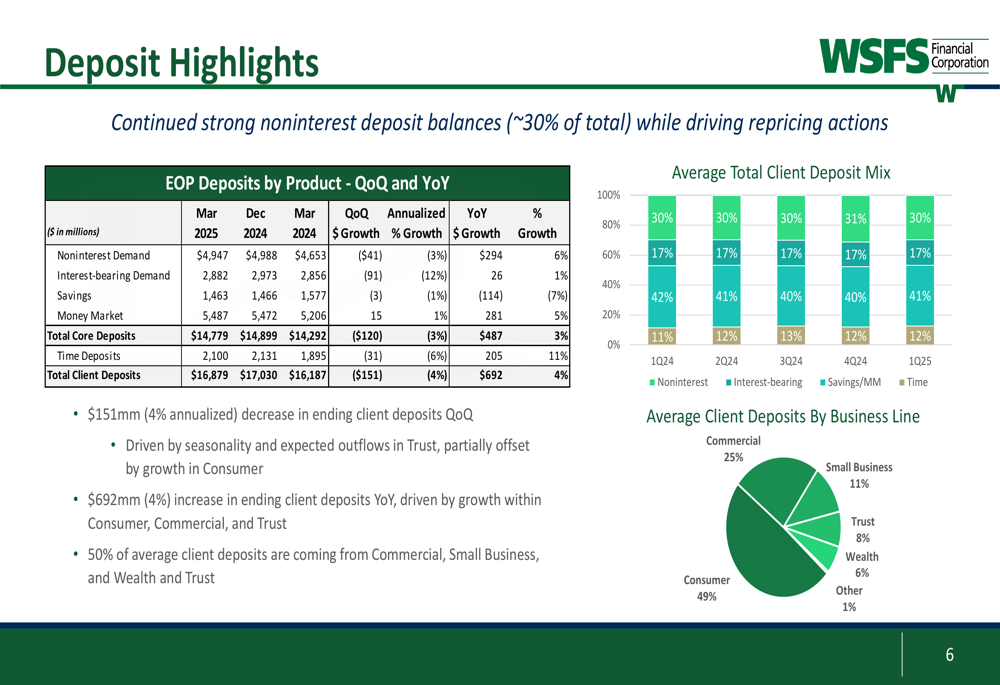
In terms of deposits, WSFS reported $16.88 billion in total client deposits as of March 31, 2025, a 4% annualized decrease quarter-over-quarter but a 4% increase year-over-year. The company maintains strong noninterest deposit balances, which represent approximately 30% of total deposits.
The deposit breakdown is illustrated in the following chart:
WSFS is targeting a CET1 ratio of approximately 12% in the medium term, subject to the macroeconomic environment, business performance, and investment opportunities. This strategic capital target will guide the company’s future capital allocation decisions between growth investments and shareholder returns.
Despite some credit quality challenges, WSFS’s strong capital position, expanding net interest margin, and growing fee revenue streams position the company well for continued performance in the current economic environment.
Full presentation:
This article was generated with the support of AI and reviewed by an editor. For more information see our T&C.