Procore signs multi-year strategic collaboration agreement with AWS

Introduction & Market Context
WSP Global Inc (TSX:WSP) released its Q1 2025 financial results on May 7, 2025, showcasing robust performance with significant growth across all key financial metrics. The engineering and design services firm continued its strong momentum from previous quarters, with substantial revenue increases and a record backlog pointing to sustained future growth.
The company’s performance reflects its successful positioning across diverse end markets supported by secular trends, including infrastructure development, environmental services, and energy transition projects. WSP’s shares closed at $250.30 on the reporting day, up 1.91% or $4.79.
Quarterly Performance Highlights
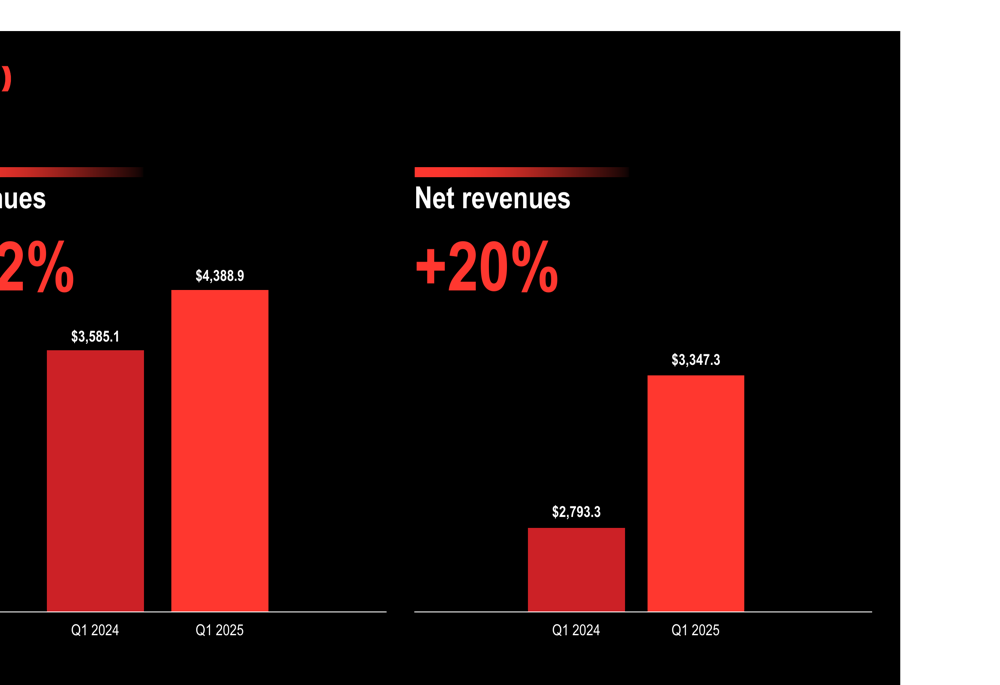
WSP reported impressive year-over-year growth in Q1 2025, with revenues reaching $4.39 billion, a 22.4% increase compared to Q1 2024. Net revenues grew by 19.8% to $3.35 billion, while adjusted EBITDA rose 19.7% to $533.9 million.
The company’s organic growth in net revenues was 3.7%, or 5.5% when normalized for fewer billable days in the US market. This organic growth, combined with the effects of acquisitions, contributed to the overall revenue expansion.
As shown in the following financial highlights chart:
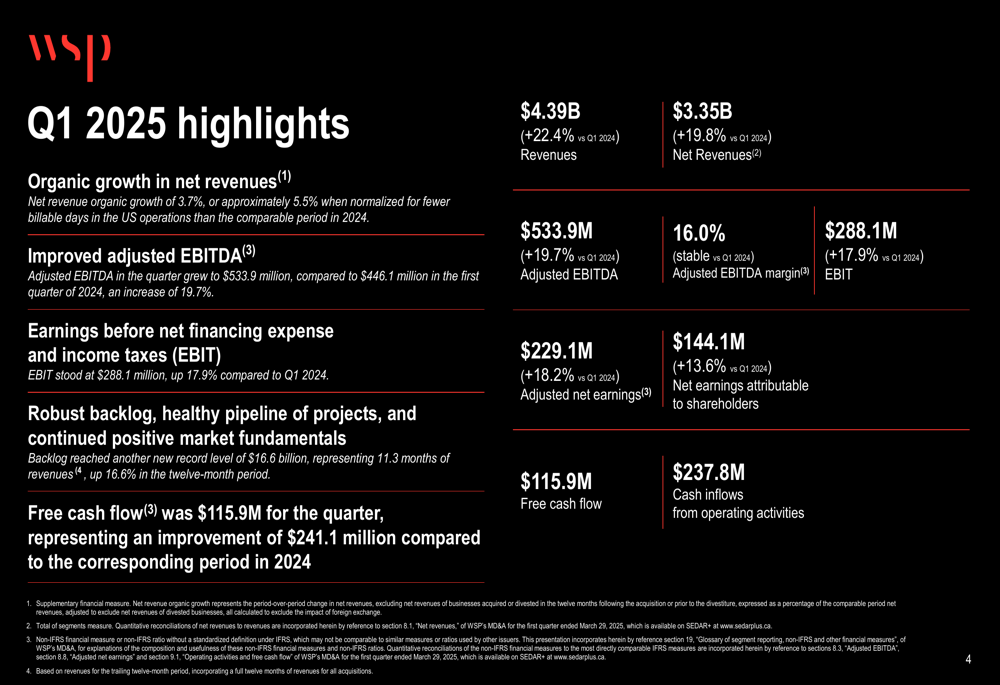
Particularly noteworthy is WSP’s record backlog of $16.6 billion, representing 11.3 months of revenues and a 16.6% increase compared to the previous year. This substantial backlog provides strong visibility for future revenue streams and indicates continued client confidence in WSP’s service offerings.
The company also demonstrated significant improvement in cash management, with free cash flow of $115.9 million, marking a $241.1 million improvement from the corresponding period in 2024.
Detailed Financial Analysis
WSP’s revenue growth trajectory remained strong in Q1 2025, continuing the positive trend from previous quarters. The following chart illustrates the substantial year-over-year increase in both revenues and net revenues:
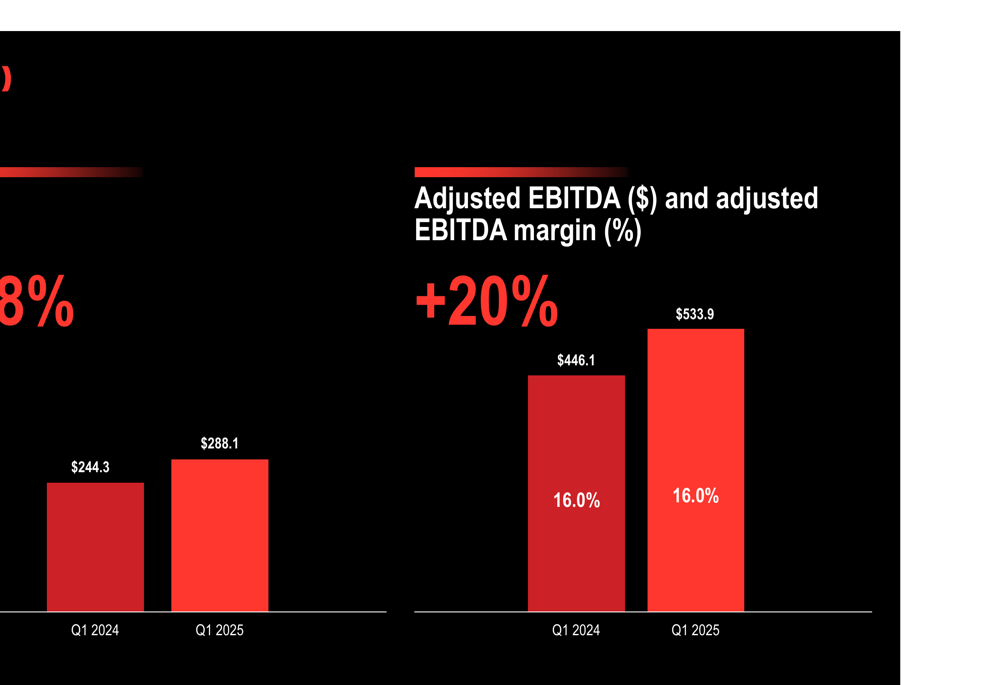
Profitability metrics also showed robust performance. Adjusted EBITDA increased by 19.7% to $533.9 million, while maintaining a stable adjusted EBITDA margin of 16.0%. This indicates that WSP has been able to grow its business while preserving its operational efficiency.
The company’s profitability metrics are illustrated in the following chart:
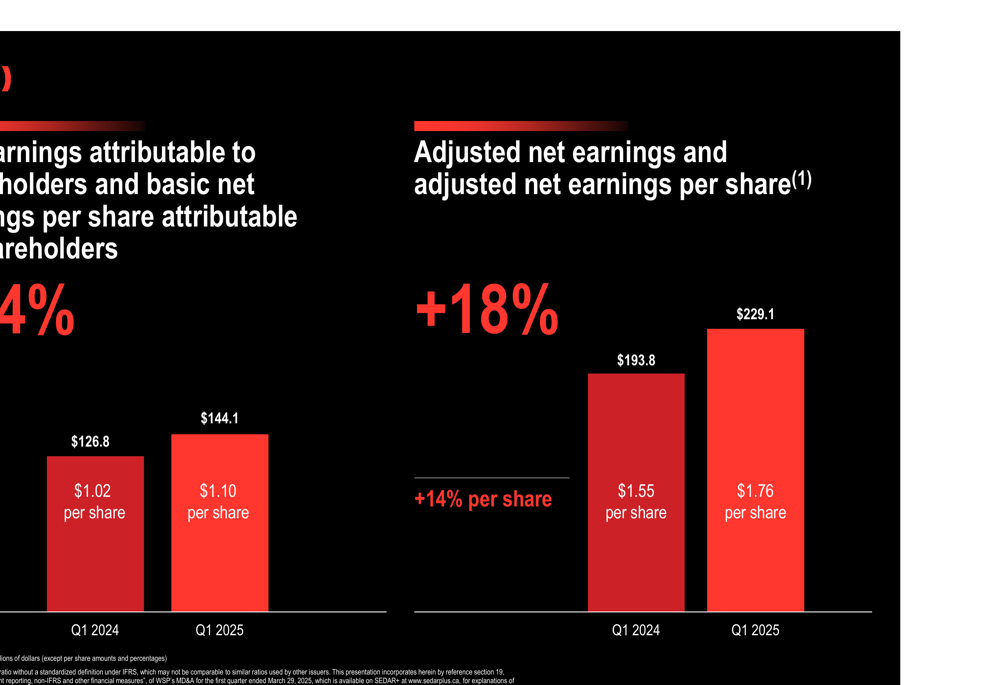
Earnings attributable to shareholders grew by 13.6% to $144.1 million, with earnings per share increasing from $1.02 to $1.10. Adjusted net earnings rose by 18.2% to $229.1 million, with adjusted earnings per share reaching $1.76, up from $1.55 in Q1 2024.
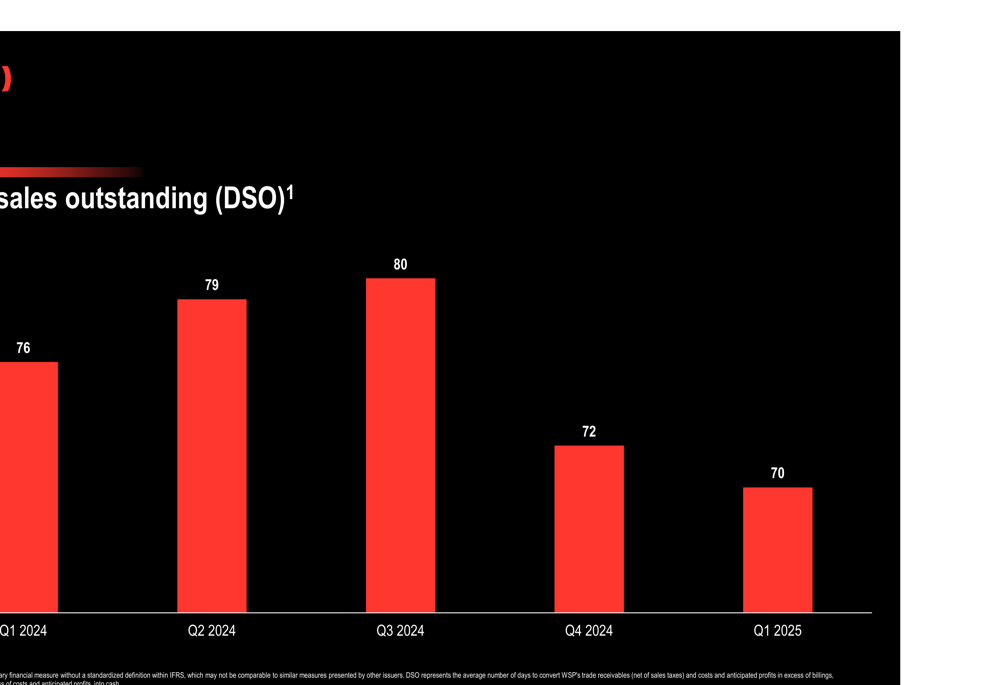
WSP has also made progress in improving its working capital management, as evidenced by the reduction in days sales outstanding (DSO) from 76 days in Q1 2024 to 70 days in Q1 2025. This improvement in DSO has contributed to the enhanced cash flow performance.
Segment Performance
WSP’s performance was strong across all geographic segments, with each region contributing to the overall growth. The company maintains a diverse portfolio across four main sectors: Transport & Infrastructure, Property & Buildings, Earth & Environment, and Power & Energy.
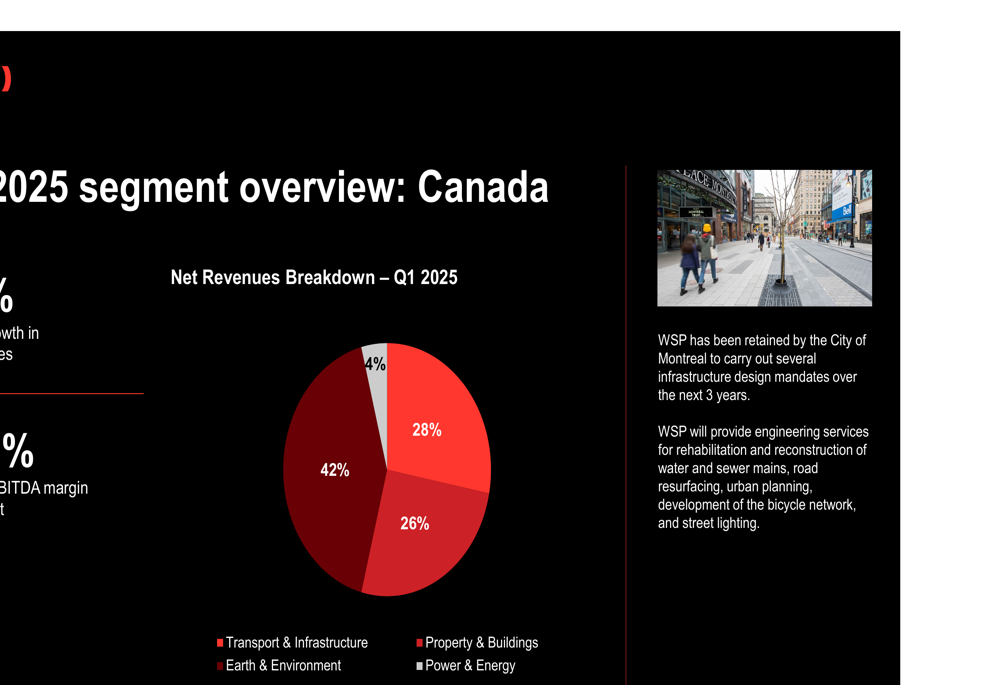
In Canada, Transport & Infrastructure represented 42% of net revenues, followed by Property & Buildings at 28%, Earth & Environment at 26%, and Power & Energy at 4%. Notable projects included infrastructure design mandates for the City of Montreal covering water and sewer mains, road resurfacing, urban planning, and bicycle network development.
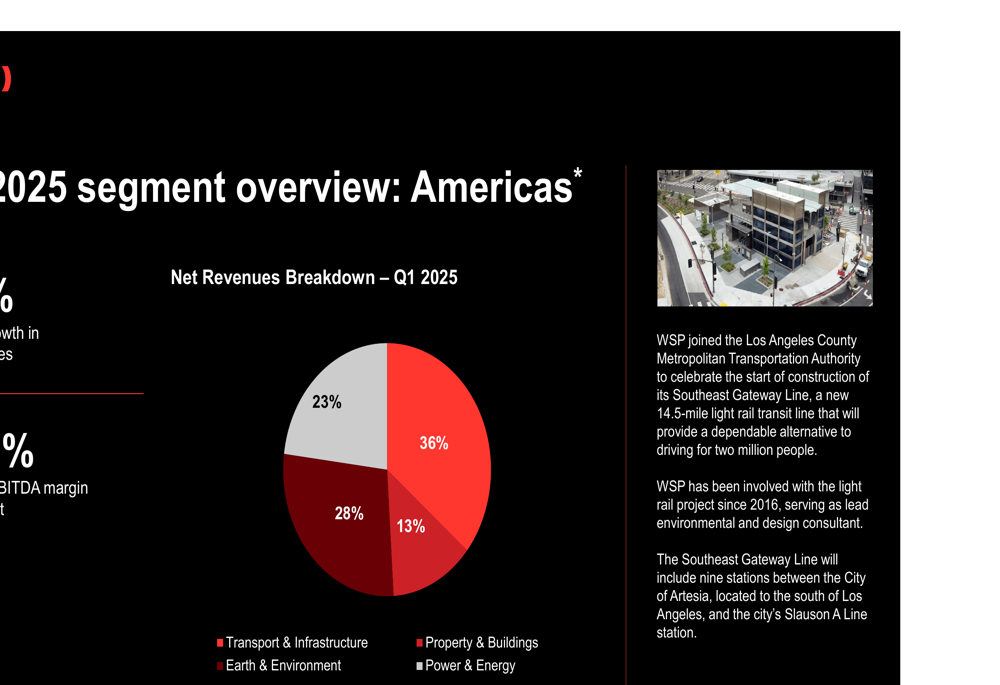
The Americas segment showed a different distribution, with Property & Buildings accounting for 36% of net revenues, Transport & Infrastructure at 28%, Earth & Environment at 23%, and Power & Energy at 13%. A significant project highlighted was WSP’s involvement in the Los Angeles County Metropolitan Transportation Authority’s Southeast Gateway Line, where the company has served as lead environmental and design consultant since 2016.
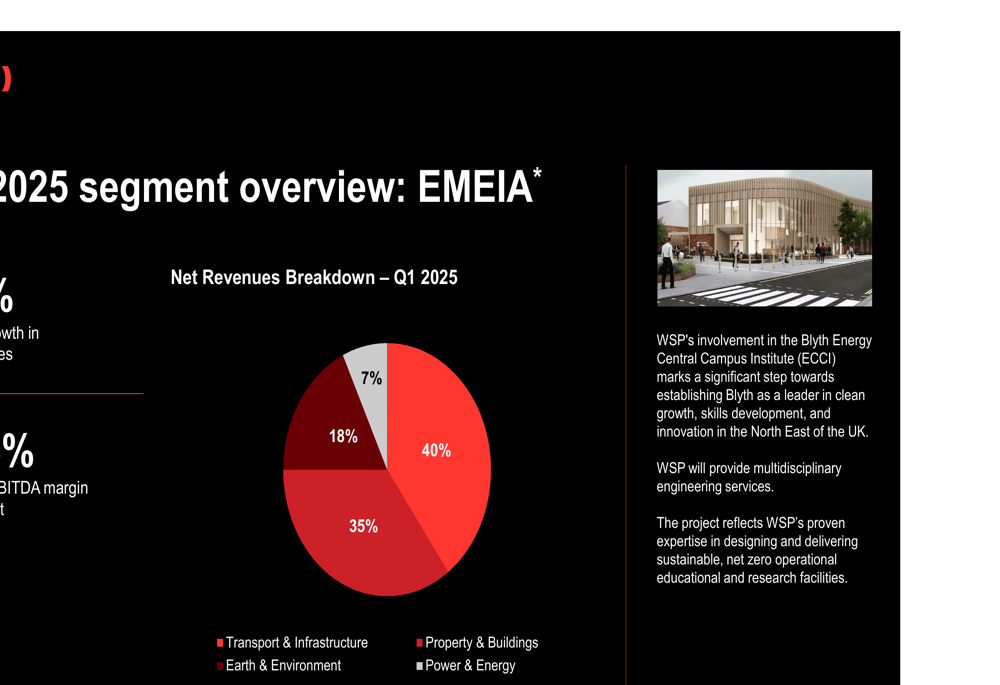
In the EMEA (Europe, Middle East, and Africa) region, Property & Buildings dominated with 40% of net revenues, followed by Transport & Infrastructure at 35%, Earth & Environment at 18%, and Power & Energy at 7%. The company showcased its involvement in the Blyth Energy Central Campus Institute in the UK, positioning Blyth as a leader in clean growth and innovation.
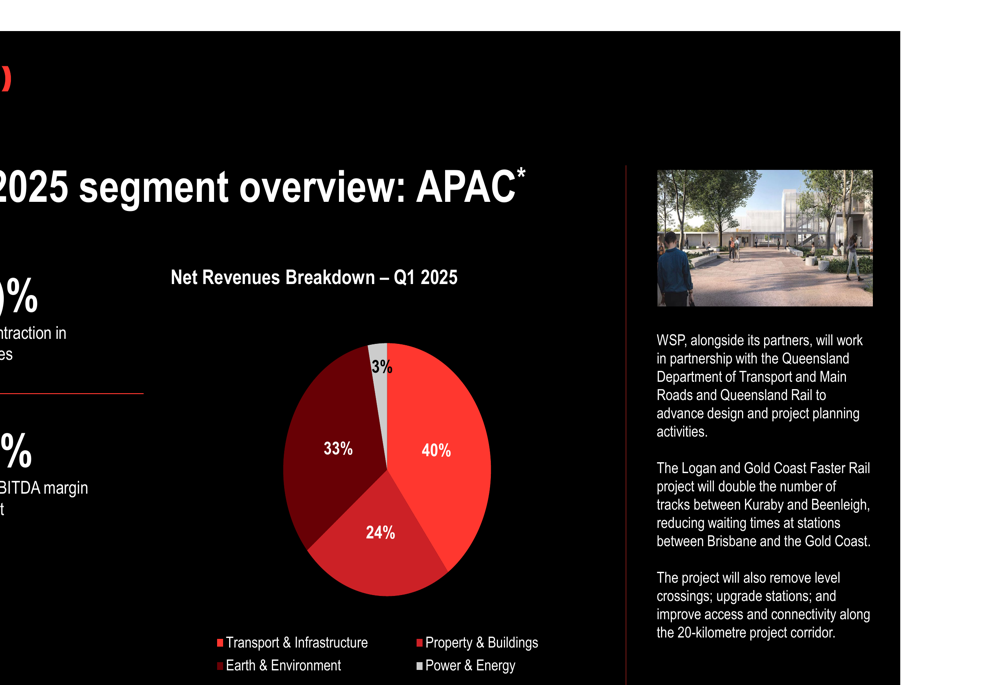
The APAC (Asia-Pacific) region showed a similar distribution to EMEA, with Property & Buildings at 40%, Transport & Infrastructure at 33%, Earth & Environment at 24%, and Power & Energy at 3%. A highlighted project was WSP’s partnership with Queensland authorities on the Logan and Gold Coast Faster Rail project.
Strategic Initiatives & Outlook
WSP continues to focus on projects aligned with secular trends across its core end-markets. The company highlighted several significant projects that demonstrate its strategic positioning:
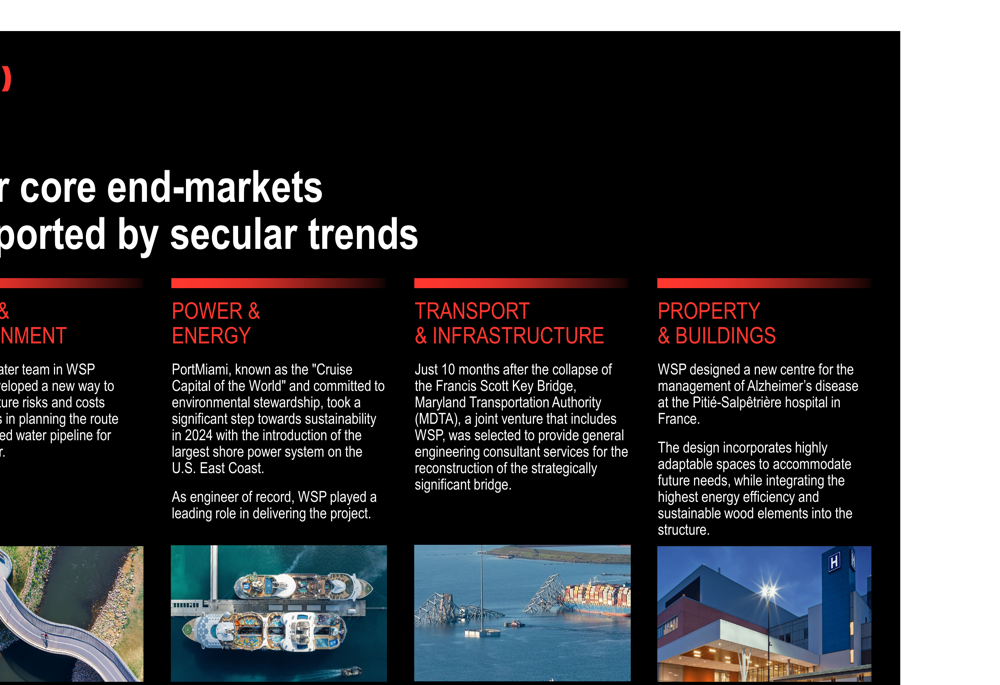
These projects showcase WSP’s diverse capabilities and its alignment with long-term growth trends in sustainable infrastructure, energy transition, and environmental services. The company’s record backlog and strong financial performance position it well for continued growth in these areas.
While the presentation did not explicitly outline future guidance, the substantial backlog growth and improved cash flow position suggest WSP is well-positioned to maintain its growth trajectory. The company’s ability to maintain stable margins while growing revenues significantly indicates effective execution of its business strategy.
The consistent performance across all geographic segments also demonstrates WSP’s resilience and ability to capitalize on global infrastructure and environmental services opportunities, despite varying regional economic conditions.
Full presentation:
This article was generated with the support of AI and reviewed by an editor. For more information see our T&C.