Bubble or no bubble, this is the best stock for AI exposure: analyst
U.Today - XRP is closer to a reversal than you might think, considering the current state of the asset. With the surge of the market we have witnessed after the "approval" of the Ethereum ETF, some assets did not capitalize. Unfortunately, XRP is among them. However, after three days of consecutive losses, the asset is finally making a comeback.
The 50-day, 100-day and 200-day moving average, as well as other significant moving averages, have been breached by XRP in recent price action, which has been lackluster. The price of XRP has dropped as low as $0.50 as a result, creating bearish sentiment around the cryptocurrency. Even though the Ethereum ETF approval has caused a rally on the market, overall XRP has been in a downward trend due to its inability to break above resistance levels.
XRP must breach the immediate resistance at $0.55 in order to verify a reversal. If volume continues to rise and the price moves above this barrier, it may indicate a change in the mood of the market and draw in more buyers.
The 200-day EMA is currently at $0.57, so that would be the next important resistance level to keep an eye on. Remaining above $0.50 is critical for downside support. XRP may test lower support levels if it falls below this level, which could result in additional declines. But if the overall market stays supportive, current indicators point to a greater likelihood of a reversal.
Solana's short-term advancement
Solana has landed on a solid short-term support level, which might play out favorably in the current market context. Considering that many assets are oversold and the general sentiment remains positive, this support level could be pivotal for SOL's price action in the near future.Based on the chart, SOL's current price is just above its 50-day moving average ($163) at $167. This level has been a major source of support in the last few weeks, stopping further declines and acting as a foundation for future upward movements. Slightly below at $152, the 100-day EMA provides more support should the price drop even further.
SOL is not in overbought territory, as indicated by the Relative Strength Index (RSI), which is circling around 58. This implies that there could be more growth, particularly if the market's attitude is still optimistic overall. The position of the RSI suggests that buying pressure may build up without going into overbought territory too soon.
Ethereum's balance
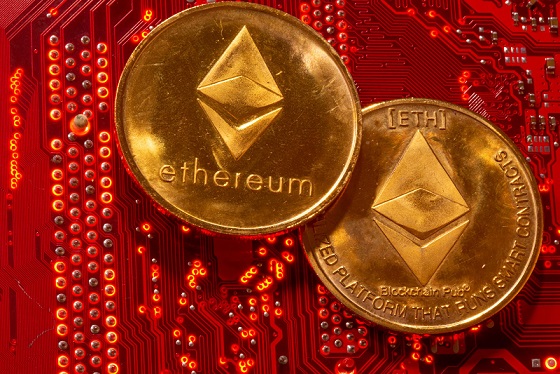
Ethereum is teetering on the edge right now, with the price consolidating at around $3,730, which is a crucial threshold. A breakdown below this level could lead to a potential plunge toward $3,200, an important historical price level.ETH is currently trading slightly above its 50-day EMA at $3,495 and its 100-day EMA at $3,224 according to the current price action. In order to prevent further losses, ETH must hold these moving averages as crucial support levels. In case the price declines considerably, the 200-day EMA, which is situated at $2,915 provides a final line of protection.
There may be some room for upward movement for ETH as the Relative Strength Index (RSI), which is currently circling 64, shows that the cryptocurrency is not in overbought territory.
But because the RSI is not in the oversold area, which usually denotes a better buying opportunity, its current level also suggests caution. Volume analysis shows that there have not been any notable upticks in buying or selling pressure, indicating a moderate level of trading activity. There could be two consequences of this lack of volume.
Watch out around $3,495 and $3,224 as the next major supports if Ethereum is unable to maintain above $3,730. If these levels are broken, ETH might test $3,000 and possibly even lower, as $2,915 is a crucial support level. ETH, on the other hand, might regain bullish momentum if it can hold its current level and break above the immediate resistance at $3,800.
