Can anything shut down the Gold rally?
Investing.com -- Nestlé shares fell more than 4% on Thursday after the Swiss consumer goods company posted a 10.3% drop in first-half net profit and negative volume growth in the second quarter, as cost inflation and currency pressures weighed on performance.
Net profit fell to 5.07 billion Swiss francs in the six months ended June 30, from CHF 5.64 billion a year earlier.
Sales declined 1.8% to CHF 44.23 billion, impacted by a 4.7% foreign exchange drag due to the stronger Swiss franc, Nestlé said in its earnings report.
Organic growth reached 2.9%, driven by 2.7% pricing, while real internal growth (RIG) was 0.2% in the half and minus 0.4% in the second quarter.
Underlying trading operating profit dropped 7.1% to CHF 7.3 billion. The margin declined 90 basis points to 16.5%, due to higher input costs and increased investment.
Gross profit margin slipped 60 basis points to 46.6%, primarily on rising commodity costs, including coffee and cocoa.
Free cash flow fell 42% to CHF 2.3 billion from CHF 4 billion, reflecting lower EBITDA and working capital outflows.
Operating cash flow dropped to CHF 6.2 billion from CHF 8.1 billion. Net debt rose to CHF 60 billion from CHF 56 billion, driven by a CHF 7.8 billion dividend payment.
Earnings per share declined 9% to CHF 1.97. Marketing and administration expenses rose to 20.4% of sales, with advertising and promotional spending at 8.6%.
Net financial expenses increased to CHF 759 million from CHF 744 million. The tax rate rose to 26.4% from 25% due to one-off charges.
By region, organic growth was 2.1% in the Americas, 2.4% in Asia, Oceania and Africa, and 3.5% in Europe.
Developed markets grew 1.8%, while emerging markets expanded 4.5%, though RIG in the latter declined 1.1%. Weak sales in Greater China reduced group Q2 organic growth by 70 basis points and RIG by 40 basis points.
Among categories, confectionery grew 8.5%, and powdered and liquid beverages rose 6.4%, both led by pricing.
PetCare was up 1.3%, while nutrition and health science was flat. Prepared dishes and cooking aids declined 0.9%.
Nespresso recorded 5.8% growth, supported by pricing and Vertuo system sales. Nestlé Health Science grew 3.4%, led by pediatric nutrition.
Nestlé maintained its full-year guidance for improved organic sales growth and an underlying trading operating profit margin at or above 16%.
Jefferies analysts flagged the RIG contraction in Q2 and margin fragility in the second half as concerns.
They expect the margin to drop to around 15.5% in H2 to meet the full-year target, citing continued pressure from tariffs, input costs and FX.
They also noted continued weakness in China and Latin America, and called out Health Science underperformance.
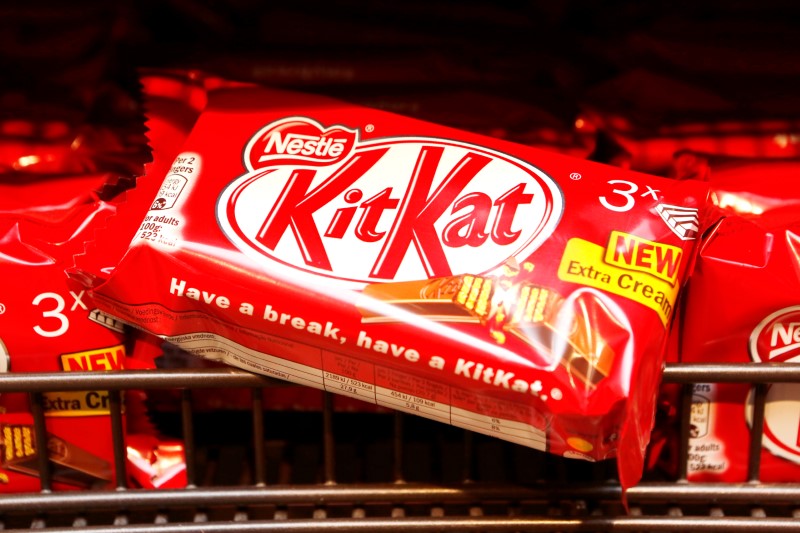
The The KitKat and Koko Krunch maker said six innovation products, including NAN Sinergity and Nescafé Dolce Gusto Neo, generated over CHF 200 million in combined first-half sales.
