China chip stocks rally on self-reliance bets, Nvidia scrutiny
(For a live blog on the U.S. stock market, click LIVE/ or
type LIVE/ in a news window)
* S&P 500 on track for worst day since Dec 2008
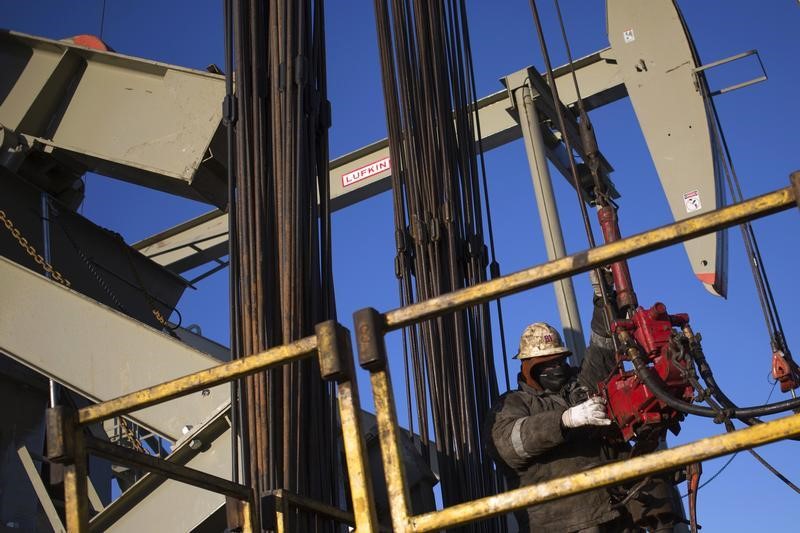
* Crude prices tumble to lowest since 1991 Gulf War
* Energy shares, chipmakers take a pounding
* Indexes down: Dow 7.80%, S&P 7.47%, Nasdaq 6.75%
(Updates to late afternoon, changes dateline, byline)
By Stephen Culp
NEW YORK, March 9 (Reuters) - Wall Street tumbled on Monday
and recession fears loomed large as plummeting oil prices and
ongoing coronavirus worries sparked a panic-driven sell-off,
sending investors fleeing risk for safety on the anniversary of
the U.S. stock market's longest-ever bull run.
All three major U.S. stock averages opened sharply lower in
a plunge so steep it triggered a trading halt due to safeguards
put in place to avoid a repeat of 1987's "Black Monday" crash.
The Dow dropped a record 2,000 out of the starting gate.
S&P 500 was on track for its largest one-day percentage drop
since December 2008, the height of the financial crisis.
The index is now about 18% below its all-time high set on
Feb. 19. A bear market is confirmed when stocks reach 20% below
record peak.
"It's a perfect storm," said Chris Zaccarelli, chief
investment officer at Independent Advisor Alliance in Charlotte,
North Carolina. "You've got a lot of uncertainty in terms of how
far the virus will spread in the U.S. You layer onto this the
oil price cut."
"Today is all about oil being the straw that broke the
camel's back," Zaccarelli added.
Peter Cardillo, chief market economist at Spartan Capital
Securities in New York agreed.
"There's a lot of fear in the market and if the price of oil
continues to move lower it's an indication that a global
recession is not far away," Cardillo said.
The CBOE Volatility index .VIX , a gauge of investor
anxiety, touched its highest level since December 2008.
Benchmark 10-year U.S. Treasury yields briefly sank to
0.318%, a record low. The rout began over the weekend when the oil supply pact
between Saudi Arabia and Russia collapsed and both countries
vowed to hike production amid weakening global demand due to
the coronavirus and signs of an economic slowdown. Oil prices crashed to their lowest since the 1991 Gulf war,
with Brent crude futures LCOc1 last down 22.05% and
front-month WTI falling 22.3%, sending the S&P Energy index
.SPNY down 19.3%, which would be its largest one-day decline
since October 2008. Global markets were already on edge as worldwide confirmed
cases of COVID-19 surged past 110,000, causing widespread supply
disruption and large scale quarantine measures as governments
scramble to contain the outbreak.
The Dow Jones Industrial Average .DJI fell 2,017.64
points, or 7.8%, to 23,847.14, the S&P 500 .SPX lost 221.98
points, or 7.47%, to 2,750.39 and the Nasdaq Composite .IXIC
dropped 578.54 points, or 6.75%, to 7,997.08.
All 11 major sectors of S&P 500 were deep in red territory,
with energy and financial .SPSY stocks suffering the largest
percentage losses.
Boeing Co BA.N was the biggest drag on the Dow, tumbling
13.0% following the Federal Aviation Administration's (FAA)
rejection of the planemaker's proposal regarding wiring systems
in place on its grounded 737 MAX aircraft. Apple Inc AAPL.O shares fell 6.8% after data showed the
company sold fewer than 500,000 smartphones in China in February
amid the coronavirus crisis. Chipmakers set a path for their largest drop since January
of last year, with the Philadelphia SE Semiconductor index
falling 7.8%.
Declining issues outnumbered advancing ones on the NYSE by a
18.82-to-1 ratio; on Nasdaq, a 19.48-to-1 ratio favored
decliners.
The S&P 500 posted 1 new 52-week highs and 226 new lows; the
Nasdaq Composite recorded 9 new highs and 970 new lows.
S&P energy relative to S&P 500 vs crude https://tmsnrt.rs/38RxTL9
US crude price vs energy sector ETF https://tmsnrt.rs/2TPLlcD
Plunging oil, coronavirus stoke credit concerns https://tmsnrt.rs/2TBKldj
^^^^^^^^^^^^^^^^^^^^^^^^^^^^^^^^^^^^^^^^^^^^^^^^^^^^^^^^^^^>
