Oil prices hold gains amid stalled Ukraine peace talks, Fed cut hopes
The year of the pandemic was horrible for most things. But it was sweet for stocks and a select group of raw materials, particularly sugar prices, which had their best year in five. With 2021 in play, the commodity is again rewarding its most bullish investors, hitting near four-year highs on the first trading day of the new year.
Raw sugar futures rose to peaks not seen since May 2017 on continued signs of unfavorable weather in major growing countries Brazil and Thailand, and a slump in shipments out of India, the commodity’s third largest exporter.
Front-month raw sugar on the U.S. ICE, or InterContinental Exchange, settled at 15.75 cents a lb in Monday’s trade, rising nearly a quarter cent or 1.7%. The session peak was 16.12 cents, a high not seen since May 23, 2017.
Sugar overshot most analysts’ expectations for last year, finishing at 15.28 cents.
For 2021, ratings agency Fitch said it expected prices to average about 13.50 cents.
Dry Brazilian Weather Driving Sugar Rally
Jack Scoville, a sugar analyst at Chicago’s Price Futures Group brokerage, said speculative buying tied to forecasts for dry weather in Brazil, which produces roughly 18% of the world’s sugar, was driving the trade.
Added Scoville:
“It has been raining in south central Brazil and the production of cane is winding down for the season. The rains have come late to the region. Production has been hurt due to dry weather earlier in the year.”
Thailand, which accounts for almost 9% of world sugar production, might also plant less of the crop this year due reduced cultivation areas and erratic rains during the monsoon season.
On the European Union side, weather and disease were also affecting sugarbeets grown in countries in the bloc, which collectively account for about 20% of global sugar output.
More important, said Scoville, was India, which was despite having a bumper sugar crop in 2020, exported less last year than 5 million tonnes it typically did in an annum. The situation could worsen this year, he said, explaining:
“With the Indian government not announcing subsidies for sugar exporters, no immediate exports will be coming out of India yet for the current year. Subsidies will need to be significant to get export sales on the books.”
Ramping COVID, Weakening Ethanol Take Some Sweetness Off Sugar
While the 2021 outlook for sugar remained as bullish as last year’s, some of the positives were offset by the reemergence of the coronavirus in a bigger way, via the U.K.-discovered variant of the virus, Scoville said.
This has hurt a portion of the global demand for sugar from foods as well as ethanol, the biofuel produced largely from the crop.

All charts courtesy of SK Dixit Charting
So, what do sugar price charts show for this year?
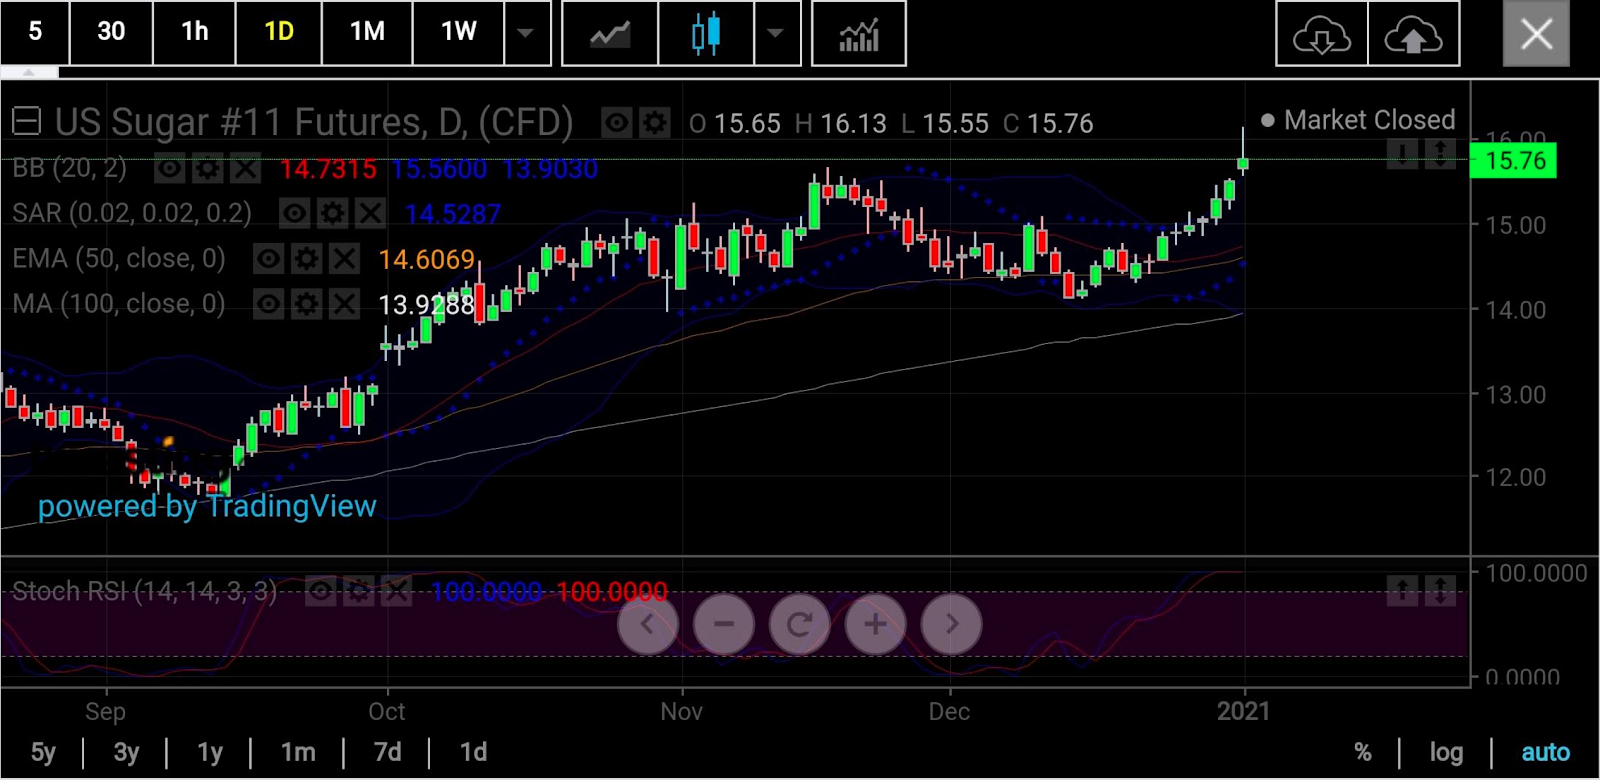
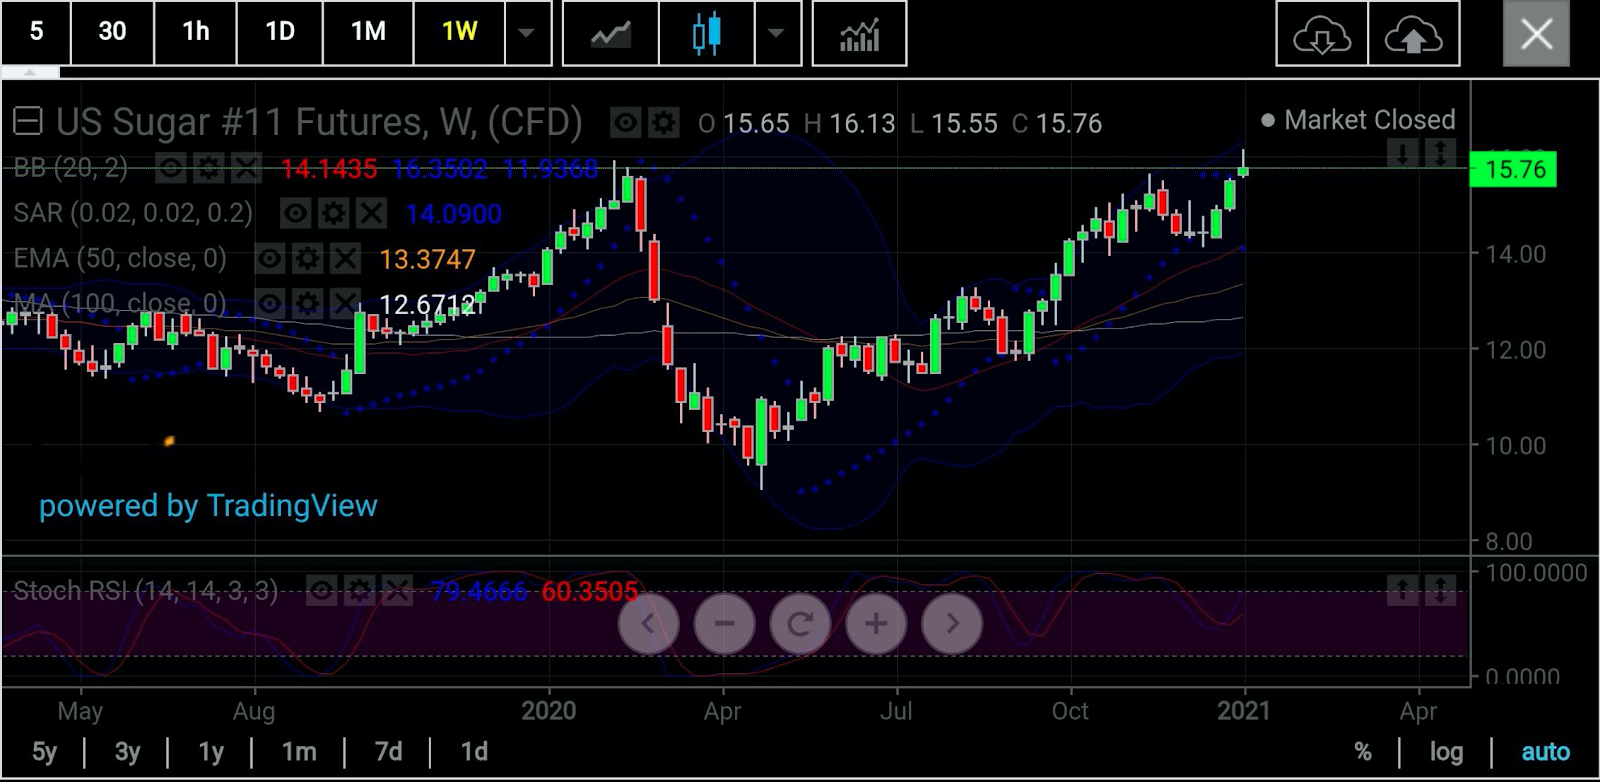
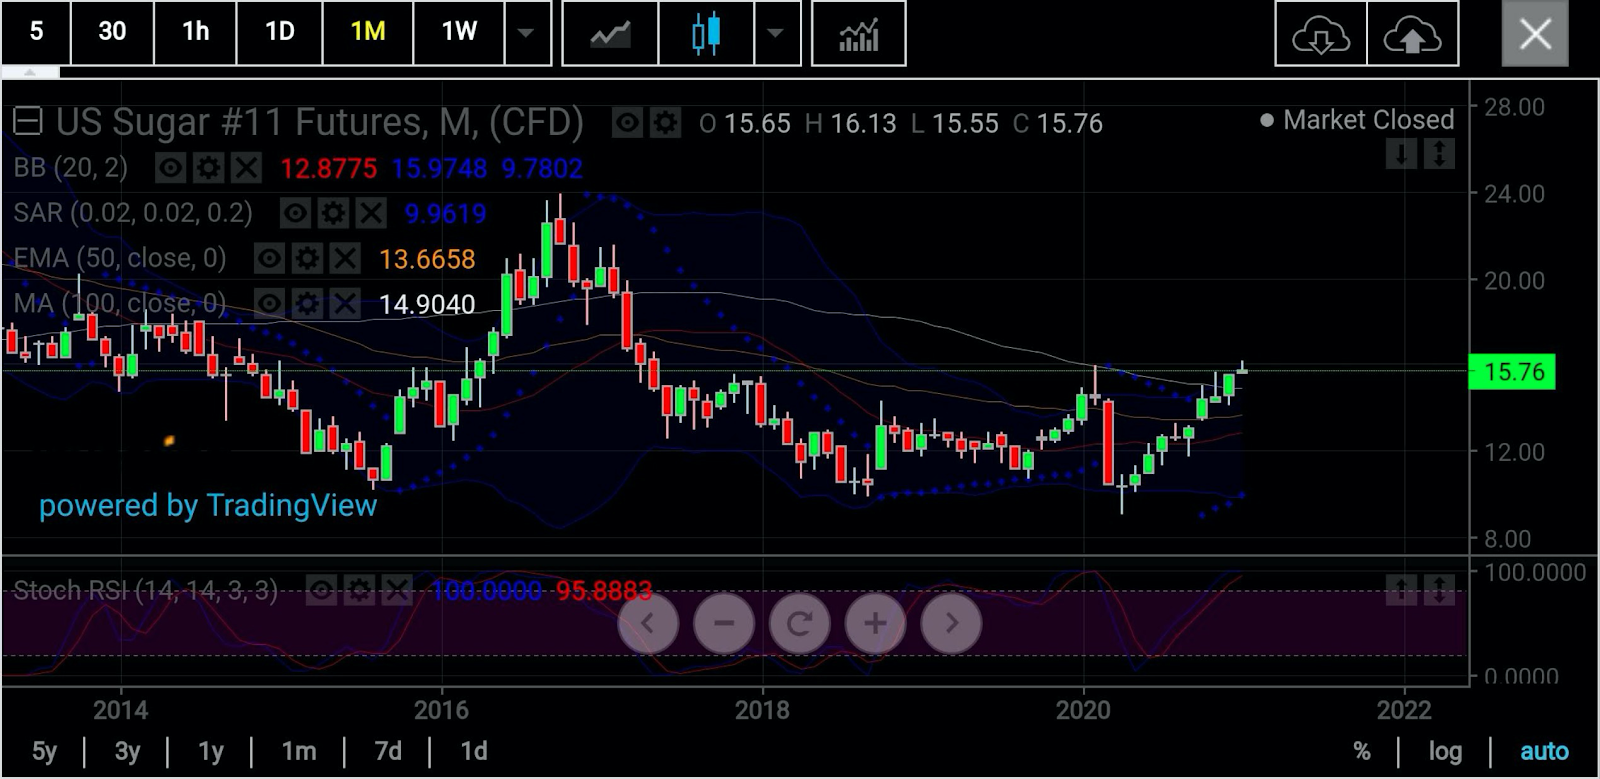
After Monday’s near four-year high, sugar has technical potential to rise to 18.50 cents, which would be its highest level since the March 2017 peak of 19.84, said Sunil Kumar Dixit, chartist at SK Dixit Charting in Kolkata, India.

Dixit added:
“With sugar decisively steering through the 15.75 level, we have a multi-year breakout now. Prices are above the 100-Month Simple Moving Average of 14.90 and 50-Day Exponential Moving Average of 14.60.”
“The stochastic Relative Strength Indicator shows a prepared move northward. In the short-to-mid term, 15.98 & 16.60 cents are likely. On the longer term, 18.50 can be on the cards. It's important to see the 18.50 area acted as horizontal support and resistance multiple times.”

“Strong Buy” Still On The Charts
On Investing.com’s side, our Daily Technical Outlook for sugar suggests a “Strong Buy.”
With the market having blown past analysts’ expectations, there is a possibility that sugar could retreat to around 15.70 cents to regain technical strength to move higher. In the event of such a contraction, an interim three-tier resistance—starting with 15.62 cents and going on to 15.76 and 15.99—is expected.
Should the trend remain bearish, then a three-tier support—beginning with 14.88 cents and going on to 15.02 and 15.25—is anticipated.
In any case, the pivot point between the resistance and support levels is 15.39.
As with all technical projections, we urge you to follow the calls but temper them with fundamentals—and moderation—whenever possible.
Disclaimer: Barani Krishnan uses a range of views outside his own to bring diversity to his analysis of any market. He does not own or hold a position in the commodities or securities he writes about.
