Wall St futures flat amid US-China trade jitters; bank earnings in focus
- Energy stocks have had a great start to the second half of the year
- But will the initial momentum result in a strong finish to 2023?
- Let's delve into three stocks showing early signs of a sustained H2 rally
After a period market by subsiding oil and natural gas prices, energy stocks appear to be back in the vogue at the start of the latter half of the year.
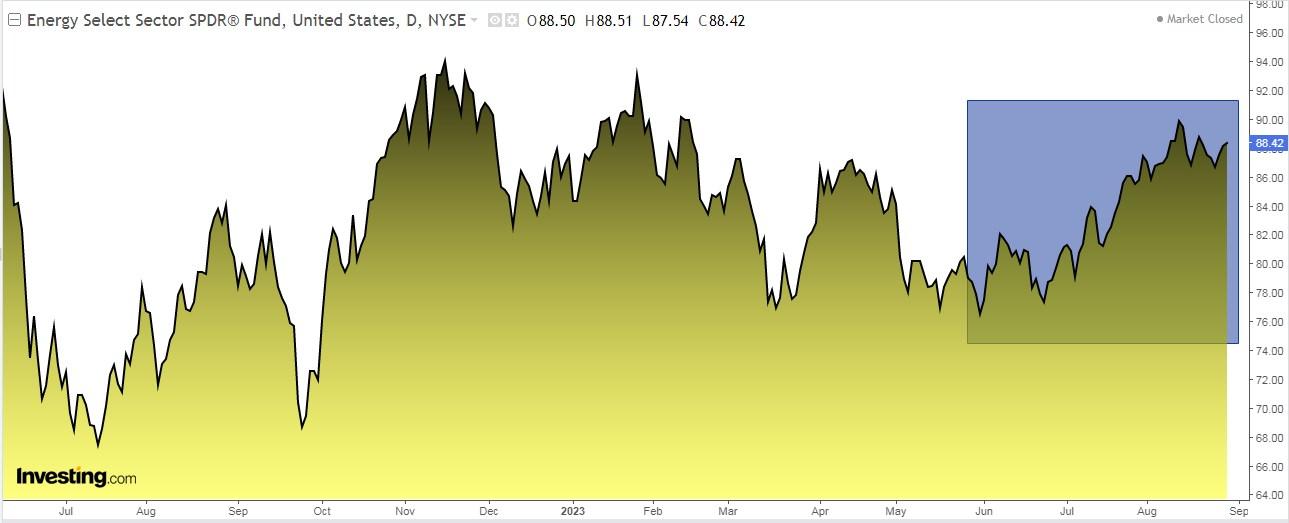
This trend is evident in the Energy Sector Fund (NYSE:XLE), which has surged 10% since the end of June. This performance positions it as the leading sector within the S&P 500 during this period. Interestingly, many might not be aware that the energy sector doesn't carry much weight within the S&P 500, accounting for less than 5%.
There are two ways to invest in the energy sector. You could buy individual shares of companies within the sector. Or, you can invest in ETFs.
In terms of ETFs, there are two noteworthy options:
- The prominent one is the Energy Select Sector SPDR Fund (XLE) which manages $37.5 billion. Established on December 16, 1998, it debuted with a trading price of $23.31. The fund's expense ratio is 0.10%. It comprises 28 companies, with the largest holdings being Chevron (NYSE:CVX), ExxonMobil (NYSE:XOM), Phillips 66 (NYSE:PSX), ConocoPhillips (NYSE:COP), EOG Resources (NYSE:EOG), Valero Energy (NYSE:VLO), Williams Companies (NYSE:WMB), Schlumberger (NYSE:SLB), Kinder Morgan (NYSE:KMI) and Marathon Petroleum (NYSE:MPC).
- Vanguard Energy Index Fund ETF Shares (NYSE:VDE), overseeing $8.4 billion with a 0.10% expense ratio, holds several key energy companies. These include ExxonMobil, Chevron, ConocoPhillips, Schlumberger, EOG Resources, Marathon Petroleum, Occidental Petroleum (NYSE:OXY), Pioneer Natural Resources (NYSE:PXD), Valero Energy and Phillips 66.
On the other hand, you can buy stocks showing early signs of strength, with the potential to have a very strong H2 2023.
1. APA
Based in Houston, Texas, APA Corporation (NASDAQ:APA) is involved in the exploration and production of oil and gas across regions like the United States, Europe, Africa, and Latin America. It became the parent company of Apache Corporation in 2021.
The current dividend yield stands at +2.30%, with dividends of $0.25 per share distributed this year.
Notably, the results announced on August 2 showed strong performance, with revenues up by +11.9% and earnings per share (EPS) increasing by +18.9%. Investors can look forward to the next set of results on November 1. The stock has received 28 ratings from analysts, out of which 16 have recommended buying, 8 have recommended holding, and 4 have recommended selling.
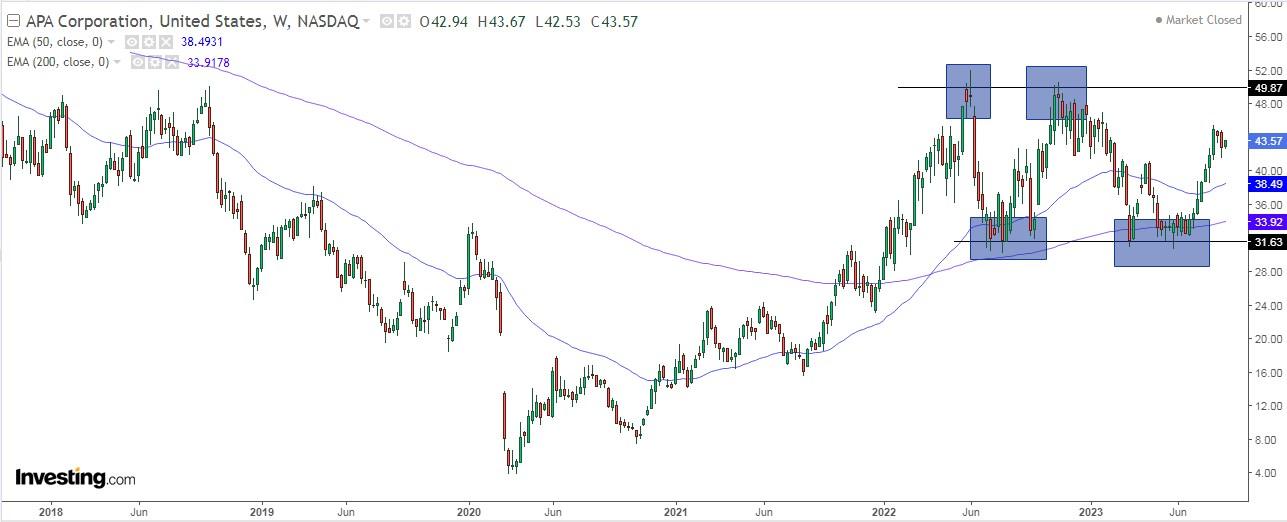
As per the market analysis, the stock has the potential to reach $49.79, while InvestingPro's models estimate its value to be at $49.34.
The stock has shown a positive trend, with a 9% rally in the last month and +35% in the last three months. It has held on to its support level and bounced back strongly, remaining above its 50 and 200-day averages.
2. Schlumberger
Originally established in 1926 as Société de prospection électrique, Schlumberger is now the world's largest oilfield services company.
Operating in over 85 countries, its main offices are situated in Houston, Paris, London, and The Hague. Its shares are traded on various exchanges, including the New York Stock Exchange, Euronext in Paris, the London Stock Exchange, and the SIX Swiss Exchange.
The upcoming dividend payment is set at $0.25 per share on October 12, and to be eligible for this dividend, shares must be held before September 5. The annual dividend yield is at +1.72%.
In terms of recent performance, the results revealed on July 21 exceeded expectations, with earnings per share performing 1% better than anticipated.
Looking ahead, the next results are scheduled for October 20, where an improvement of +6.06% is expected in earnings per share, reaching $0.78, along with a better profit increase of +4.12%. Schlumberger has received a total of 27 ratings from analysts, with a breakdown of 24 buy ratings, 3 hold ratings, and 0 sell ratings. UBS has assessed its potential to reach $73, while the broader market consensus suggests a potential value of $66.
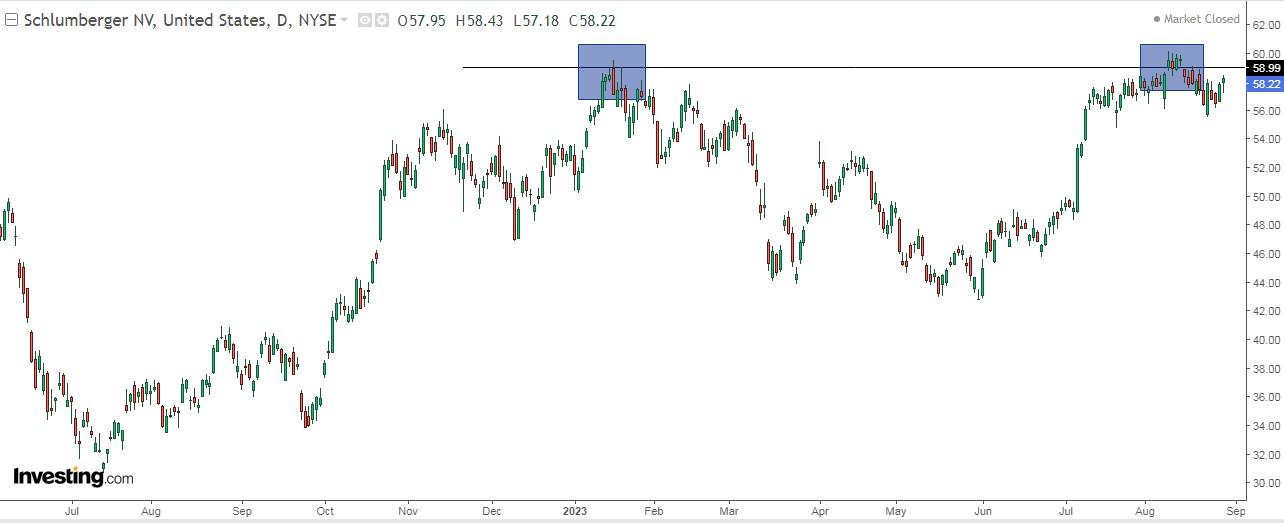
Over the past 3 months, the company's shares have seen a significant increase, rising by +32.11%. Looking at a longer timeframe, the shares have shown strong growth over the past 12 months, recording a gain of +53.28%.
However, it's important to note that Schlumberger encountered resistance at the beginning of August. Despite its positive performance, the stock has been unable to surpass this resistance level, which could be influencing its recent movement.
3. Phillips 66
Phillips 66 is headquartered in Houston, Texas. Originally formed as a subsidiary of ConocoPhillips to manage its downstream and midstream assets, it became an independent entity and started trading on the New York Stock Exchange on May 1, 2012.
With an annual dividend yield of +3.73%, Phillips 66 offers attractive returns to its shareholders. The most recent dividend distribution amounted to $1.05 per share.
In its latest financial report released on August 2, the company displayed strong performance, surpassing expectations with an impressive +8.6% increase in earnings per share.
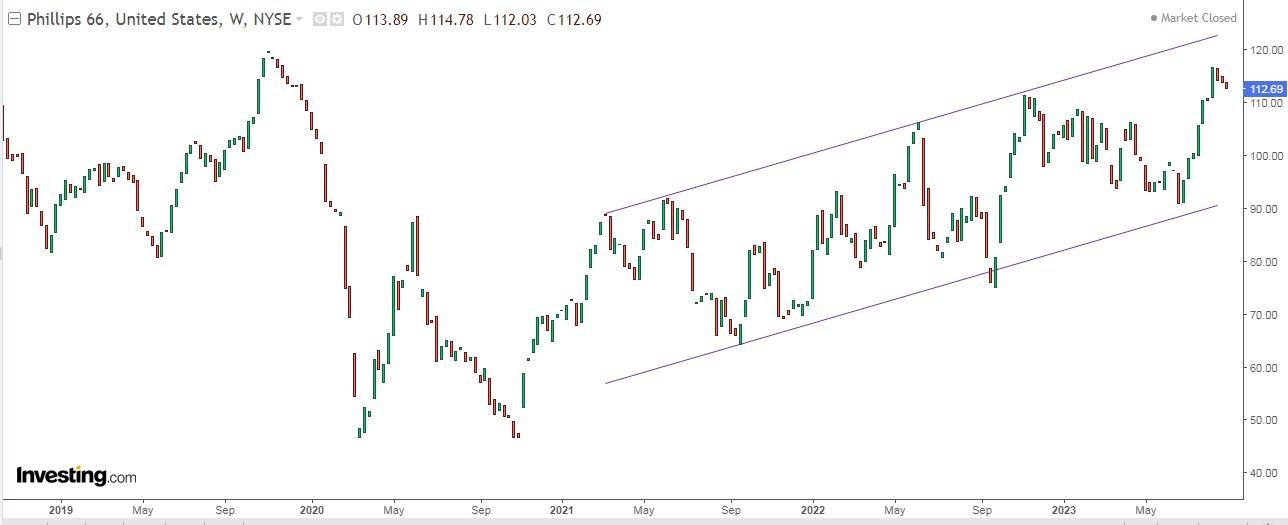
Investors can look forward to the upcoming financial results on October 27, which are anticipated to show remarkable growth of +39.70% in earnings per share and +6.50% on the earnings front. InvestingPro's models indicate a potential value of $150.62. Its shares have risen +21.53% over the past 3 months and +30% over the past 12 months, and it is currently moving within the range of an ascending channel.
***
Disclaimer: The author does not own any of these shares. This content, which is prepared for purely educational purposes, cannot be considered as investment advice.

