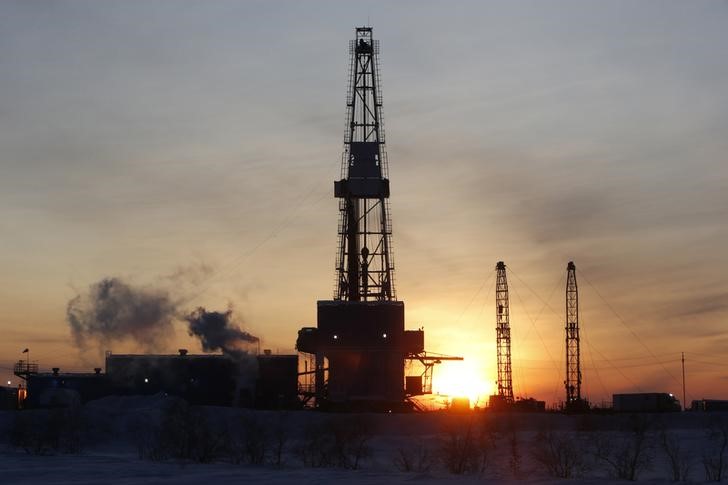
Williams Companies Inc (WMB)

Currency in USD
57.71
+0.35(+0.61%)
Closed·
After Hours
57.72+0.01(+0.02%)
·
WMB Scorecard
Full Analysis
Has raised its dividend for 7 consecutive years
Earnings results expected in 11 days
Fair Value
Day's Range
56.9657.89
52 wk Range
40.4163.45
Key Statistics
Prev. Close
57.71
Open
57.26
Day's Range
56.96-57.89
52 wk Range
40.41-63.45
Volume
6.76M
Average Volume (3m)
7.75M
1-Year Change
30.92%
Book Value / Share
10.2
Fair Value
unlockUnlock
Fair Value Upside
unlockUnlock
WMB Scorecardpro icon
Company’s Health
Unlock
Fair Value
Unlock Price
Fair Price
Upside
Price Target
62.15
Upside
+7.68%
Members' Sentiments
Bearish
Bullish
ProTips
5 analysts have revised their earnings downwards for the upcoming period

Williams Companies Inc News & Analysis

Show more

Technical Analysis

Summary
Strong Sell
Sell
Neutral
Buy
Strong Buy
Neutral
Technical Indicators
Buy
Moving Averages
Neutral

Williams Companies Inc Company Profile

The Williams Companies, Inc., together with its subsidiaries, operates as an energy infrastructure company primarily in the United States. It operates through Transmission & Gulf of America, Northeast G&P, West, and Gas & NGL Marketing Services segments. The Transmission & Gulf of America segment comprises Transco, NWP, and MountainWest interstate natural gas pipelines, and their related natural gas storage facilities, as well as natural gas gathering and processing; and crude oil production handling and transportation assets in the Gulf Coast region. The Northeast G&P segment engages in the midstream gathering, processing, and fractionation activities in the Marcellus Shale region primarily in Pennsylvania and New York, and the Utica Shale region of eastern Ohio. The West segment consists of gas gathering, processing, and treating operations in the Rocky Mountain region of Colorado and Wyoming, the Barnett Shale region of north-central Texas, the Eagle Ford Shale region of South Texas, the Haynesville Shale region of northwest Louisiana, the Mid-Continent region that includes the Anadarko and Permian basins, and the DJ Basin of Colorado; and operates natural gas liquid (NGL) fractionation and storage assets in central Kansas near Conway. The Gas & NGL Marketing Services segment provides wholesale marketing, trading, storage, and transportation of natural gas for natural gas utilities, municipalities, power generators, and producers; asset management services; and transports and markets NGLs. The company owns and operates approximately 33,000 miles of pipelines. The Williams Companies, Inc. was founded in 1908 and is headquartered in Tulsa, Oklahoma.

Williams Companies Inc SWOT Analysis


Midstream Momentum
Williams Cos. shows impressive stock performance with a 43.18% return over the past year, highlighting its strong position in the North American energy secto
Strategic Expansions
Explore Williams' revival of the Northeast Supply Enhancement project and its potential impact on the company's growth in the northeastern United States
Financial Forecasts
Analysts project EPS of $2.19 for FY2025 and $2.56 for FY2026, with an average price target range of $56.00 to $67.00, indicating positive growth expectations
Market Adaptation
Delve into Williams' efforts to capitalize on emerging trends, including data center-related projects and demand-driven power generation opportunities
Read full SWOT analysis

Williams Companies Inc Earnings Call Summary for Q1/2025

  • Williams Companies beat Q1 2025 forecasts with EPS of $0.60 and revenue of $3.05 billion, but stock dipped 2.84% in after-hours trading
  • Quarterly dividend increased by 5.3% to $0.50 per share; company has maintained dividend payments for 52 consecutive years
  • Adjusted EBITDA guidance midpoint raised to $7.7 billion for 2025, indicating 9% growth from 2024
  • S&P upgraded Williams' credit rating to BBB+; company targets long-term EBITDA growth rate of 5-7%
  • CEO transition announced with Chad Zamarin emphasizing commitment to stable, predictable growth
Last Updated: 06/05/2025, 16:10
Read Full Transcript

Compare WMB to Peers and Sector

Metrics to compare
WMB
Peers
Sector
Relationship
P/E Ratio
30.9x13.1x4.9x
PEG Ratio
−1.450.630.00
Price/Book
5.7x3.9x1.1x
Price / LTM Sales
6.4x4.2x1.1x
Upside (Analyst Target)
10.7%9.3%23.3%
Fair Value Upside
Unlock11.2%9.1%Unlock

Analyst Ratings

13 Buy
9 Hold
1 Sell
Ratings:
23 analysts
Overall Consensus
Buy

Analysts 12-Month Price Target:

Average 62.15
(+7.68% Upside)

Dividends

Payout Ratio
Payout ratio (TTM)
Earnings retained
EPS 1.87%
Dividend Yield
3.47%
Industry Median 5.23%
Annualised payout
2.00
Paid quarterly
5-Years Growth
+4.56%
Growth Streak

Earnings

Latest Release
May 05, 2025
EPS / Forecast
0.60 / 0.58
Revenue / Forecast
3.05B / 2.83B
EPS Revisions
Last 90 days

WMB Income Statement

People Also Watch

323.70
CEG
+1.86%
419.39
LMT
+2.11%
629.03
GEV
+14.58%
26.81
KMI
-0.59%
283.69
AVGO
+1.83%

FAQ

What Stock Exchange Does Williams Trade On?

Williams is listed and trades on the New York Stock Exchange stock exchange.

What Is the Stock Symbol for Williams?

The stock symbol for Williams is "WMB."

What Is the Williams Market Cap?

As of today, Williams market cap is 70.46B.

What Is Williams's Earnings Per Share (TTM)?

The Williams EPS (TTM) is 1.87.

When Is the Next Williams Earnings Date?

Williams will release its next earnings report on 03 Aug 2025.

From a Technical Analysis Perspective, Is WMB a Buy or Sell?

Based on moving averages and other technical indicators, the daily buy/sell signal is Strong Sell.

How Many Times Has Williams Stock Split?

Williams has split 4 times.

How Many Employees Does Williams Have?

Williams has 5829 employees.

What is the current trading status of Williams (WMB)?

As of 24 Jul 2025, Williams (WMB) is trading at a price of 57.71, with a previous close of 57.71. The stock has fluctuated within a day range of 56.96 to 57.89, while its 52-week range spans from 40.41 to 63.45.

What Is Williams (WMB) Price Target According to Analysts?

The average 12-month price target for Williams is USD62.145, with a high estimate of USD74 and a low estimate of USD43. 13 analysts recommend buying the stock, while 1 suggest selling, leading to an overall rating of Buy. The stock has an +7.68% Upside potential.
Risk Disclosure: Trading in financial instruments and/or cryptocurrencies involves high risks including the risk of losing some, or all, of your investment amount, and may not be suitable for all investors. Prices of cryptocurrencies are extremely volatile and may be affected by external factors such as financial, regulatory or political events. Trading on margin increases the financial risks.
Before deciding to trade in financial instrument or cryptocurrencies you should be fully informed of the risks and costs associated with trading the financial markets, carefully consider your investment objectives, level of experience, and risk appetite, and seek professional advice where needed.
Fusion Media would like to remind you that the data contained in this website is not necessarily real-time nor accurate. The data and prices on the website are not necessarily provided by any market or exchange, but may be provided by market makers, and so prices may not be accurate and may differ from the actual price at any given market, meaning prices are indicative and not appropriate for trading purposes. Fusion Media and any provider of the data contained in this website will not accept liability for any loss or damage as a result of your trading, or your reliance on the information contained within this website.
It is prohibited to use, store, reproduce, display, modify, transmit or distribute the data contained in this website without the explicit prior written permission of Fusion Media and/or the data provider. All intellectual property rights are reserved by the providers and/or the exchange providing the data contained in this website.
Fusion Media may be compensated by the advertisers that appear on the website, based on your interaction with the advertisements or advertisers
© 2007-2025 - Fusion Media Limited. All Rights Reserved.