TSX futures subdued with key U.S. inflation data ahead
- Congressional stock trades are now tracked by ETFs, offering insights into sector-level positioning.
- Both Republican and Democrat ETFs tilt heavily toward tech, financials, and consumer-focused sectors.
- Several holdings trade well below fair value and offer consistent, income-generating dividends for investors.
- Looking for actionable trade ideas? Subscribe now to unlock access to InvestingPro’s AI-selected stock winners for up 50% off amid the summer sale!
Some investors, known as insiders, have access to important company information before it is made public. When they buy or sell shares, other investors often take notice—assuming these trades reflect valuable insights. This is why insider trading activity is required to be disclosed publicly.
But another group’s trades draw just as much attention: members of the US Congress.
The Unusual Whales Subversive Republican Trading ETF (NYSE:GOP) tracks the stocks held by Republican members of Congress. It charges a 0.75% fee. The sectors with the largest weight are: technology 24.15%, financials 16.32%, industrials 13.96%, energy 11.77%, and healthcare 7.40%. The top holdings include:
-
JPMorgan Chase (NYSE:JPM): 4.49%.
- iShares Bitcoin Trust ETF (NASDAQ:IBIT): 3.12%
- AT&T Inc (NYSE:T): 3.06%
- Comfort Systems USA Inc (NYSE:FIX): 2.62
- Chevron (NYSE:CVX): 2.56%
- Allstate Corp (NYSE:ALL): 2.47%
- NVIDIA (NASDAQ:NVDA): 2.39%
- INTEL (NASDAQ: ): 2.39%
- Tyson Foods Inc (NYSE:TSN): 2.17
- Fidelity National Information Services (NASDAQ:III): 2.16%
On the other hand, the Unusual Whales Subversive Democratic Trading ETF (NYSE:NANC) tracks stocks held by Democratic members of Congress. It charges a 0.74% fee. The fund’s largest sector weights are Technology (39.46%), Communication Services (13.22%), Health Care (11.18%), Consumer Cyclicals (9.90%), Consumer Defensive (8.79%), and Financials (8.55%). Its top holdings include:
- NVIDIA: 10.62%.
- Microsoft (NASDAQ:MSFT): 8.09%.
- Amazon.com (NASDAQ:AMZN): 5.17%
- Alphabet (NASDAQ:GOOGL): 3.80%
- Salesforce (NYSE:CRM): 3.69%
- Philip Morris International (NYSE:PM): 3.58%
- Netflix (NASDAQ:NFLX): 3.38%
- American Express (NYSE:AXP): 3.12%
- Meta Platforms (NASDAQ:META): 3.01%
- Apple (NASDAQ:AAPL): 2.95%
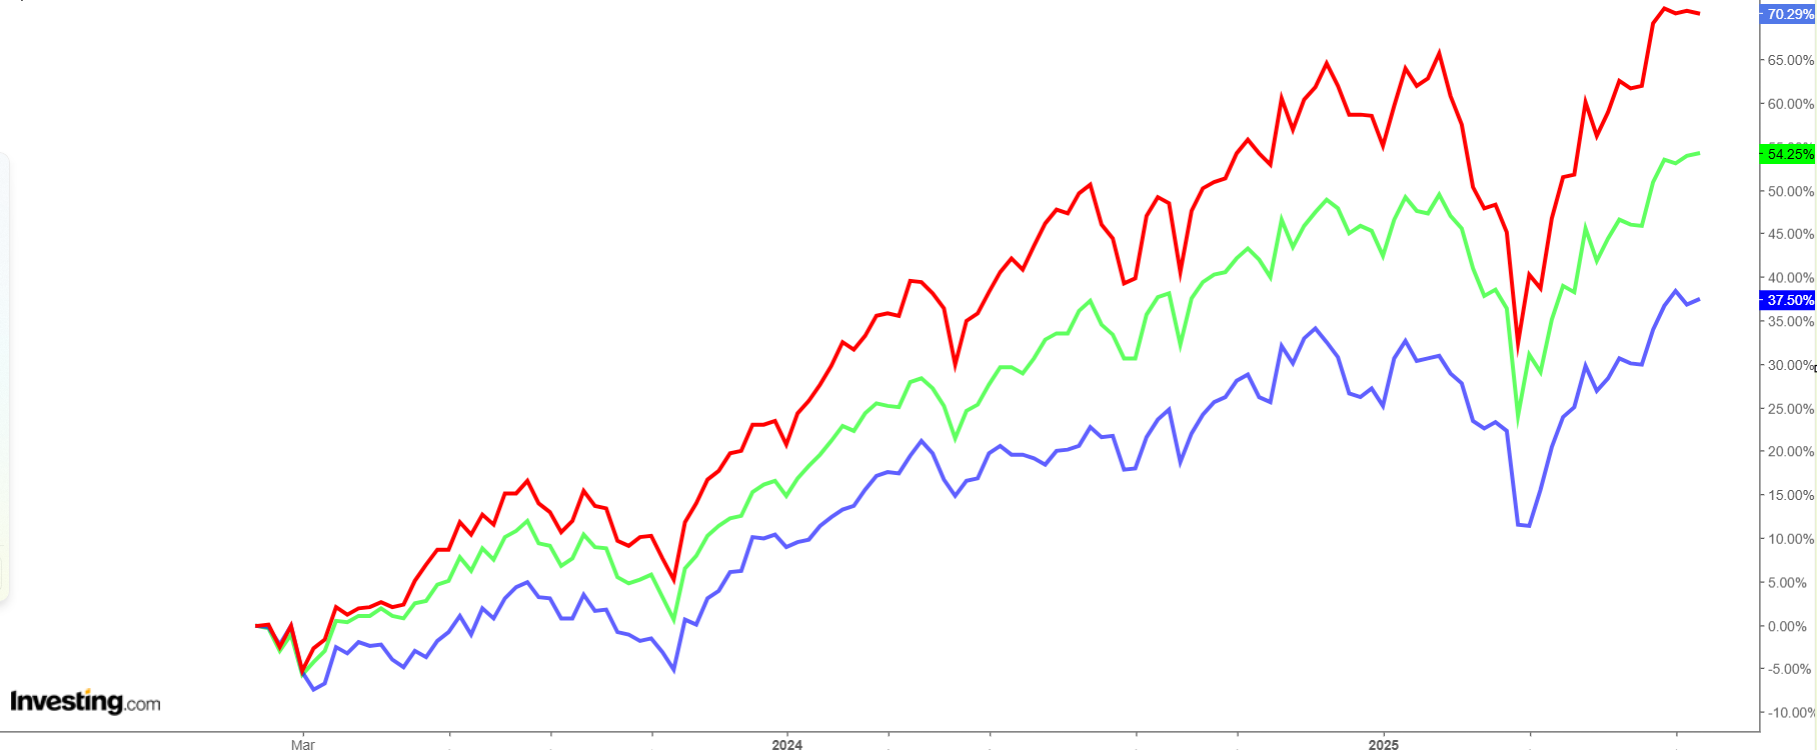
The chart below shows an interesting comparison: the green line represents the S&P 500, the red line tracks the Democrat ETF, and the blue line reflects the Republican ETF.
Let us look at some of the stocks held by these ETFs that share two key traits: they trade below their fair value and offer dividends.
1. Tyson Foods
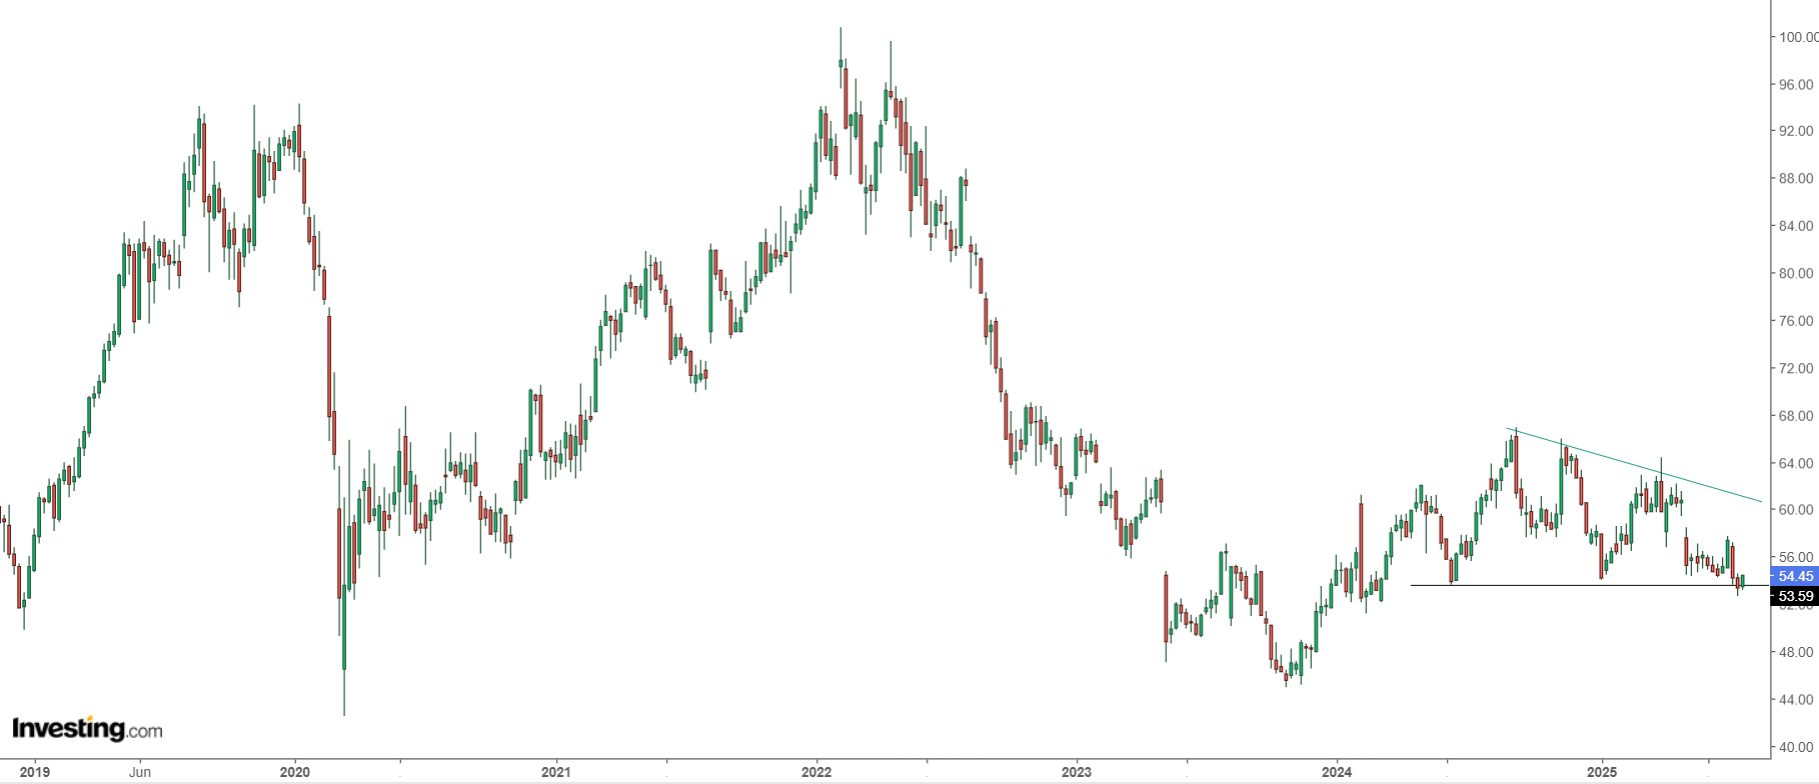
Tyson Foods, a multinational food company headquartered in Springdale, Arkansas, was founded in 1935. It is the world’s second-largest processor and marketer of chicken and pork, behind Brazil’s JBS.
The company is scheduled to pay a dividend of $0.50 per share on September 12, with an ex-dividend date of August 29. At current levels, Tyson Foods offers a dividend yield of 3.67%.

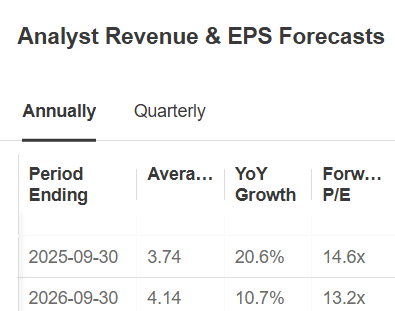
The company will report its quarterly results on August 4. After the first nine months, earnings per share (EPS) are expected to show a 20.6% increase.
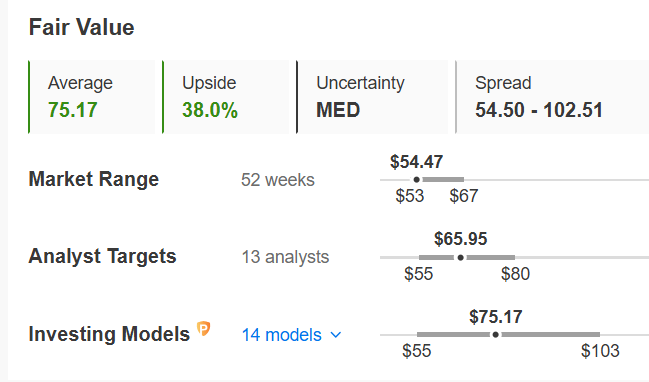
The stock has strong institutional backing, with funds like Victory Capital significantly increasing their holdings. It is currently trading 38% below its intrinsic value of $75.17, while the market consensus places the average price target at approximately $65.95.
2. Allstate
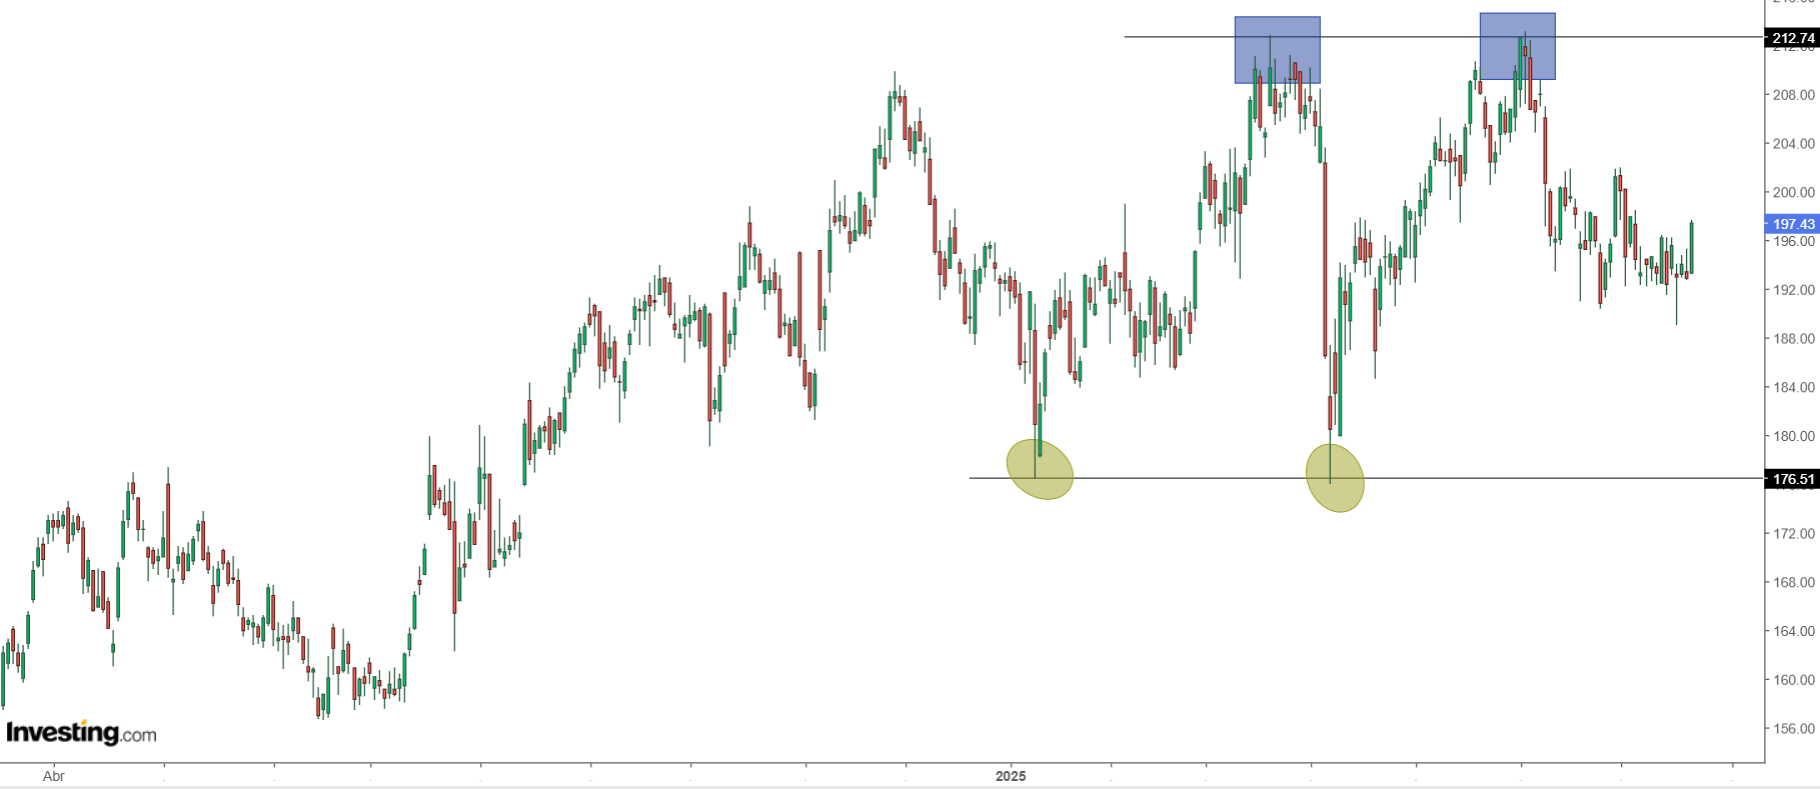
It is an American insurance company, headquartered in Glenview, Illinois. Founded in 1931 as part of Sears, Roebuck, it was spun off in 1993,
It pays a dividend of $1 per share on October 1, and shares must be held by August 29 to be eligible to receive the dividend. The dividend yield is 2.03%. Its dividend is consistent and growing.

On July 30, we will know its accounts for the quarter, expecting an increase in EPS or earnings per share of 22.40%. The insurer reported modest growth in its policy portfolio (0.1%).

Allstate has a P/E ratio of about 10.9 (versus an industry average of about 29), a P/E of 1.55 (versus 2.9 for the industry) and a P/S of 0.83 (versus the industry average of 1.19), suggesting it is undervalued.
Instead, it faces challenges linked to natural disasters, restrictive regulations and pricing pressure.
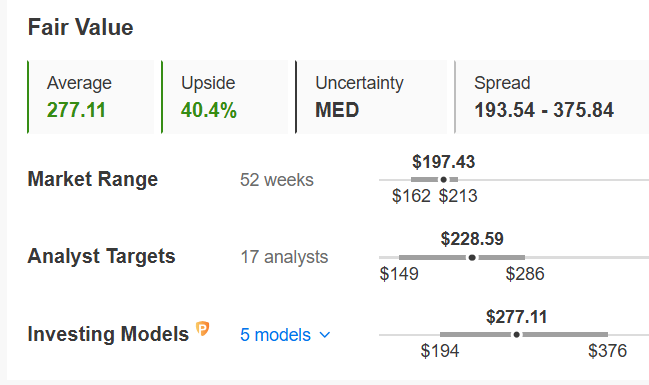
Its shares trade 40% below its fair value or price for fundamentals, which stands at $277.11. The market consensus assigns it an average target price of $228.59.
3. Fidelity National Information Services
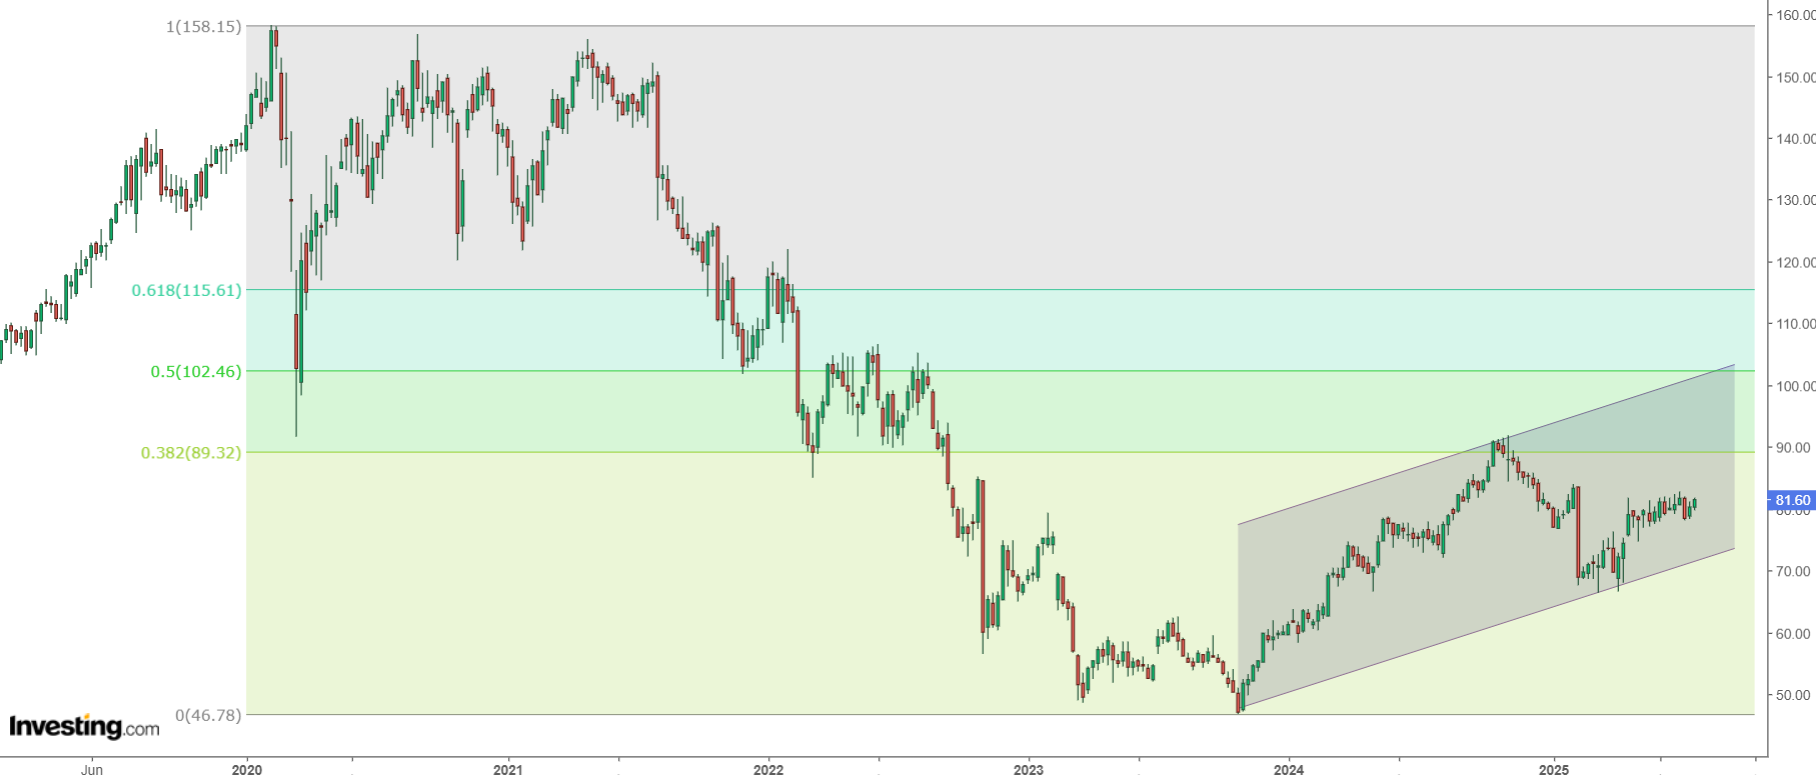
Fidelity National Information Services Inc (NYSE:FIS) is a US-based company that provides a broad suite of financial products and services, with a strong focus on financial technology (FinTech) solutions. Originally founded in 1968 as Systematics in Little Rock, it is now headquartered in Florida.

The company pays quarterly dividends of $0.40 per share in March, June, September, and December, amounting to an annual payout of $1.60 per share. This translates to a dividend yield of 1.96%. It recently reaffirmed its full-year outlook after a steady Q1.

Meanwhile, Wall Street’s confidence is ticking up ahead of this quarter’s earnings. Over the past 12 months, analysts have raised their Q2 EPS forecast by 1.3%, bumping it from $1.34 to $1.36 per share. The company is set to report results on August 5, 2025.

The company is focusing on fintech innovation with new cloud-native platforms like Quantum and Modern Banking, which now offer over 60 API-driven components. Its planned $12 billion acquisition of Global Payments (NYSE:GPN)’ issuer business, alongside the Worldpay spin-off, is expected to sharpen focus and boost profitability. Analysts remain optimistic, and credit ratings agencies have maintained a stable outlook.
Bottom Line
Congressional trading ETFs offer a unique lens into political investment behavior. While these funds reflect broader market trends, some of their holdings stand out for valuation and dividend potential—making them worth monitoring as part of a diversified analysis.
****
Whether you’re a novice investor or a seasoned trader, leveraging InvestingPro can unlock a world of investment opportunities while minimizing risks amid the challenging market backdrop.
- ProPicks AI: AI-selected stock winners with proven track record.
- InvestingPro Fair Value: Instantly find out if a stock is underpriced or overvalued.
- Advanced Stock Screener: Search for the best stocks based on hundreds of selected filters, and criteria.
- Top Ideas: See what stocks billionaire investors such as Warren Buffett, Michael Burry, and George Soros are buying.
Disclaimer: This article is written for informational purposes only. It is not intended to encourage the purchase of assets in any way, nor does it constitute a solicitation, offer, recommendation or suggestion to invest. I would like to remind you that all assets are evaluated from multiple perspectives and are highly risky, so any investment decision and the associated risk is at the investor’s own risk. We also do not provide any investment advisory services.

