InvestingPro’s Fair Value model captures 63% gain in Steelcase ahead of acquisition

AUDCHF is currently trading around 0.5155, extending its recent losses and hovering just above a critical support zone that has underpinned price action several times in recent months. The pair’s inability to hold above the 0.5220–0.5250 area last week triggered renewed downside momentum, with sellers regaining control amid continued risk aversion and broad CHF strength.
The 15-day and 20-day simple moving averages (at 0.5225 and 0.5227 respectively) have turned lower, confirming a shift in short-term momentum toward the downside. The slope of both averages suggests that bearish sentiment is strengthening after several weeks of range-bound trading.
The support zone between 0.5150–0.5100 now becomes pivotal. A decisive daily close below 0.5100 would signal a clear bearish continuation, exposing the next downside targets at 0.5050 and 0.5000, levels not seen since early-year lows. Conversely, any recovery above 0.5230–0.5250 would ease near-term pressure and could trigger a corrective rebound toward 0.5300.
The RSI (14) is currently near 38, reflecting building bearish momentum but not yet in oversold territory, implying room for further downside before exhaustion sets in.
Overall, the pair maintains a bearish bias below 0.5220, with sellers likely to dominate unless the pair reclaims the 0.5250 zone on a daily closing basis. A break beneath 0.5100 would confirm a deeper continuation toward the 0.5000 handle, while holding above it may lead to a brief technical bounce within the broader downtrend.

AUDUSD is currently trading around 0.6471, stabilizing after a sharp pullback from the recent highs near 0.6600. The decline marks a continuation of the short-term correction phase that began earlier this month, with price now testing a key demand zone around 0.6450–0.6400, an area that has historically acted as strong support.
The 15-day and 20-day simple moving averages (at 0.6417 and 0.6409 respectively) have flattened out after turning lower last week, signalling fading upside momentum and a possible transition into a consolidation or mild downtrend. The crossover remains negative, suggesting sellers still hold a slight advantage in the near term.
The support region between 0.6400–0.6360 remains crucial. A decisive daily close below 0.6360 would confirm a bearish continuation, exposing further downside toward 0.6300 and 0.6250, last seen in mid-June.
Conversely, if the pair manages to reclaim 0.6540–0.6560, it would signal renewed buyer interest and open the way toward 0.6620 and 0.6680, where previous swing highs converge with the descending trendline resistance.
The RSI (14) currently sits near 43, reflecting weakening momentum after a failed attempt to sustain above the 50 midpoint. This suggests that while the downside is not yet overextended, the pair could remain under mild pressure until fresh catalysts emerge.
Overall, the pair maintains a neutral-to-bearish tone, holding just above key support within a broader consolidation range. A break below 0.6360 would tilt the bias firmly bearish, while holding above it could lead to another rebound attempt toward 0.6550–0.6600 in the coming sessions.

EURUSD is currently trading around 1.1672, recovering modestly after a soft pullback earlier in the week. The pair has held firm above the 1.1600–1.1620 support zone, suggesting underlying demand near that level, while upside momentum remains capped below 1.1750, where sellers continue to emerge on rallies.
The 15-day and 20-day simple moving averages (at 1.1663 and 1.1679 respectively) have flattened and are beginning to converge, indicating a loss of directional momentum after several sessions of choppy price action. The broader structure suggests the market is consolidating within a tight range, awaiting a catalyst to establish the next directional leg.
The immediate support area sits at 1.1620–1.1600, which has acted as a key pivot zone multiple times this quarter. A decisive close below 1.1600 would confirm a short-term bearish reversal and open the door for further downside toward 1.1520 and 1.1450. Conversely, sustained strength above 1.1720–1.1750 would shift sentiment back to bullish, paving the way for a retest of 1.1830–1.1880, where the previous swing highs reside.
The RSI (14) is hovering around 49, reflecting a neutral momentum stance—neither overbought nor oversold—consistent with the current consolidation pattern. This suggests that directional conviction remains limited until a clear breakout materializes on either side of the range.
Overall, the pair maintains a neutral-to-bullish tone above 1.1600, but momentum remains subdued. A daily close above 1.1750 would confirm renewed upside traction, while a break below 1.1600 would tilt the balance back in favour of sellers.

GBPUSD is currently trading around 1.2702, stabilizing after a mild rebound from last week’s lows near 1.2620. The pair has been consolidating within a narrow range for several sessions, as traders weigh mixed signals from U.K. economic data and shifting Fed rate expectations. Despite intermittent bounces, the broader structure remains neutral, with the market struggling to build momentum above the 1.2750–1.2800 resistance zone.
The 15-day and 20-day simple moving averages (at 1.2645 and 1.2695, respectively) are nearly flat and converging, reflecting an ongoing lack of directional bias. This alignment signals that the market is in a transitional phase, awaiting a clear breakout to confirm the next move.
Key support is seen at 1.2620–1.2580, where repeated tests over the past month have attracted buyers. A decisive daily close below 1.2580 would confirm a bearish continuation, exposing further downside toward 1.2500 and 1.2420. On the upside, immediate resistance lies near 1.2750–1.2780, followed by 1.2840–1.2900, which corresponds to previous swing highs and the upper boundary of the recent range.
The RSI (14) sits around 50, reflecting neutral momentum and confirming the current consolidation bias. Momentum remains evenly balanced between buyers and sellers, suggesting the next move will depend on a clear technical breakout rather than gradual drift.
Overall, the pair maintains a neutral-to-slightly bullish tone above 1.2620, with range trading likely to dominate in the near term. A daily close above 1.2780 would strengthen the bullish outlook toward 1.2900, while a break below 1.2580 would tilt momentum back in favour of sellers.

USDCAD is currently trading around 1.4174, easing slightly after testing recent highs near 1.4240. The pair has been in a steady uptrend over the past several weeks, supported by broad USD resilience and softer crude oil prices that have weighed on the Canadian dollar. Despite the latest pullback, the broader structure remains constructive as long as price action holds above the 1.4000–1.3970 support zone.
The 15-day and 20-day simple moving averages (at 1.4283 and 1.4313, respectively) remain positively aligned, reflecting a well-established short-term bullish trend. However, the latest candle indicates early signs of profit-taking after the pair failed to break cleanly above the 1.4240–1.4270 resistance area, which has capped gains over the past few sessions.
Immediate support sits around 1.4050–1.4000, where the short-term moving averages and prior breakout zone converge. A daily close below 1.3970 would signal that momentum is fading, potentially triggering a deeper retracement toward 1.3850 and 1.3770. On the upside, sustained strength above 1.4240 would confirm a bullish continuation, opening the door to 1.4350 and 1.4470, key resistance levels from earlier in the year.
The RSI (14) stands near 61.5, indicating positive momentum but showing early signs of moderation after reaching near-overbought territory. This suggests that while the uptrend remains intact, near-term consolidation or a mild correction could occur before any fresh leg higher.
Overall, the pair maintains a bullish bias above 1.4000, with dips likely to attract buying interest. A break above 1.4240 would reaffirm upside continuation toward 1.4350, while a move below 1.3970 would neutralize the short-term bullish setup and shift the focus back toward 1.3850.

USDCHF is currently trading around 0.7927, hovering just above its recent swing lows after another bout of downside pressure. The pair continues to struggle beneath the 0.8000 handle, which has acted as a key pivot zone over recent weeks. The broader trend remains weak, as persistent CHF strength and soft USD demand keep the pair under pressure within a long-term descending structure.
The 15-day and 20-day simple moving averages (at 0.7979 and 0.7975, respectively) are nearly flat but positioned above current price levels, reinforcing short-term bearish control. The repeated rejection from these averages suggests that rallies continue to face selling pressure, while downside tests are met with limited buying interest.
The support area between 0.7900–0.7850 remains critical. A decisive daily close below 0.7850 would confirm a bearish continuation, potentially opening the way toward 0.7750 and 0.7700, marking new multi-month lows. Conversely, a recovery above 0.8000–0.8030 would be needed to neutralize near-term downside pressure and signal a potential corrective bounce toward 0.8100.
The RSI (14) currently stands at 43, reflecting bearish momentum that is not yet oversold. This suggests room for further downside before exhaustion, though momentum remains tepid rather than aggressive.
Overall, the pair maintains a bearish-to-neutral bias below 0.8000, with sellers in control as long as the pair remains capped by the short-term moving averages. A break below 0.7850 would confirm renewed downside momentum, while a sustained move above 0.8030 could trigger a corrective rebound toward 0.8100–0.8150.

USDJPY is currently trading around 151.95, consolidating after a sharp rally that recently pushed the pair toward multi-month highs near 152.20. The latest price action reflects mild profit-taking following the strong bullish run seen earlier this month, with buyers now attempting to defend the 150.80–150.50 support zone.
The 15-day and 20-day simple moving averages (at 151.82 and 151.63, respectively) remain positively aligned and are trending upward, confirming that the broader bias continues to favour the bulls despite the current pause in momentum. The pair remains comfortably above both averages, which should act as dynamic support in the near term.
The support area between 150.80–150.00 is key to maintaining the uptrend. A decisive daily close below 150.00 would signal the start of a deeper pullback, potentially extending toward 148.80 and 147.50, where stronger demand could re-emerge. On the upside, immediate resistance is seen at 152.20–152.50, followed by 153.30, marking the next potential breakout zone should the dollar regain upward traction.
The RSI (14) is currently at 54.36, showing a moderate bullish bias but indicating that momentum has cooled from overbought levels. This suggests the pair could remain range-bound in the short term before attempting a fresh directional move.
Overall, the pair retains a bullish-to-neutral tone above 150.00, with the trend still favouring buyers as long as this zone holds. A break above 152.50 would confirm renewed bullish momentum toward 153.30–154.00, while a sustained move below 150.00 would shift focus to a broader corrective phase.

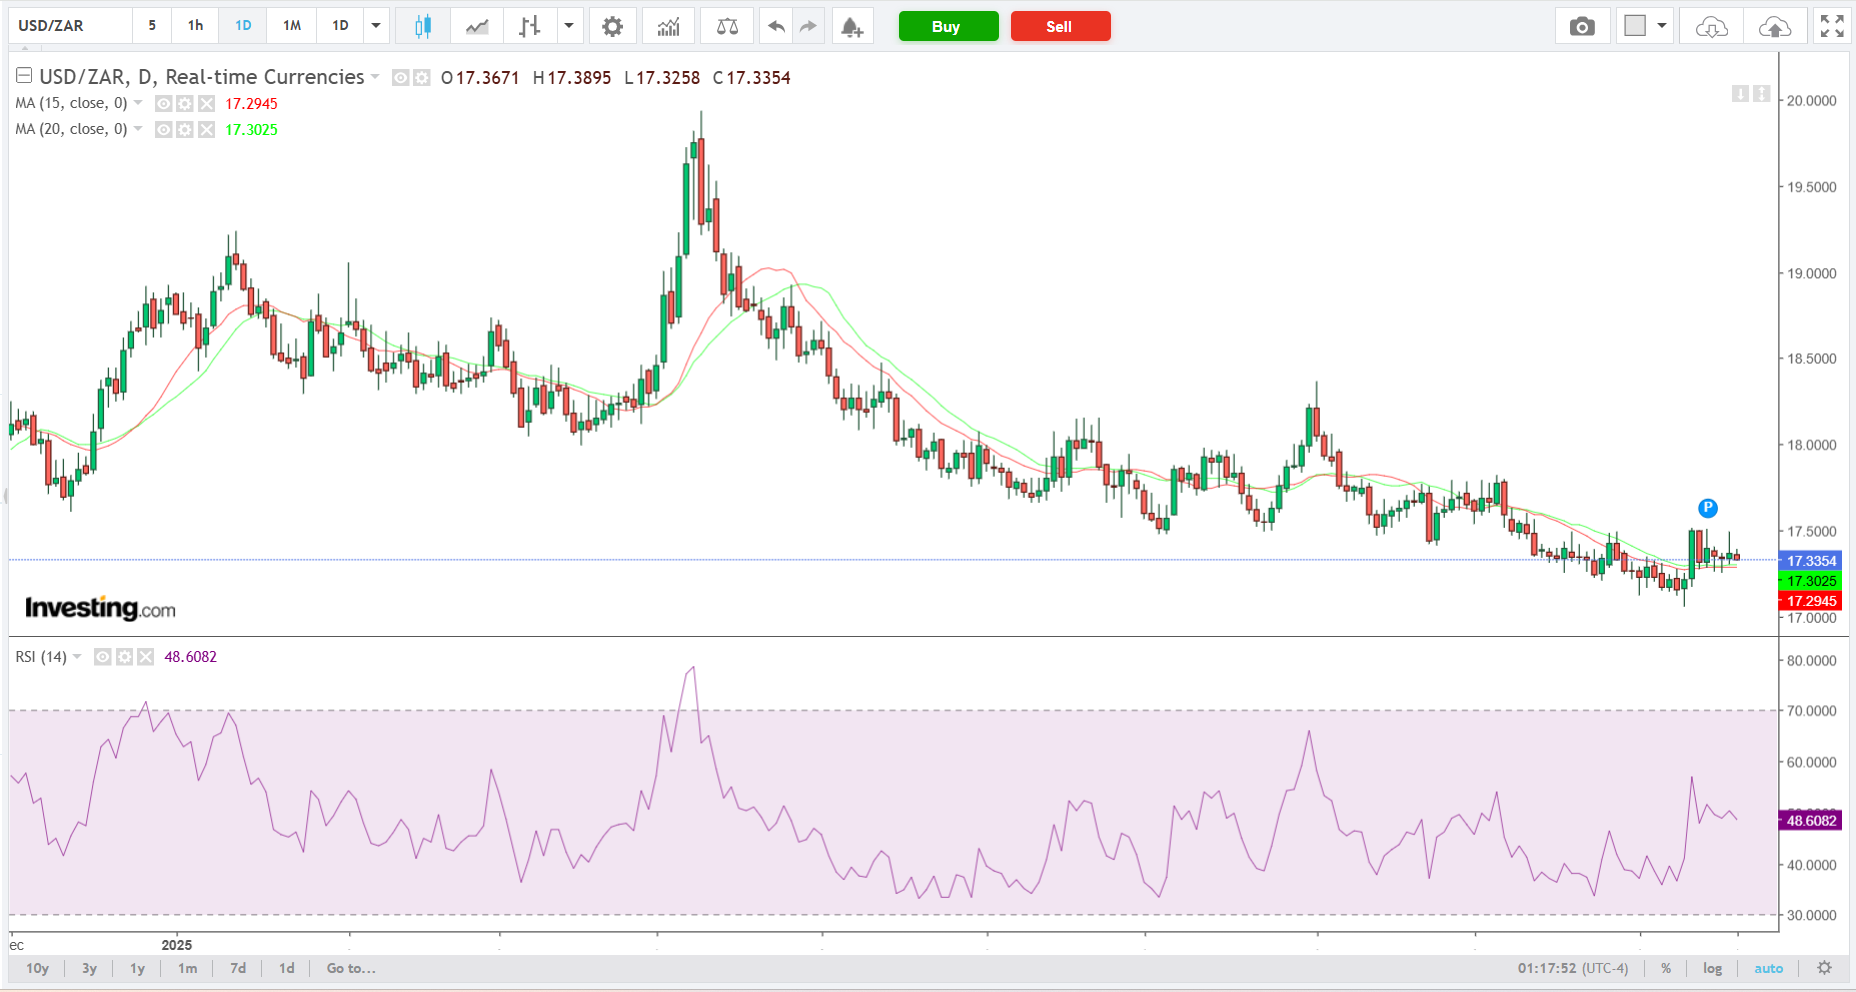
USDZAR is currently trading around 17.33, consolidating after a mild rebound from last week’s lows near 17.05. The pair has struggled to establish clear directional momentum, with price action oscillating in a tight range between 17.20–17.50 over recent sessions. Broader sentiment remains cautious as investors balance a weaker dollar tone against South Africa’s persistent fiscal and energy-related challenges.
The 15-day and 20-day simple moving averages (at 17.29 and 17.30, respectively) are flattening and converging, highlighting the lack of strong directional bias in the short term. The moving averages are providing dynamic resistance, suggesting that the pair remains in a consolidative phase following the earlier downtrend that extended through September and early October.
Immediate support is located at 17.10–17.00, a region that has held firm multiple times this month. A decisive daily close below 17.00 would confirm a bearish continuation, potentially exposing downside targets at 16.85 and 16.60, areas last seen in early 2023. Conversely, a sustained push above 17.50–17.55 would signal a potential upside breakout, paving the way for a move toward 17.80 and 18.00, where previous swing highs align.
The RSI (14) is hovering near 48.6, reflecting a neutral momentum stance consistent with current consolidation. This suggests neither buyers nor sellers have a clear advantage, and the pair may continue to trade range-bound until a directional catalyst emerges.
Overall, the pair maintains a neutral-to-bearish tone below 17.50, with price action capped by flattening moving averages. A break below 17.00 would confirm renewed downside pressure, while a close above 17.55 would tilt the bias toward a short-term bullish reversal.