Top U.S. Defense Stocks to Watch According to Jefferies Analysis
Last week, we discussed that while the market improved sharply, the underlying economic data continues to decline steadily. However, given that the data was not recessionary, the market rallied and took out some key resistance levels. To wit:
“This past week, two reports confirmed the economy is slowing. First, there was the weak GDP report, which showed growth of roughly one percent, after discounting the impact of the trade deficit. Secondly, while the employment number was higher than expected, job growth also slowed.
However, those reports should have tempered market enthusiasm as they reduced hopes for Fed rate cuts. However, the market pushed higher as investors raced to jump back into “risk assets” as the market cleared initial resistance at the 20-DMA and reversed all of the ‘Liberation Day” losses.‘”
The market paused its advance before the Fed meeting on Wednesday, which was remarkably uneventful. The Fed held rates steady as expected and did not provide much guidance regarding its forecast for future rate cuts. However, on Thursday, the Trump administration discussed its first “trade deal” with the UK. Notably, the US has a trade surplus with the UK, making negotiating a trade deal easier.
Nonetheless, announcing a long-awaited agreement gave the market hope that more deals eventually will follow. Unfortunately, other trade deals with actual “trade deficit” countries may be tougher and take much longer to negotiate.
Technically, the market is beginning to repair much of the damage from the “Liberation Day” tariff announcements. However, on Thursday, we made the case that we are still tracing out the 2022 market analogy. As shown in the weekly chart below, in 2022, the market sold off and triggered a weekly moving-average crossover in early March.
Immediately following that selloff, the market rallied back to those longer-term moving averages and briefly broke above. That “bear market rally,” sucked investors back into the market, just to “rug pull” from beneath them. Such is how correctional markets work.
You will notice that the recent selloff has also triggered that same moving average crossover, and immediately coincided with a reflexive rally. The market has broken above the first moving average, challenging the second as investors and the media are increasingly bullish on stocks. Will the market “rug pull” on investors once again? I don’t know.
However, as stated, if we are in a more protracted market correction, the risk is elevated, and we could see another retracement to support before this correction is complete.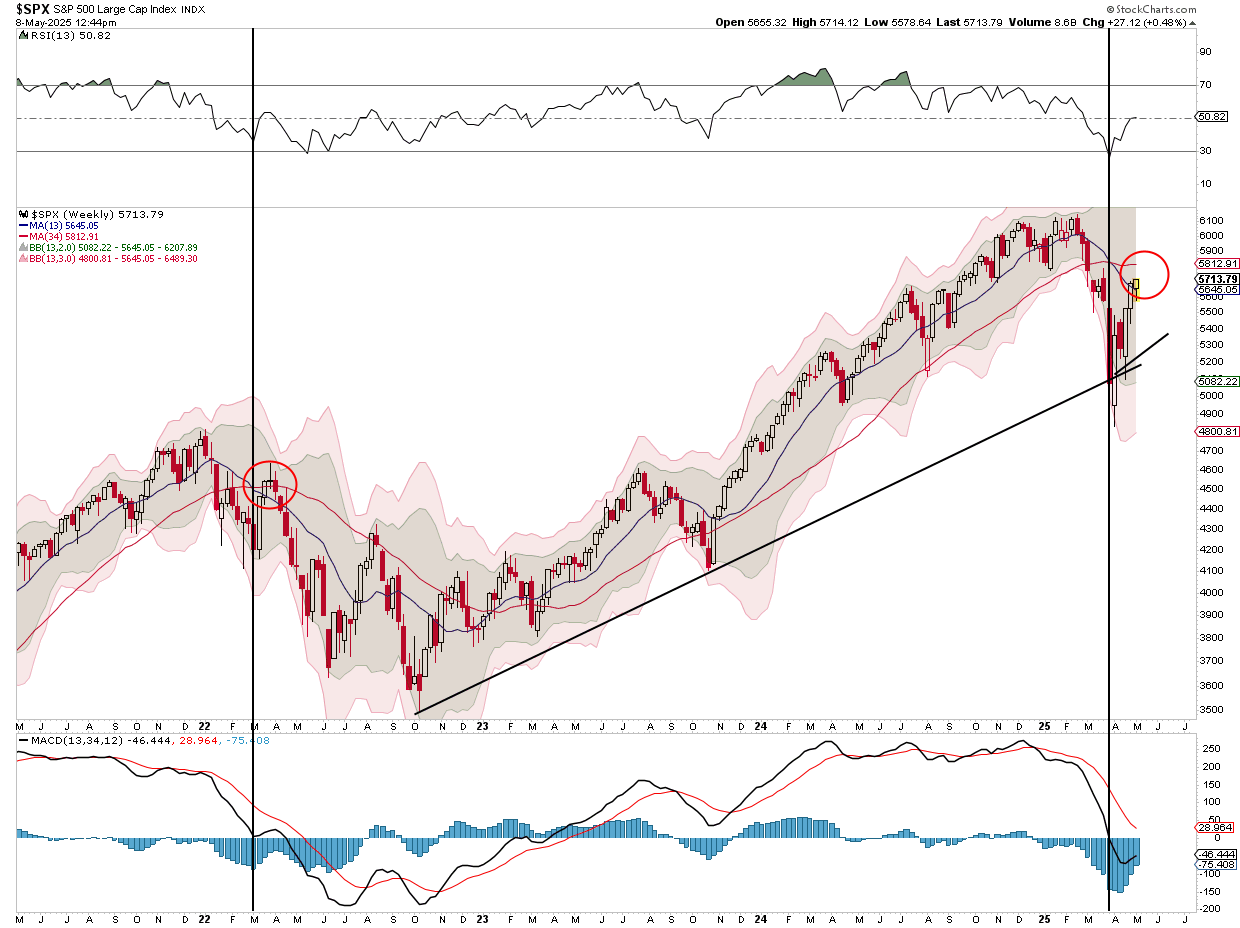
Reasons The Correction Could Be Over, Or Not
It is always difficult to say whether this is a “bear market” rally while you are in the midst of it. In hindsight, these things are easy to identify, and investors have plenty of reasons to play the “could’ve should’ve” game. However, some valid arguments exist about why the recent correction was just that, and may now be over.
- Q1 earnings were above average, which is boosting investor confidence, particularly in the “Mag 7” and related AI stories.
- Investor sentiment is improving from extremely low levels and is not overly bullish.
- Treasury yields are coming down, along with inflationary pressures.
- Uncertainty around tariffs, the main driver of the correction, is rapidly becoming less of a threat.
- Recession risks have fallen sharply with the latest economic data.
- Market valuations have corrected somewhat in recent weeks.
Of course, there are reasons for concern that should also not be dismissed.
- Economic data and consumer confidence are getting weaker.
- Political policy uncertainty remains elevated.
- Despite the recent rally, the market still suffers significant technical damage.
- Investors were not prepared for the recent magnitude of the correction, providing potentially significant sellers wanting to get out. (Trapped longs)
- Monetary policy uncertainty remains elevated.
- Valuations, while reduced, remain well elevated from the long-term median and average.
With balanced risks, investors will likely benefit by remaining cautious and managing risk exposures until a more bullish path is exposed.
Notably, the issue of valuations is essential to consider. Valuations are a function of earnings, and this week’s subject focuses on S&P Global’s recent slashing of earnings estimates for the S&P 500 Index.
Wall Street Vs. S&P Global
It has been an interesting few weeks for the markets and the economy. In early April, the market declined over the threat of tariffs and expectations that such would spark higher inflation rates and potentially push the economy into a recession. Such a backdrop would suggest that corporate earnings would come under attack, and the negative earnings revisions would be expected. Such is what we saw globally as negative earnings revisions from Wall Street analysts spiked higher.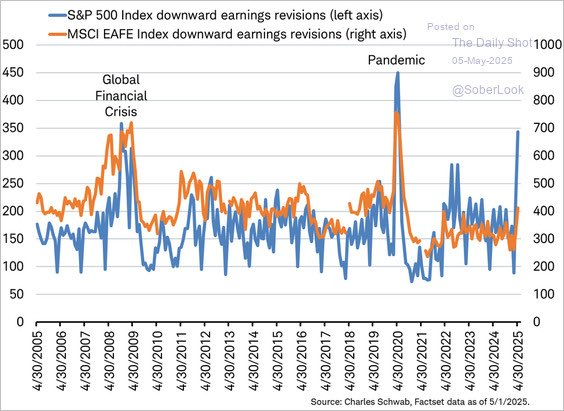
However, we noticed an oddity by S&P Global, the purveyor of the S&P 500 Index, as we wrote on May 3rd:
“While the first quarter earnings season has been okay, earnings over the next few quarters will likely be revised lower. So far, earnings estimates for the S&P 500 index (by S&P Global) remain extremely optimistic. In the last two months, S&P Global has raised its estimates for 2026 GAAP earnings (reported) from $289/share to $292/share. As we have discussed previously, these estimates are exceedingly deviated from the long-term growth trend of earnings.”
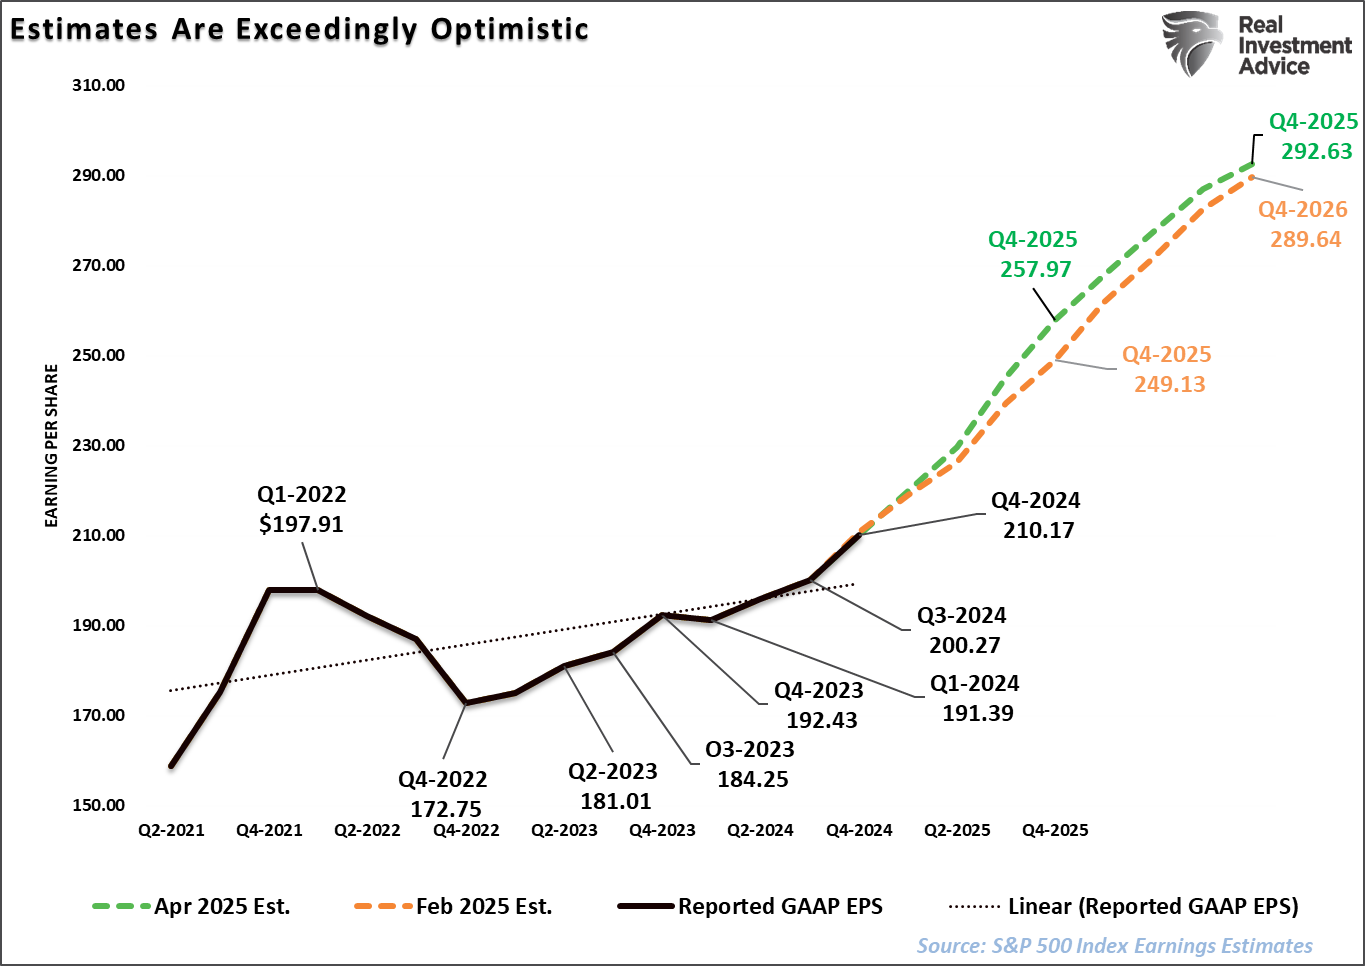
That optimism was stunning, particularly when economic growth rates are slowing. To ensure you understand the importance of that statement, reviewing the historical correlation between economic growth and earnings is crucial.
What Drives Earnings Growth
Historically, GDP growth has closely correlated with corporate earnings growth. Data from the Federal Reserve shows that, since 1948, a 1% increase in real GDP growth has translated to roughly a 6% increase in S&P 500 earnings on average. This relationship underscores why GDP is a cornerstone for assessing earnings trends. We can also see this visually.
“Since 1947, earnings per share have grown at 7.7% annually, while the economy expanded by 6.40% annually. That close relationship in growth rates should be logical, particularly given the significant role that consumer spending has in the GDP equation.” – Market Forecasts Are Very Bullish
A better way to visualize this data is to look at the correlation between the annual change in earnings growth and inflation-adjusted GDP. There are periods when earnings deviate from underlying economic activity. However, those periods are due to pre- or post-recession earnings fluctuations. Currently, economic and earnings growth are very close to the long-term correlation.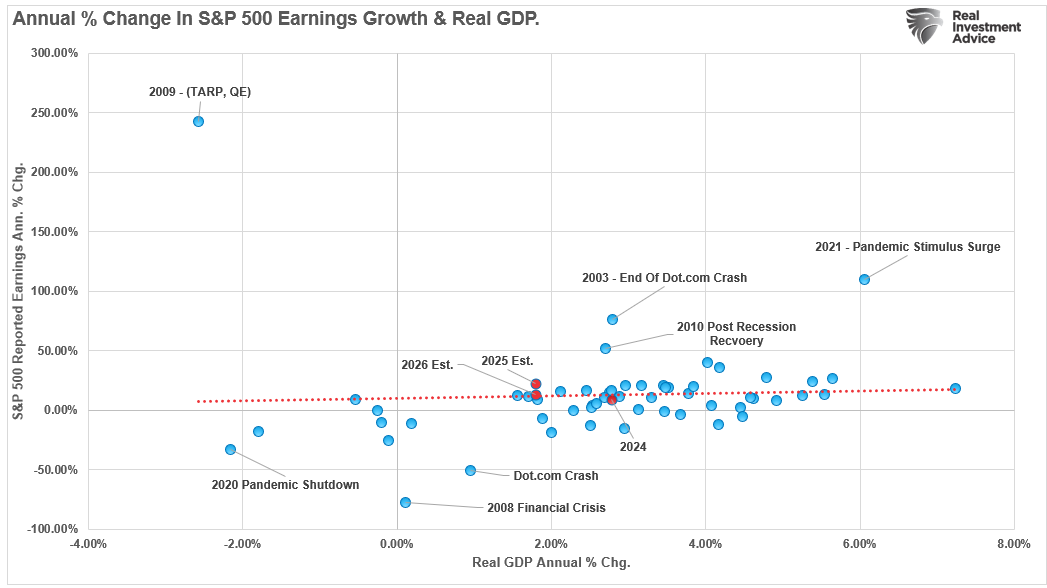
However, that assumes that GDP continues growing at roughly 2% annually. If economic growth deteriorates, as expected, then maintaining corporate earnings at projected levels becomes more difficult. As discussed in yesterday’s #Macroview, there is no evidence that the economy is slipping into a recession. However, if you want to know if an economic decline will evolve into a recession, there is one key factor to consider: consumer spending.
“Consumer spending comprises nearly 70% of the GDP calculation, and everything else, from business investment to imports and exports, is a function of the consumer’s “demand.” In other words, if the consumer is slowing down or contracting spending, businesses will not “invest” in expansion projects, increasing employment, or buying more products for resale. That relationship is shown in the chart below, which compares PCE to jobs and private investment.”
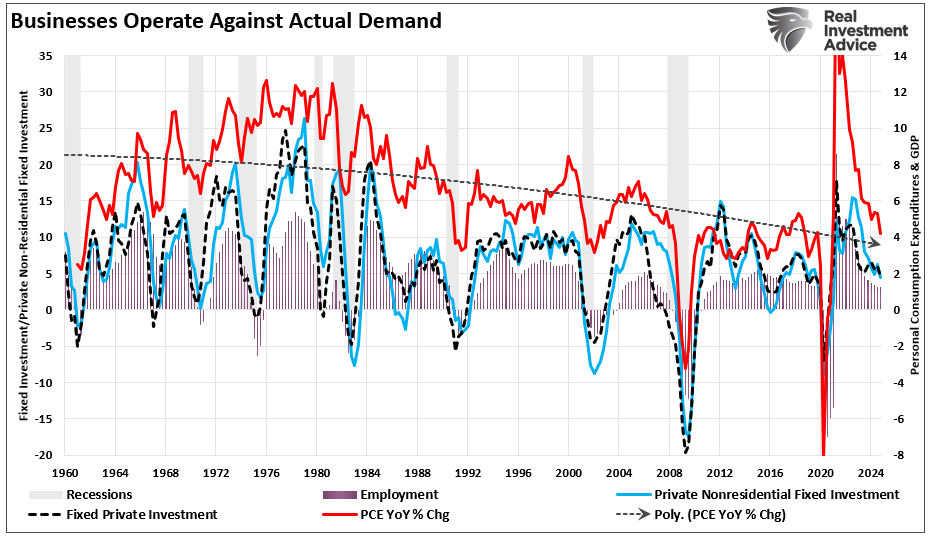
What should be evident is that the economic data is starting to weigh on corporate earnings growth.
S&P’s Negative Earnings Revision Catchup
In other words, as the economy slows, consumer demand falls. The chart below shows real GDP compared to the annual rate of change in GAAP-reported earnings. Notice the correlation.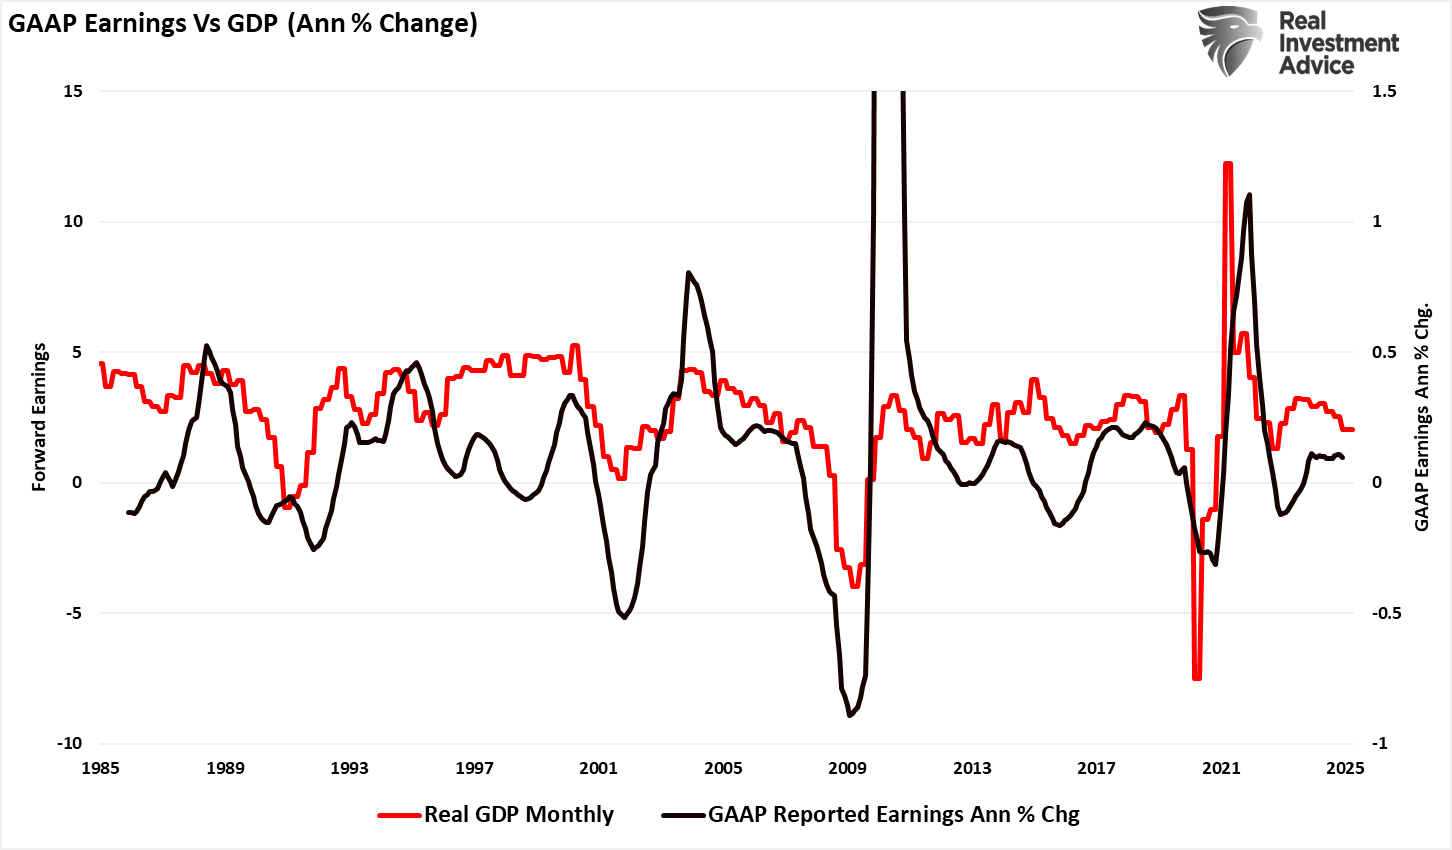
Given the slowdown in economic growth rates, it is unsurprising that, as of May 1st, S&P Global finally acquiesced and revised earnings estimates lower. However, this wasn’t a mild earnings revision but a slashing of estimates from their April 15th expectation of $292/share in 2026 to just $274. Furthermore, full-year 2025 reported earnings estimates were cut by nearly $20/share from $258/share to just $238/share.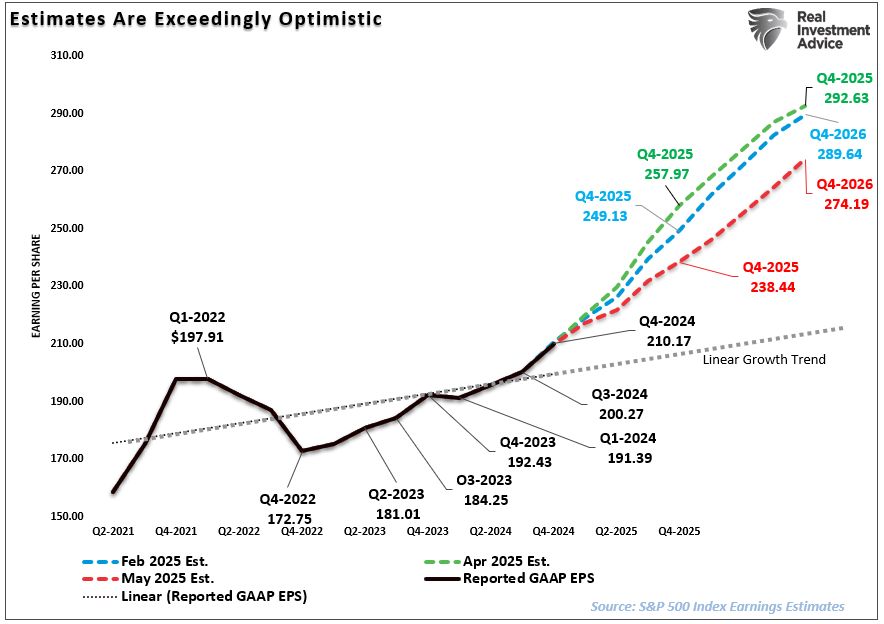
While this is S&P Global’s first negative earnings revision for the S&P 500 index, it likely won’t be the last. The current linear growth trend for S&P 500 earnings is around $220/share in 2026. As shown in the chart below, earnings growth tends to revert to the long-term trend.
You should notice in the chart below that since 1936, earnings haven’t stayed at the top of the long-term growth trend channel for long. Historically, either economic recessions or some event reverses earnings from the peak to the trough of the channel regularly. The current exponential growth trend for earnings is $195/share.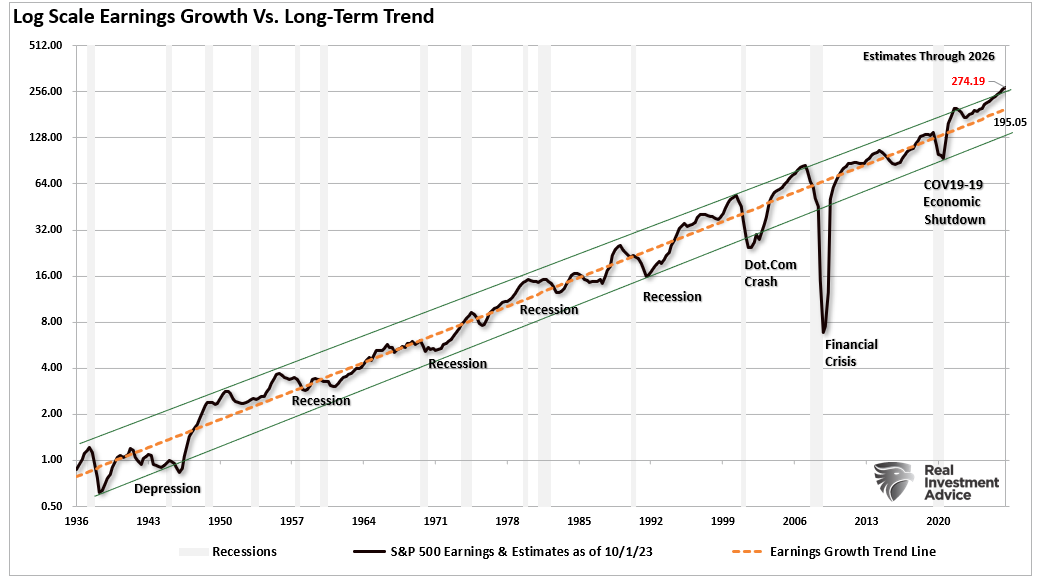
The chart below better visualizes that deviation from the long-term growth trend. (The chart includes the latest revision of negative earnings.)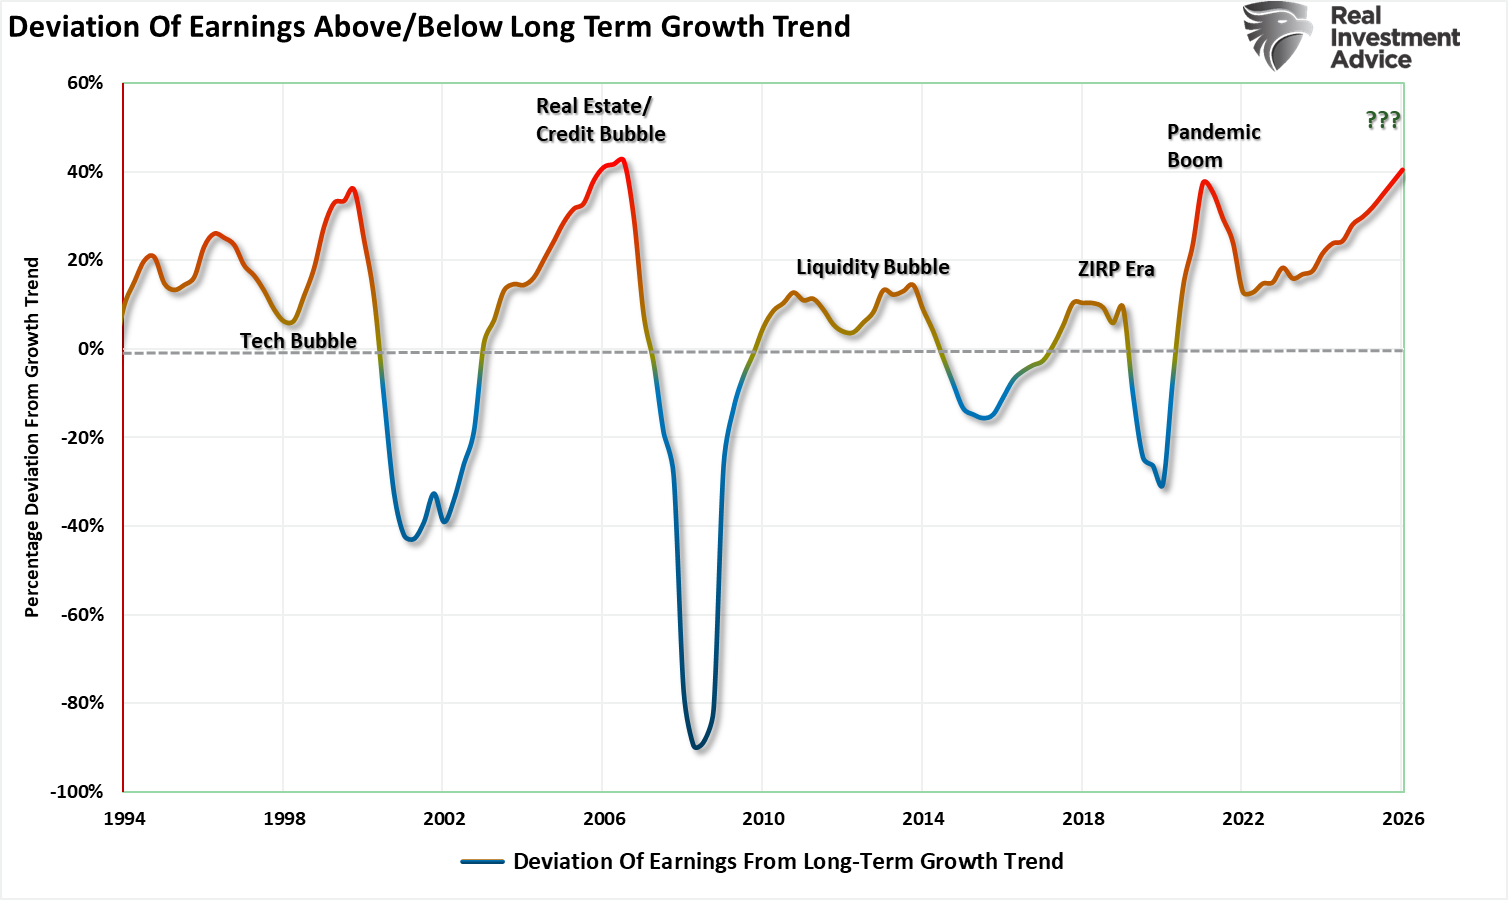
In other words, despite S&P Global’s earnings revision, estimates remain overly optimistic despite slower economic growth. However, such is the problem that investors regularly face with analysts’ forecasts.
The Historical Problem Of Analyst Market Forecasts
Here is the critical question for investors: “If the market is priced based on future earnings expectations, then how reliable are those estimates?” The chart below is from Yardeni Research and shows the evolution of earnings forecasts over time. You will notice that analysts’ initial forecasts were wrong in almost every case.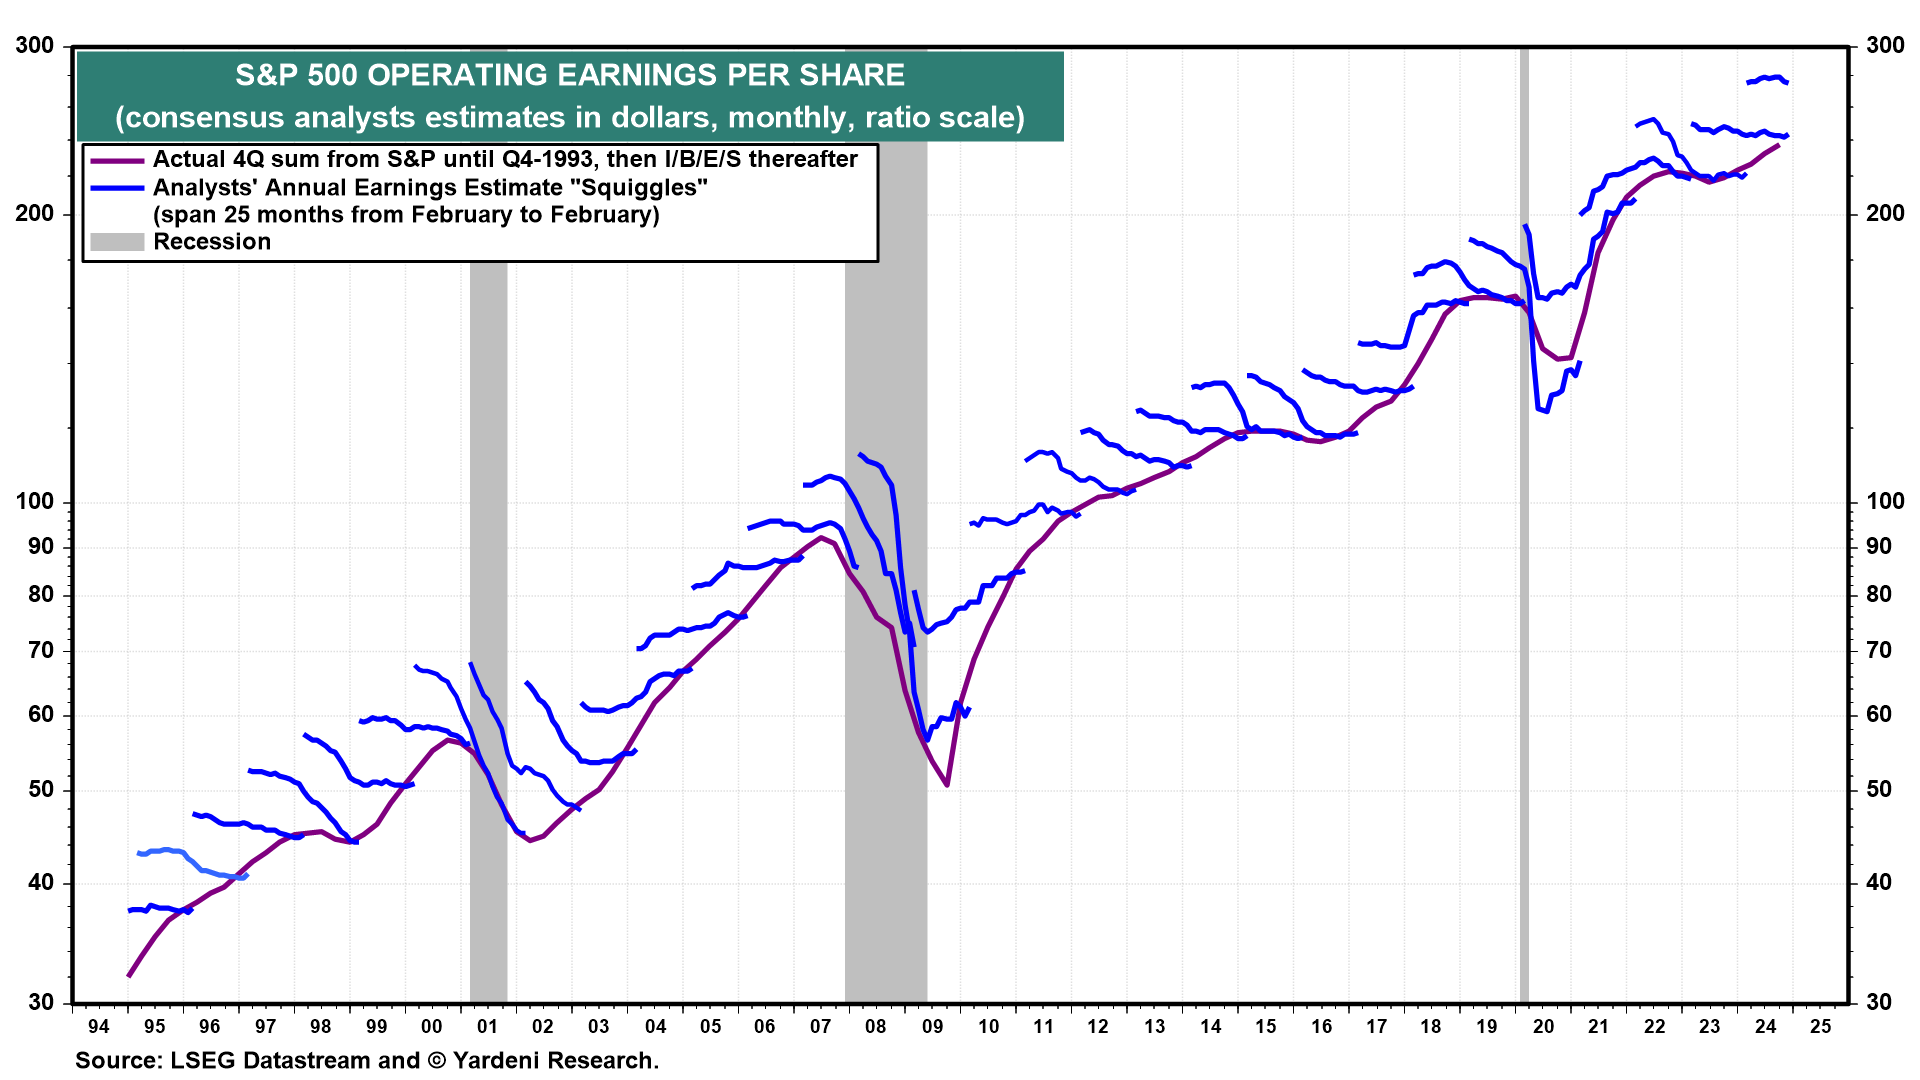
This tendency to overshoot earnings growth has been attributed to several factors:
- Delayed Reaction to Macroeconomic Signals: Analysts have tended to underestimate the lag effect of monetary tightening on corporate profits. Additionally, initial forecasts are often based on historical growth patterns but do not always reflect sudden economic or policy changes.
- Corporate Optimism: Companies often guide higher during earnings calls, buoying analyst expectations. Furthermore, as the actual economic environment proves more difficult, earnings usually fail to meet these expectations, resulting in post-reporting season disappointments.
- Investment Banking Needs: Wall Street is in the business of selling products. Therefore, increased estimates lower forward valuations, improving investor appetites, particularly for high-growth companies. A previous study showed that the accuracy and timeliness of earnings forecasts are the LEAST important for analysts.
In other words, if you bought stocks at the beginning of virtually every analyst’s annual forecast, based on the assumption that earnings would grow, you overpaid for investments virtually every given year. However, in most cases, you make money anyway, so why worry about it?
The reason to worry is that over-estimation eventually leads to mean-reverting events, like now.
Valuations Remain An Issue
The biggest single problem with Wall Street today and in the past is the consistent disregard for the possibilities of unexpected, random events. In a 2010 study by the McKinsey Group, they found that analysts have been persistently overly optimistic for 25 years.
During the 25-year time frame, Wall Street analysts pegged earnings growth at 10-12% a year when, in reality, earnings grew at 6%, which, as we have discussed in the past, is the economy’s growth rate. This is why using forward earnings estimates as a valuation metric is so incredibly flawed—the estimates are always overly optimistic.
Here is a good example. Q1 estimates started at $226/share. However, by the time Q1 earnings reports were nearing completion, earnings were closer to $217/share. Therefore, if you were buying stocks based on future earnings expectations of $226/share, you overpaid for the value you received.
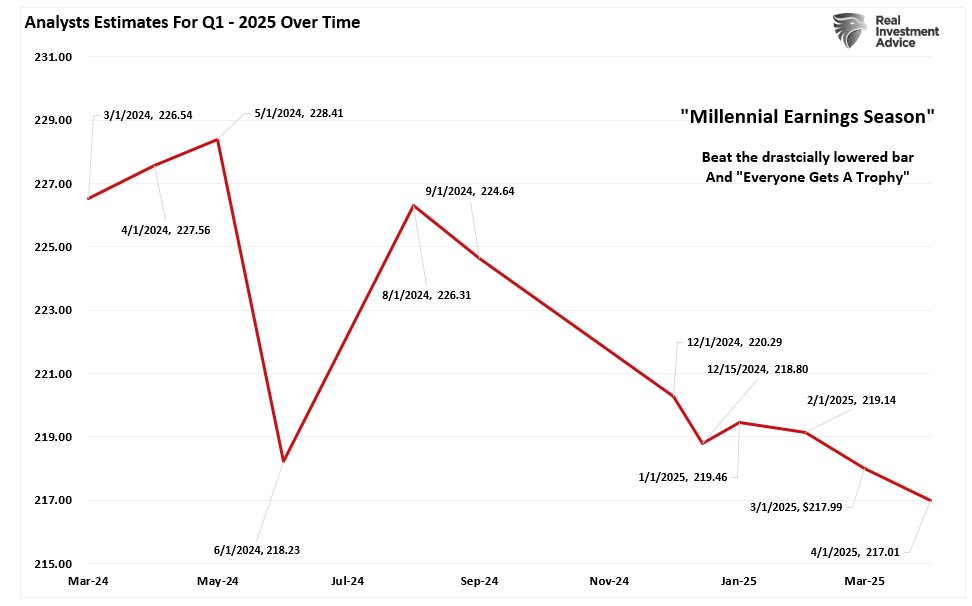
Now, earnings into 2026 are being revised sharply lower, so valuation risk remains elevated. Valuations recently declined as the “P” fell, but the “E” remained stable. Now the “P” is rising as the “E” declines, increasing the valuation issue for investors.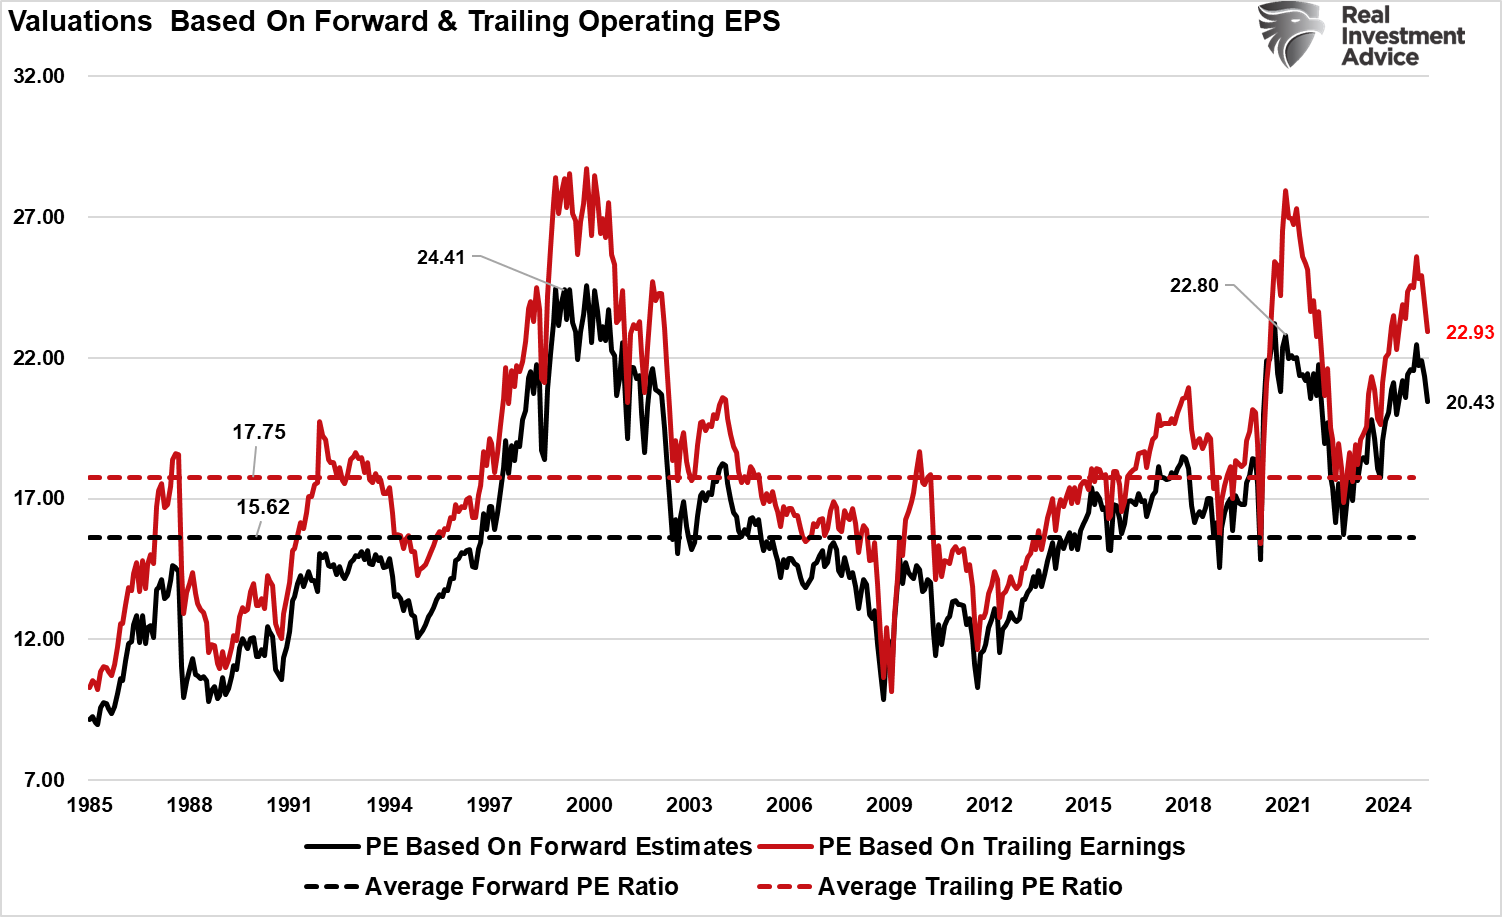
As stated above, the market will face many headwinds in 2025. However, three key factors must exist to sustain historically high earnings growth and record corporate profitability.
- Economic growth must remain more robust than the average 20-year growth rate. (Low probability)
- Wage and labor growth must reverse (weaken) to sustain historically elevated profit margins.(Low probability)
- Both interest rates and inflation need to decline to support consumer spending. (Challenging but possible)
While analysts are optimistic about economic and earnings growth in 2025, the potential risks to those forecasts and further downward earnings revisions may pose challenges.
We suggest remaining somewhat cautious with risk-taking.
How We Are Trading It
We continue to manage our portfolios in a manner that allows us to participate in the market increase but still hedge against underlying risk. As such, we suggest rebalancing risk as necessary and adjusting portfolio holdings to provide some hedge against a sudden pickup in volatility.
While the number of stocks trading above their 50 and 200-DMAs is rising, indicating more substantial breadth and participation in the market, it also serves as a warning. As shown, previous higher levels of participation also coincide with market peaks and short-term corrections.
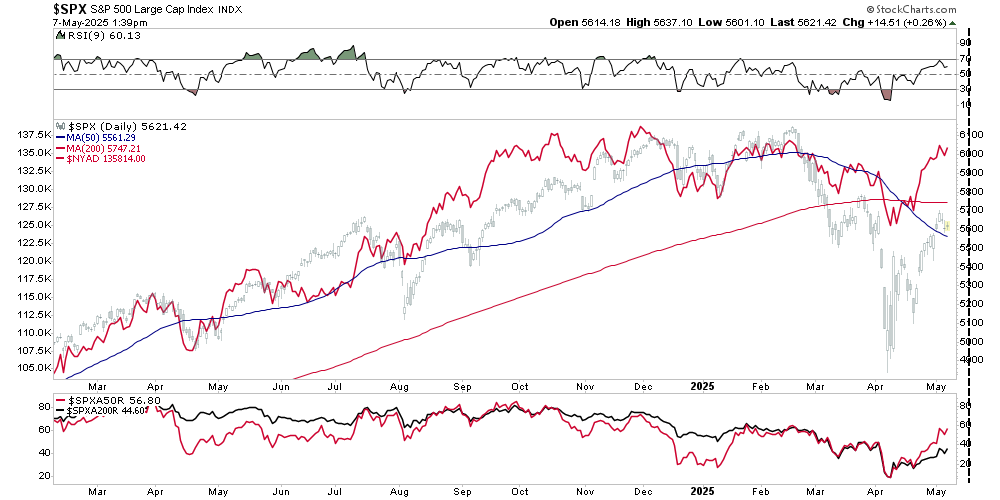
The trick to navigating markets is not trying to “time” the market to buy or sell the exact bottom or top. That is impossible. Successful long-term management is understanding when “enough is enough” and being willing to take profits and protect your gains.
That is our situation for many stocks after the robust rally from the recent lows. With markets within a corrective process and trading below long-term moving averages, the opportunity to rebalance risk and reduce portfolio volatility is available. However, many investors will opt to “hope” for further gains, but will sell at lower levels if the correction continues.
That advice remains relevant this week as we head further into May, which wraps up the seasonally strong period of the year. A pickup in volatility, some surprises, and disappointments will be the nature of the market as economic and tariff-related news rules the headlines. The trick will be to navigate the outcome without making emotionally driven decisions.
Continue to follow the rules and stick to your discipline. (Read our article on “What Is Risk” for a complete list of rules)

(Note: The allocation below contains a 5% short S&P 500 position in the ETF allocation.)
Have a great week.
