Moody’s downgrades Senegal to Caa1 amid rising debt concerns
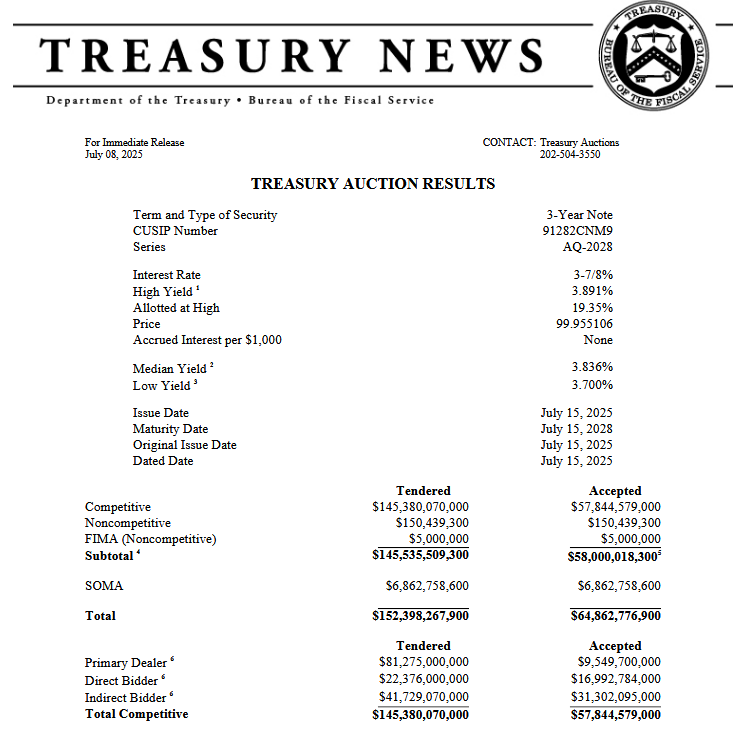
With the amount of Treasury debt now in sharp focus, it’s worth cutting through the technical jargon used by the media to quantify demand at Treasury auctions. This summary of key Treasury auction terms will help you judge the auctions for yourself and not rely on others.
The Treasury releases the statement below with each auction. Bond investors should be acquainted with the following:
- Auction yield versus “when issued yield”: Bonds set to be auctioned trade before the auction in what is called the when-issued or WI market. One of the most essential readings is a comparison of the auction yield versus the WI yield. When the auction yield is less than the WI yield, that often means that the auction had good demand. Conversely, a yield higher than the WI market can indicate weakness. The WI rate is not found in the Treasury release below.
- Bid to Cover: This measures the ratio of the amount of bids (tendered) to bids accepted. The higher the ratio, the greater the demand and vice versa.
- Primary Dealer: The Treasury has 24 primary dealers. These banks bid in all auctions and make markets for Treasury securities. Auctions are generally better when primary dealers take fewer bonds from the auction. This signals better demand from end-user investors.
- Direct and Indirect Bidders: Direct bidders bid for bonds directly at the Treasury auction site. This can include primary dealers if they are purchasing for their own accounts, rather than for trading purposes or other clients. Indirect bidders bid through primary dealers. A significant portion of this category is often comprised of foreign buyers. The more direct and indirect buyers, the better the auction, and vice versa.
Further down, we review yesterday’s ten-year auction to provide a clearer understanding of the information above.
What To Watch Today
Earnings

Economy

Market Trading Update
Yesterday, we updated the market from a technical perspective, and not much has changed recently. However, as I noted this morning during our Before The Bell segment, risk is clearly on the rise again. Despite renewed concerns about tariffs, volatility continues to drop as investors refuse to hedge against a potential correction. Historically, such complacency precedes short to intermediate-term market corrections, but it can often take some time to develop.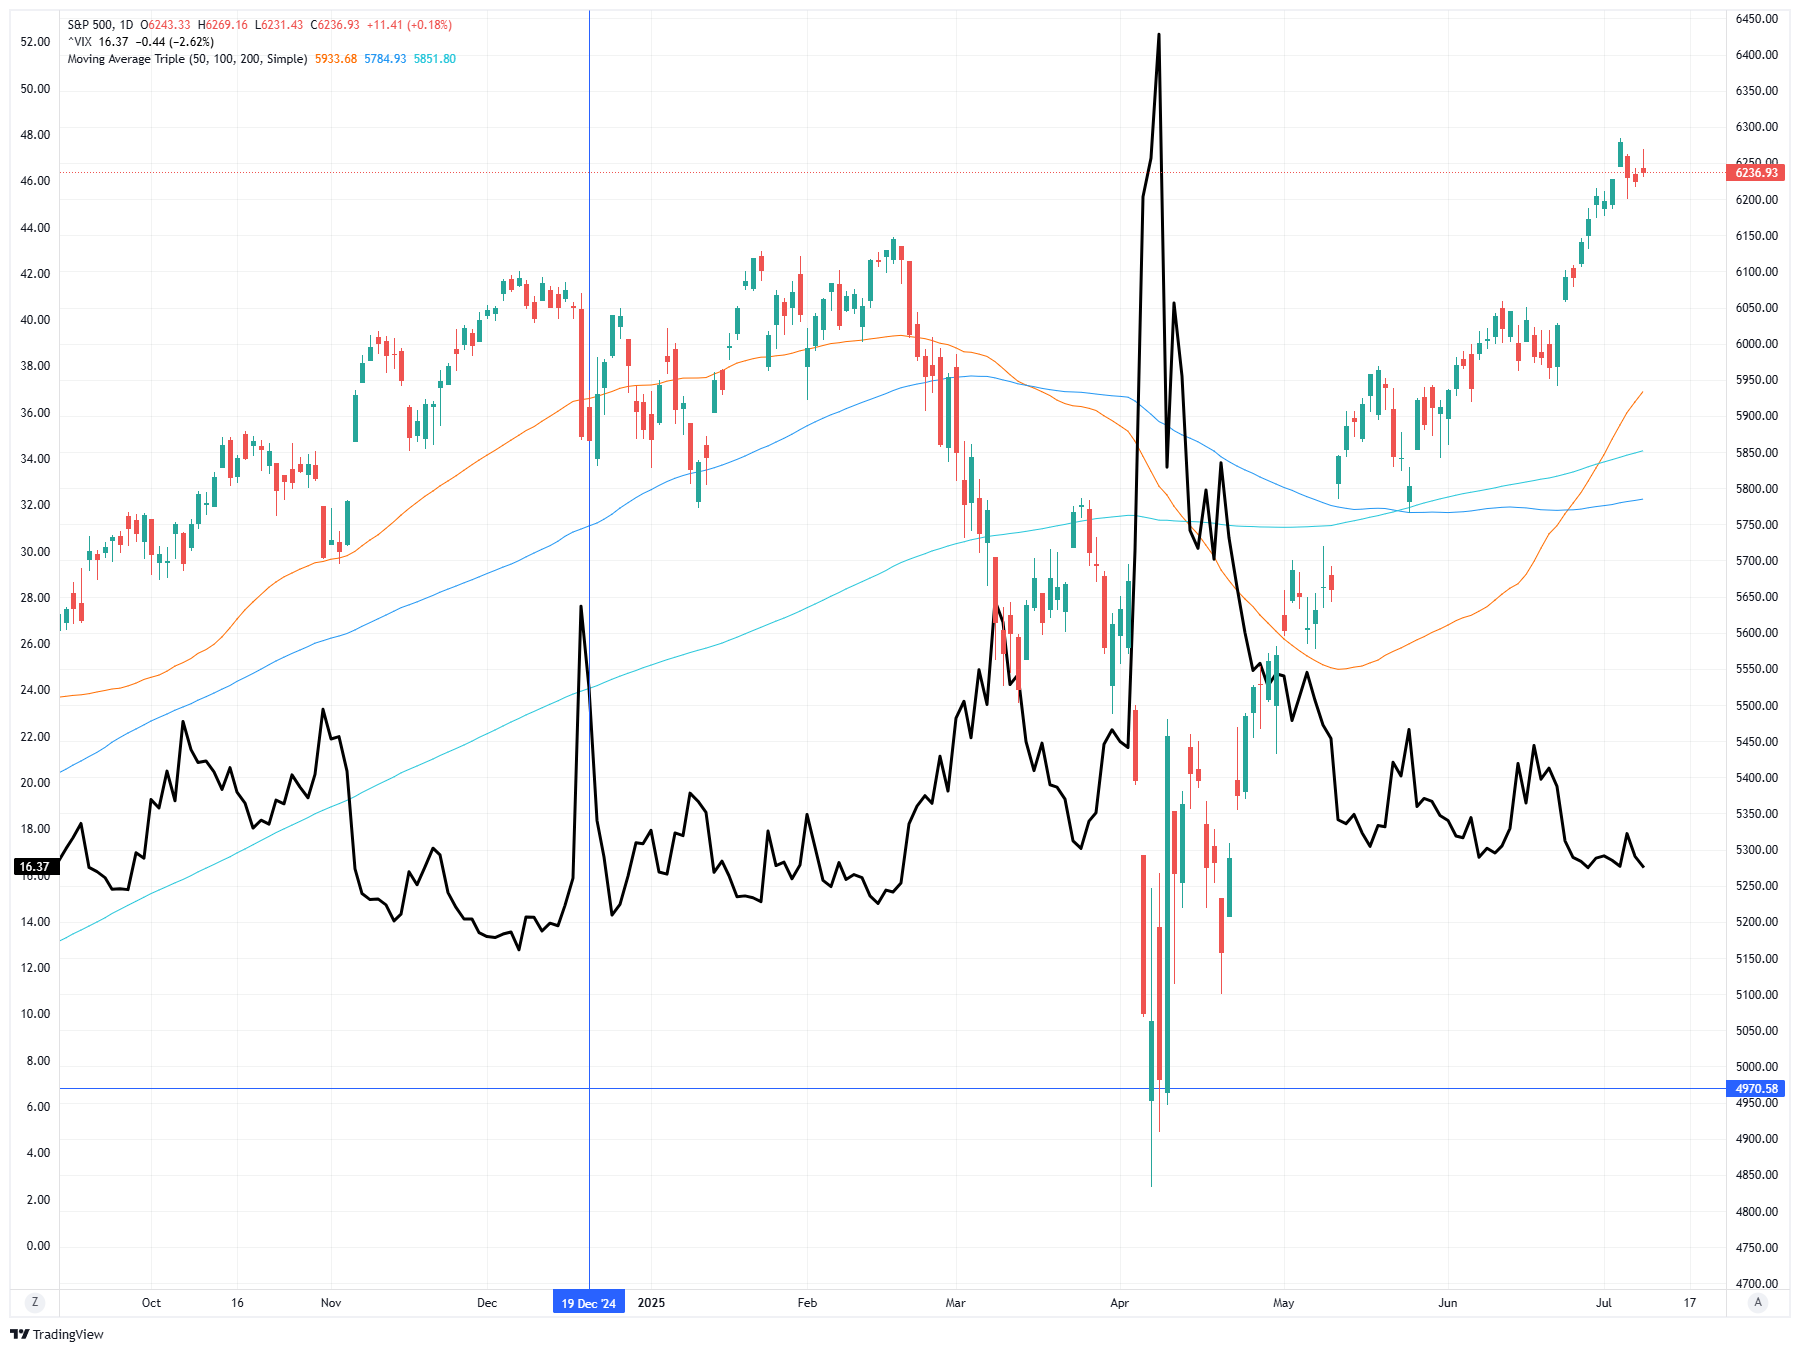
Furthermore, the chase for momentum has been incredible as investors have taken on risk in various forms, from call options (at a record volume level) to leveraged ETFs. While such activity is what drives a “momentum chase,” when it breaks, it works in reverse just as well.
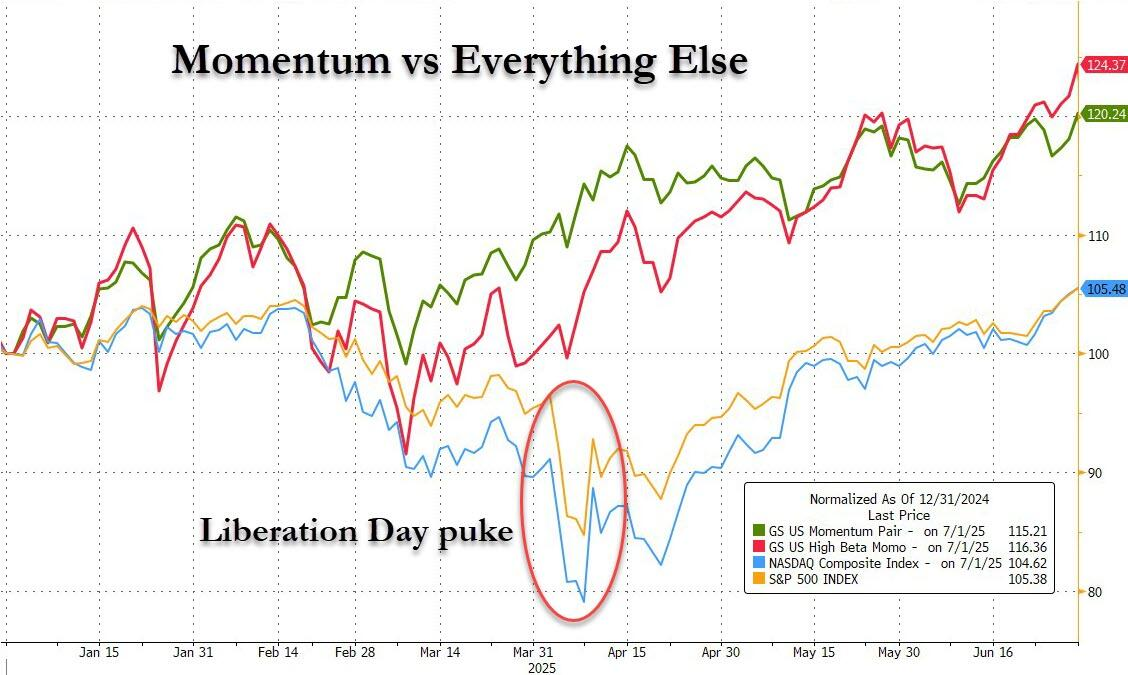
However, we are starting to see some cracks in that particular trade, which could result in a more significant market correction over the next few months. Notably, the timing of that potential unwind is the most difficult. The problem with momentum is that, like a speeding locomotive, it is tough to stop. As such, it can take some time for the cracks in the “momo” trade to show up in the broader market. Given the high levels of complacency, there seems to be a more substantial risk of something breaking today, versus what we saw back in early April.
- Raise cash allocations modestly to take advantage of potential pullbacks in late July or August.
- Utilize trailing stop-losses on aggressive trades, particularly in leveraged ETFs or speculative names that have already seen sharp moves.
- Avoid overexposure to crowded trades, especially single-stock themes and high-beta names vulnerable to profit-taking.
- Monitor macro developments, including Fed commentary, PCE inflation data, and geopolitical headlines, as catalysts for sentiment reversal.
With the S&P 500 near all-time highs but doing so on narrow participation and stretched technicals, now is the time to focus on disciplined execution, thoughtful asset rotation, and proactive risk control. For now, it seems prudent that managing downside risk is just as crucial as capturing upside momentum.
Trade accordingly.
Deciphering Yesterday’s Ten-Year Auction
On Wednesday, the Treasury auctioned off $39 billion of a ten-year note. This note has a maturity of 9 years and 10 months. It is an addition or “reopening” of a note that was auctioned initially with a full 10-year maturity. The graphic below, courtesy of @exantedata, helps put the auction results into context versus the prior 50 auctions. The blue diamonds represent the current readings, and the horizontal lines within the colored boxes are the averages. The colored space represents the range between the middle 50% of the data. The space above and below the colored boxes, up to the vertical lines, represents the best or worst 25% data, respectively.
- The yield at the auction was 4.362, about a third of a basis point below where the bond was trading in the WI market.
- The bid to cover was 2.61, which is in the upper 25% of the last 50 auctions.
- Direct bidders bought a higher percentage of bonds in this auction than in any of the last 50. To wit, investment funds took down their second-highest allocation of ten-year notes on record.
- Primary dealers took down a below-average portion of the bonds.
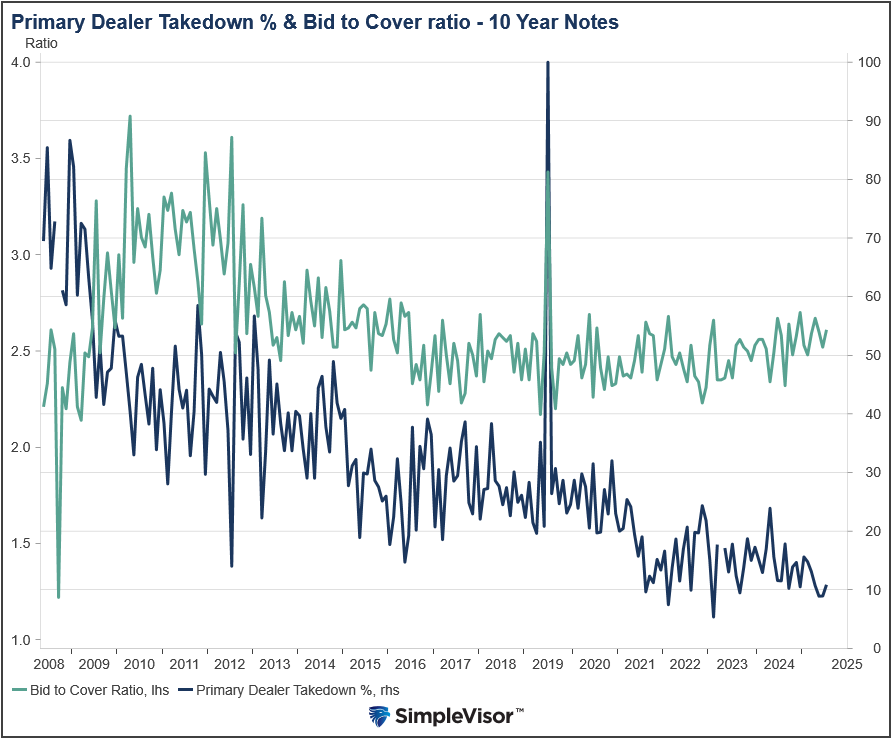
Bottom line, as all four bullet points describe, it was a very good auction. The second graph below shows that primary dealers have been taking increasingly smaller portions of ten-year auctions. Despite the hostile rhetoric, this suggests that investors are meaningfully buying bonds at the auctions.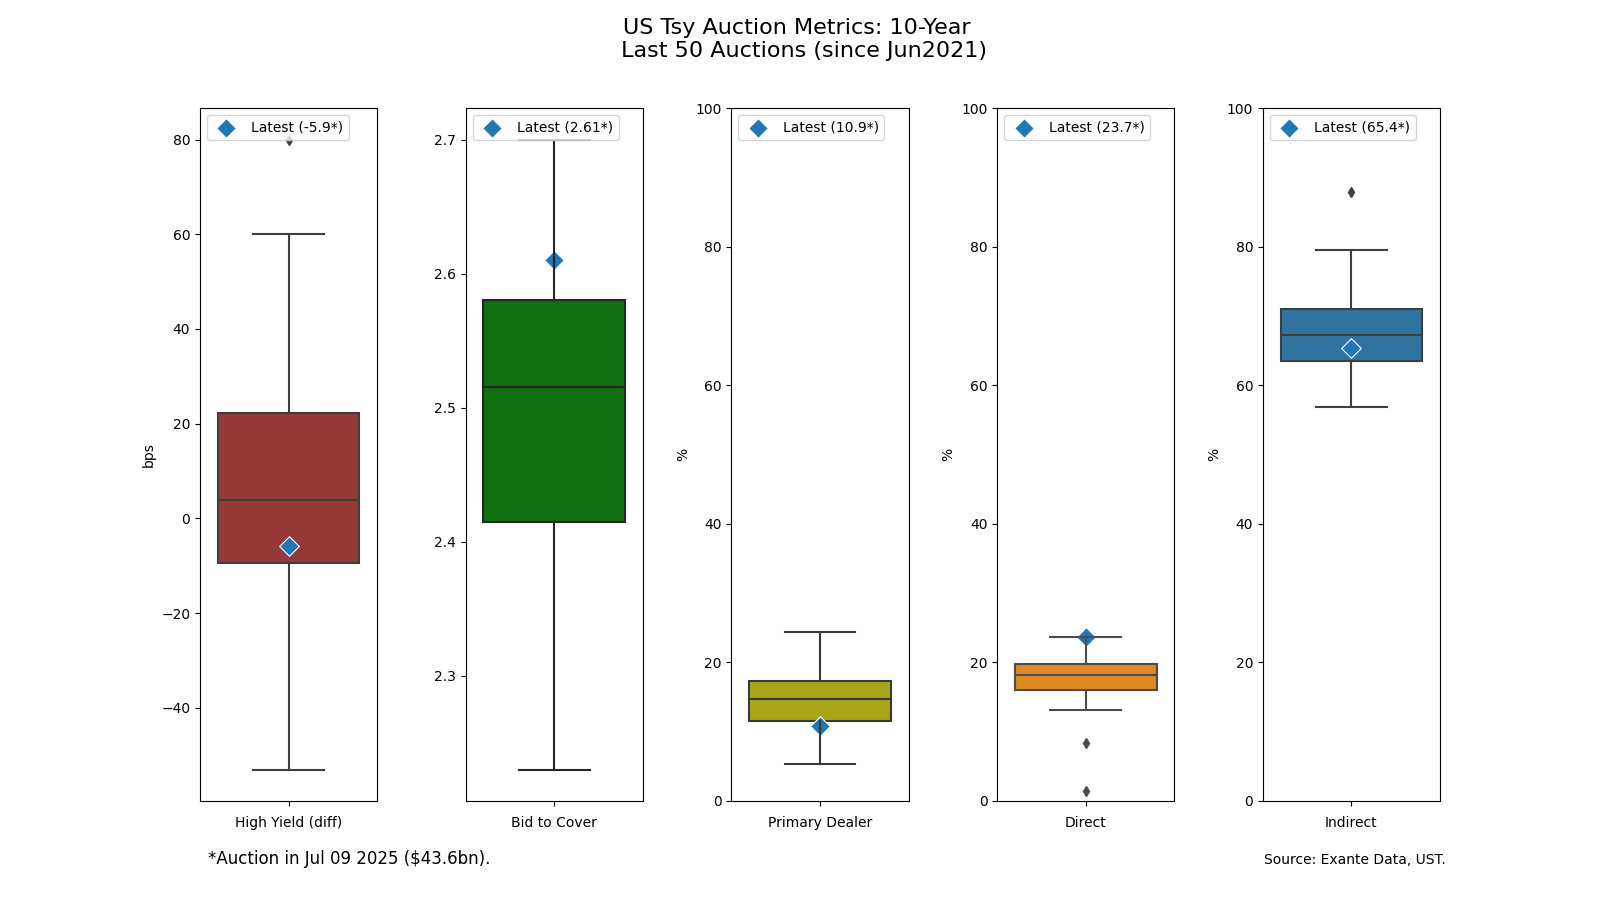
Tweet of the Day
