Asia FX moves little with focus on US-China trade, dollar steadies ahead of CPI

Introduction & Market Context
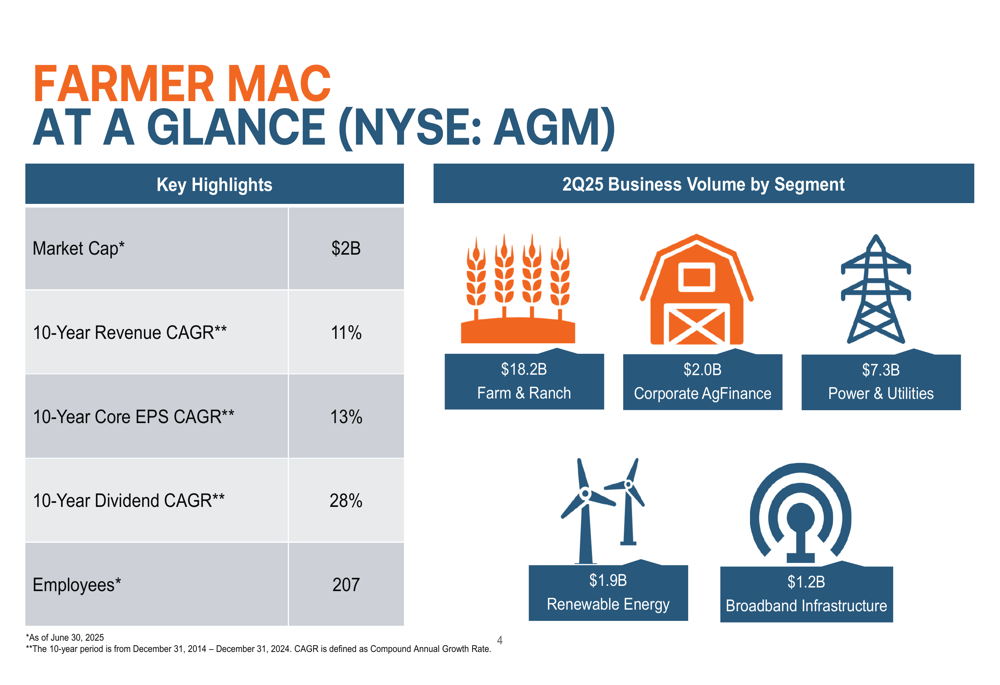
Federal Agricultural Mortgage Corporation (NYSE:AGM), commonly known as Farmer Mac, presented its second quarter 2025 results on August 7, 2025, highlighting continued growth across its diversified business segments. The company, which maintains a market capitalization of $2 billion, has demonstrated consistent performance with a 10-year revenue CAGR of 11% and core earnings per share CAGR of 13%.
The presentation comes as Farmer Mac’s stock trades at $172, down slightly by 0.44% on the day of the presentation, and below its 52-week high of $217.14. Following strong Q1 2025 results that exceeded analyst expectations, investors are closely monitoring the company’s ability to maintain momentum in a challenging economic environment.
Quarterly Performance Highlights
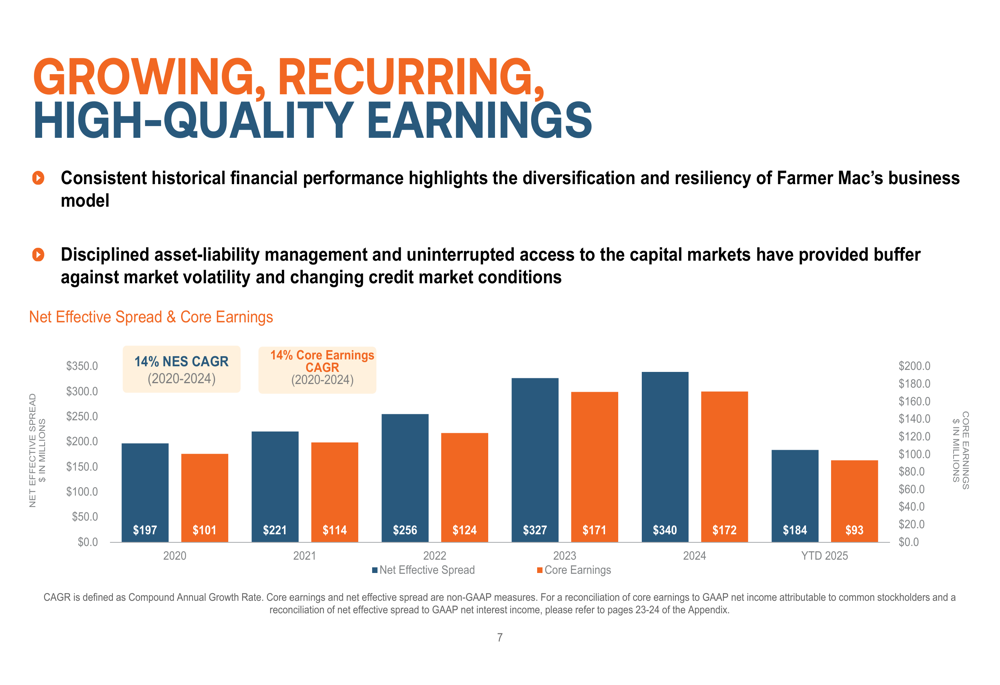
Farmer Mac reported solid financial results for Q2 2025, with year-to-date core earnings reaching $93.3 million and core earnings per diluted share at $8.51. The company’s net effective spread for the first half of 2025 stands at $183.9 million, representing a yield of 1.18%.
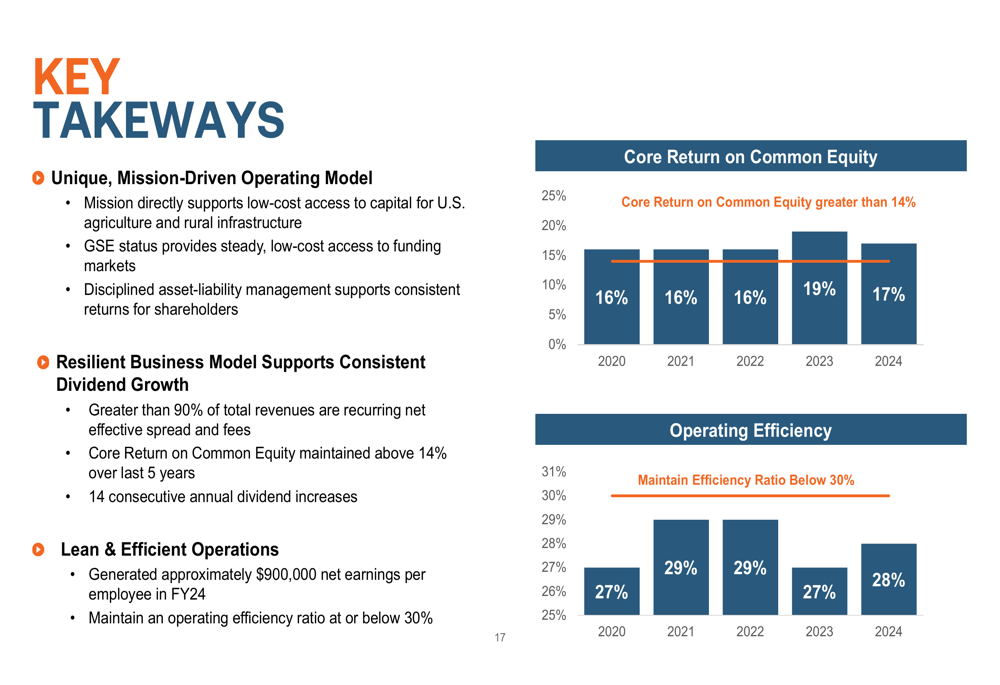
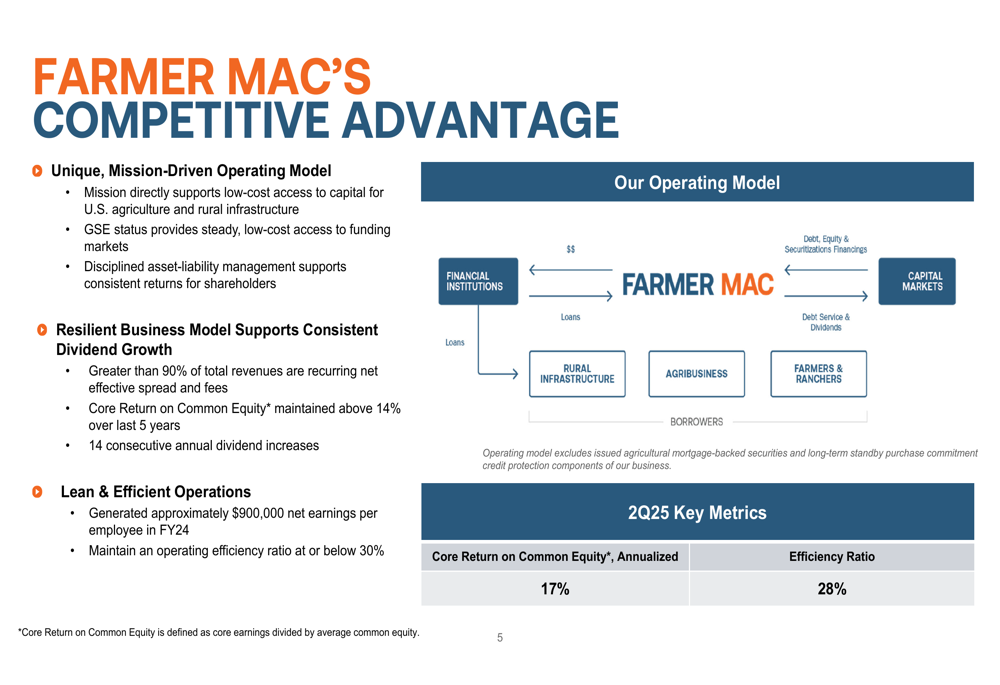
The company’s performance metrics demonstrate its operational efficiency, with a core return on common equity of 17% and an efficiency ratio of 28% for Q2 2025. These figures align with Farmer Mac’s historical performance, as shown in the following chart:
Total (EPA:TTEF) outstanding business volume reached $30.6 billion as of June 30, 2025, distributed across five key segments: Farm & Ranch ($18.2B), Power & Utilities ($7.3B), Corporate AgFinance ($2.0B), Renewable Energy ($1.9B), and Broadband Infrastructure ($1.2B). This diversification has been a key factor in the company’s ability to generate consistent earnings growth.
As illustrated in the following overview, Farmer Mac continues to leverage its GSE status and mission-driven operating model to provide low-cost capital to rural America:
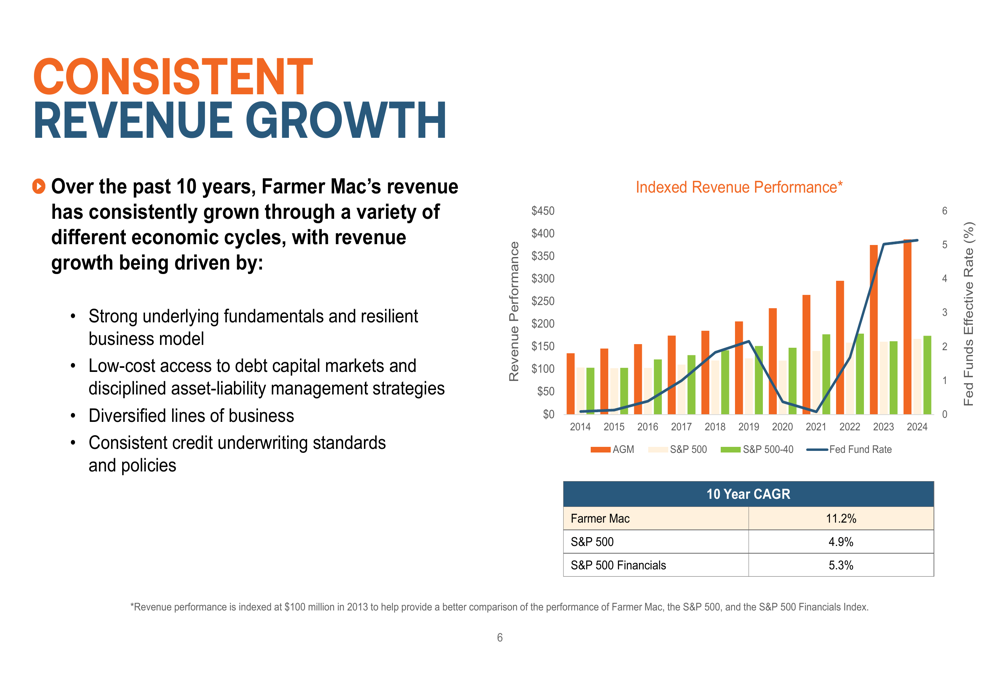
The company’s revenue growth has consistently outperformed major market indices over the past decade, with a 10-year CAGR of 11.2% compared to 4.9% for the S&P 500 and 5.3% for S&P 500 Financials. This performance is visualized in the following chart:
Business Segment Performance
Farmer Mac’s diversified business model continues to drive profitability across segments. The company’s net effective spread and core earnings have shown consistent growth from 2020 through the first half of 2025, as demonstrated in the following chart:
Each business segment contributes to overall profitability through both spread-based and fee-income products. The segment profitability breakdown reveals varying net effective spreads and risk-adjusted returns across the portfolio:
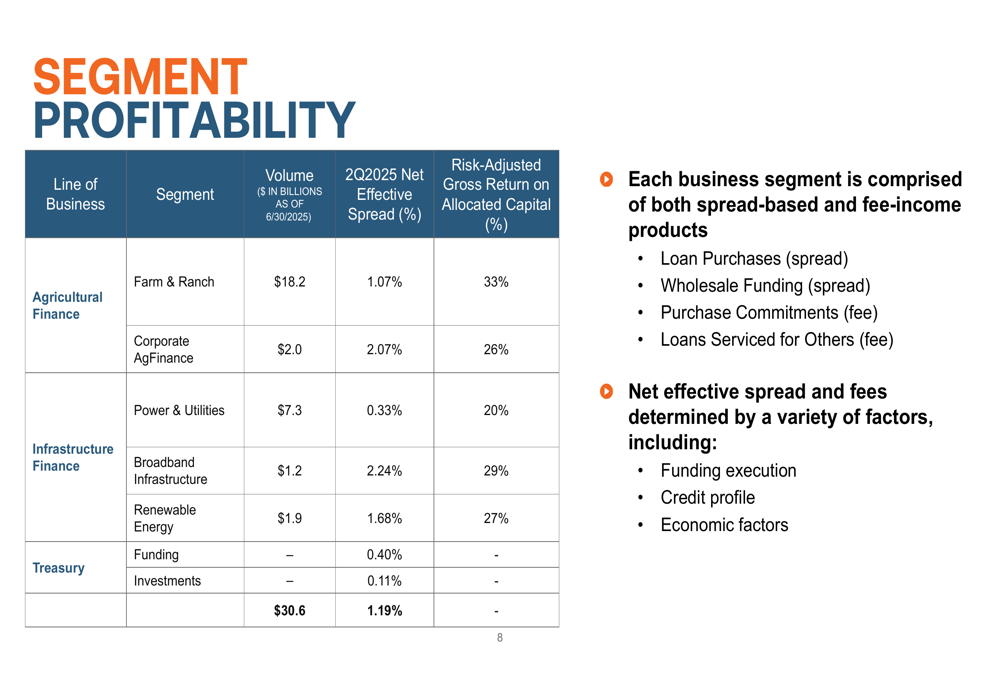
The Farm & Ranch segment, which represents the largest portion of the portfolio at $18.2 billion, generates a net effective spread of 1.07% and a risk-adjusted return on allocated capital of 33%. The Corporate AgFinance segment, though smaller at $2.0 billion, produces a higher net effective spread of 2.07% with a 26% return.
Growth in the infrastructure segments continues, with Power & Utilities at $7.3 billion, Renewable Energy at $1.9 billion, and Broadband Infrastructure at $1.2 billion. These segments align with the company’s Q1 2025 performance, which reported 22% growth in broadband infrastructure and 14% growth in renewable energy.
Capital Position and Dividend Growth
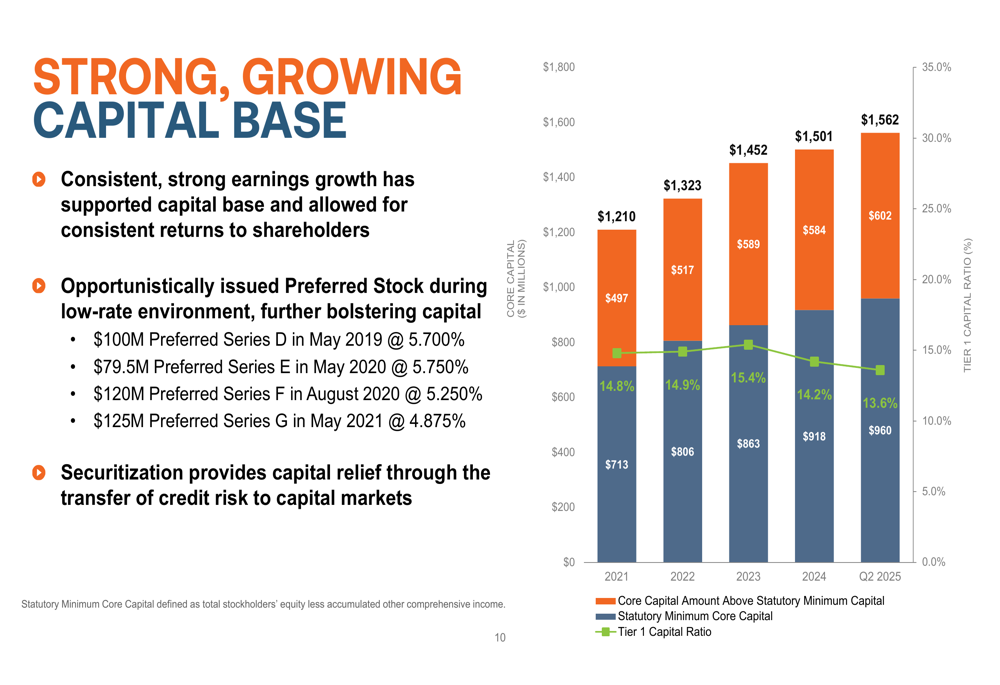
Farmer Mac maintains a strong capital position, with core capital exceeding the statutory minimum by $602 million as of Q2 2025. The company’s Tier 1 capital ratio stands at 13.6%, supporting continued business growth and shareholder returns.
The following chart illustrates the company’s capital growth trajectory:
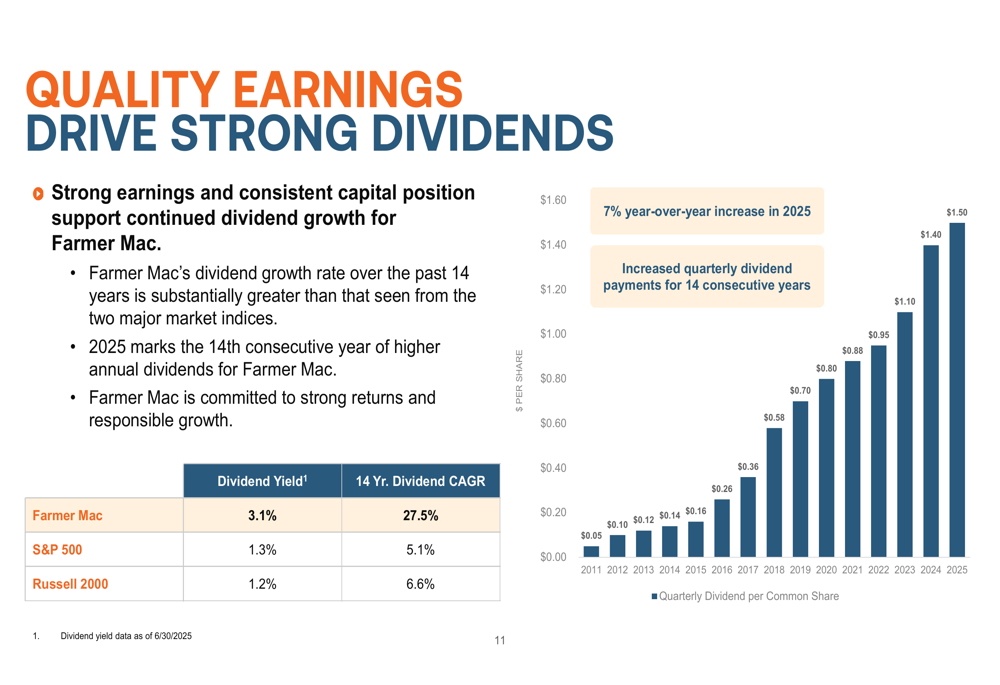
This strong capital base has enabled Farmer Mac to deliver consistent dividend growth. The quarterly dividend per common share has increased to $1.40 in 2025, representing a 7% year-over-year increase and marking the 14th consecutive year of dividend increases. The company’s dividend yield of 3.1% compares favorably to the S&P 500 (1.3%) and Russell 2000 (1.2%), while its 14-year dividend CAGR of 27.5% significantly outpaces both indices.
The following chart demonstrates Farmer Mac’s impressive dividend growth history:
Credit Quality and Risk Management
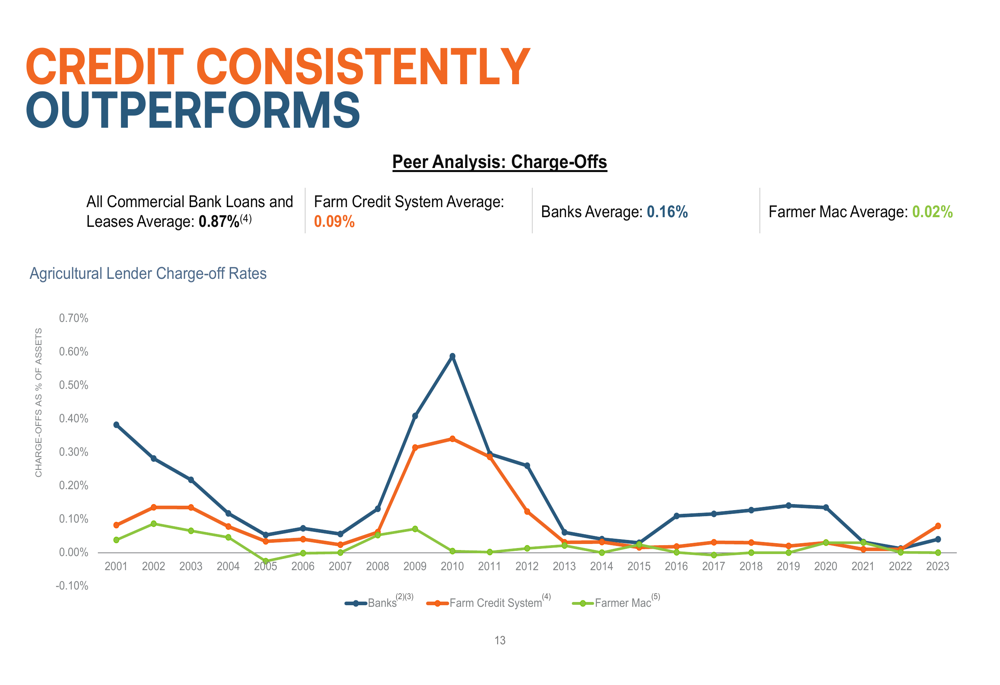
Farmer Mac’s rigorous underwriting standards continue to result in superior credit performance compared to peers. The company’s average charge-off rate of 0.02% significantly outperforms both commercial banks (0.87%) and the Farm Credit System (0.09%), as shown in the following comparison:
The company’s underwriting approach includes industry-leading credit requirements such as a minimum total debt coverage ratio of 1.25x and loan-to-value ratios averaging 40-45%. The average portfolio LTV stood at 47% as of June 30, 2025, providing a substantial cushion against potential market downturns.
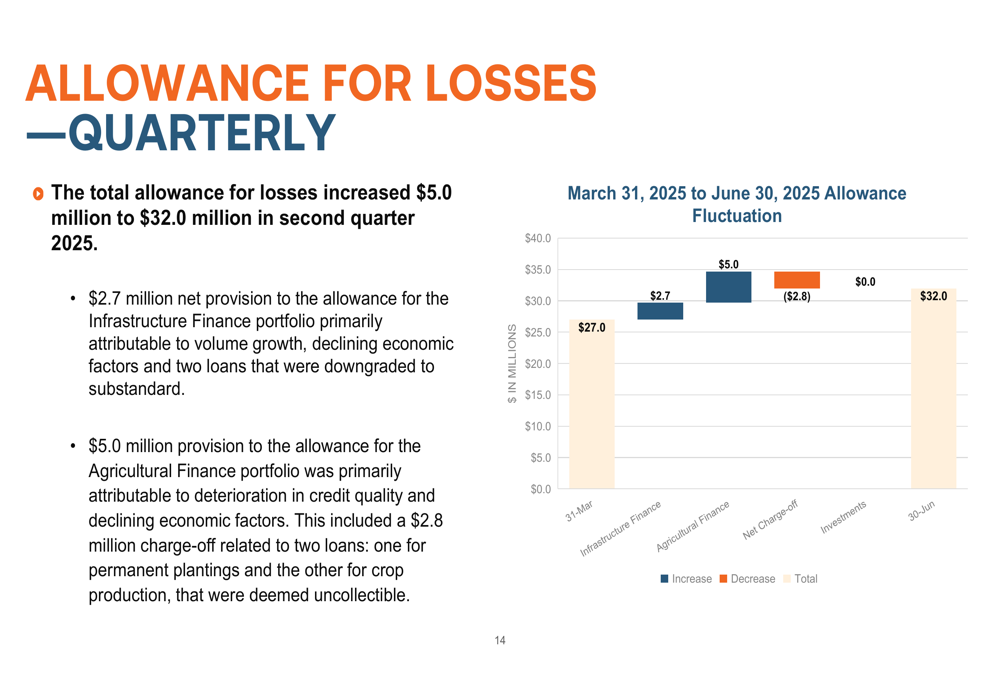
Despite the strong overall credit performance, Farmer Mac reported an increase in its allowance for losses in Q2 2025. The allowance grew by $5.0 million to $32.0 million, primarily due to deterioration in credit quality and declining economic factors in the Agricultural Finance portfolio, which included a $2.8 million charge-off related to two loans.
Growth Strategy and Outlook
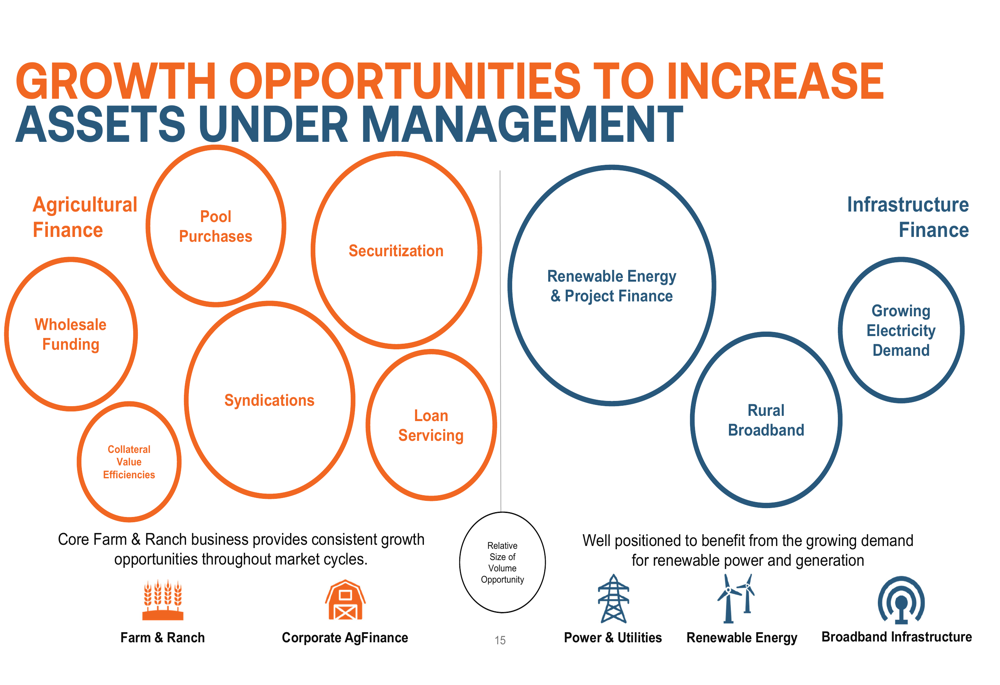
Farmer Mac outlined several growth opportunities to increase assets under management across its business segments. The company is focusing on expanding its Agricultural Finance business through pool purchases, securitization, wholesale funding, and loan servicing. In Infrastructure Finance, opportunities include renewable energy, project finance, rural broadband, and growing electricity demand.
The following chart illustrates these growth opportunities:
A key strategic initiative is the expansion of the Agricultural Mortgage-Backed Securities (AMBS) program, which aligns with Farmer Mac’s core mission to lower costs and improve credit availability for agricultural borrowers. This initiative builds upon the existing FARM Securitization Program with new products, utilizing current capabilities to originate eligible loans and expand revenue sources.
Farmer Mac’s competitive advantages, including its unique operating model, resilient business model, and lean operations, position the company for continued success in serving rural America’s financing needs:
Looking ahead, Farmer Mac anticipates continued growth in farm and ranch loan purchases, supported by a strong pipeline for upcoming quarters. The company’s diversified revenue streams and disciplined asset-liability management enable it to fulfill its mission while delivering value to shareholders.
Federal Agricultural Mortgage Corporation (NYSE:AGM) remains well-positioned to capitalize on opportunities in agricultural and rural infrastructure finance, maintaining its focus on operational efficiency and credit quality while driving sustainable growth.
Full presentation:
This article was generated with the support of AI and reviewed by an editor. For more information see our T&C.