U.S. stock futures slip lower; Cook’s firing increases Fed independence worries

Introduction & Market Context
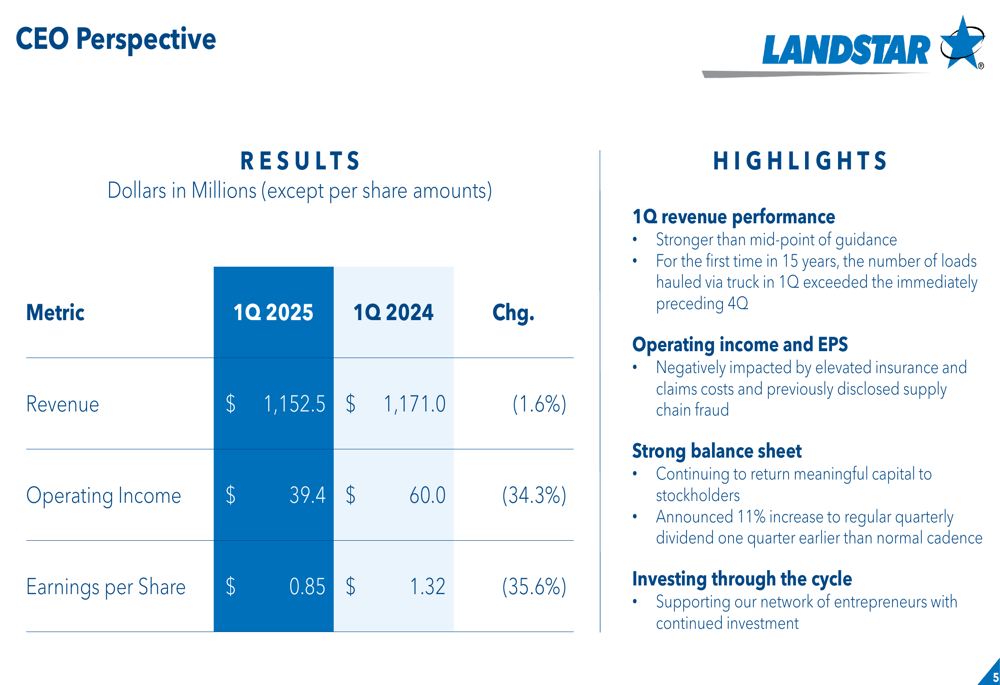
Landstar System Inc (NASDAQ:LSTR) reported its first quarter 2025 results, showing a significant decline in profitability despite relatively stable revenue. The transportation and logistics company saw its earnings per share fall by 35.6% year-over-year, primarily due to elevated insurance costs and a previously disclosed supply chain fraud incident.
The results come amid a challenging freight environment characterized by soft demand and ample truck capacity, continuing trends observed in previous quarters. Despite these headwinds, Landstar highlighted some positive operational developments, including an unusual seasonal pattern where first-quarter truck loadings exceeded the immediately preceding fourth quarter for the first time in 15 years.
Quarterly Performance Highlights
Landstar’s Q1 2025 revenue reached $1.15 billion, representing a modest 1.6% decrease compared to the $1.17 billion reported in Q1 2024. However, profitability metrics showed more substantial declines, with operating income dropping 34.3% to $39.4 million and earnings per share falling to $0.85 from $1.32 in the prior-year period.
As shown in the following financial results summary:
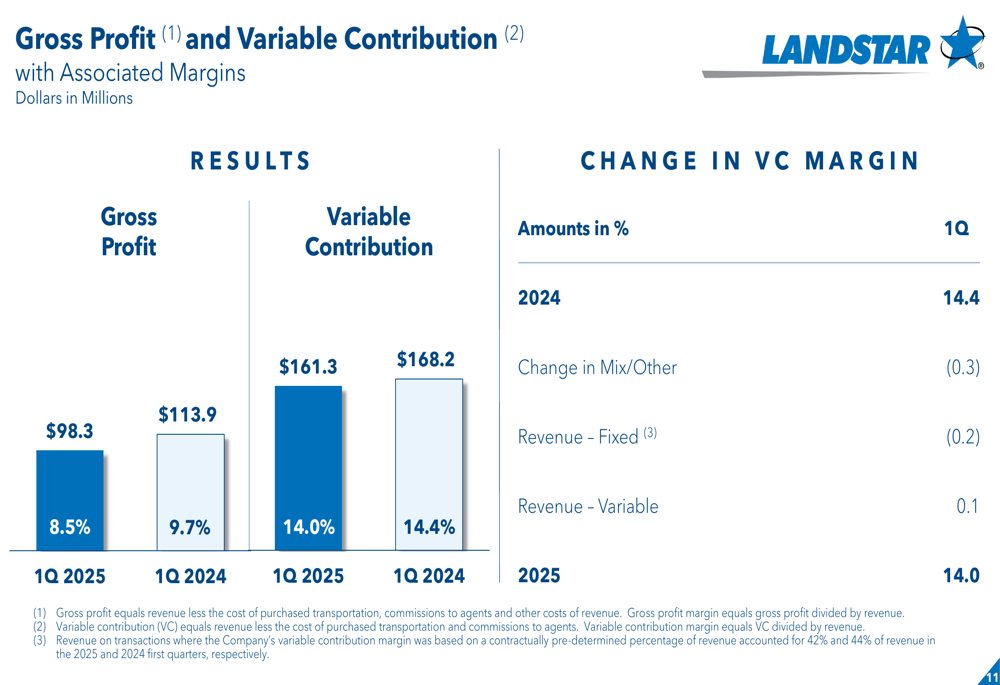
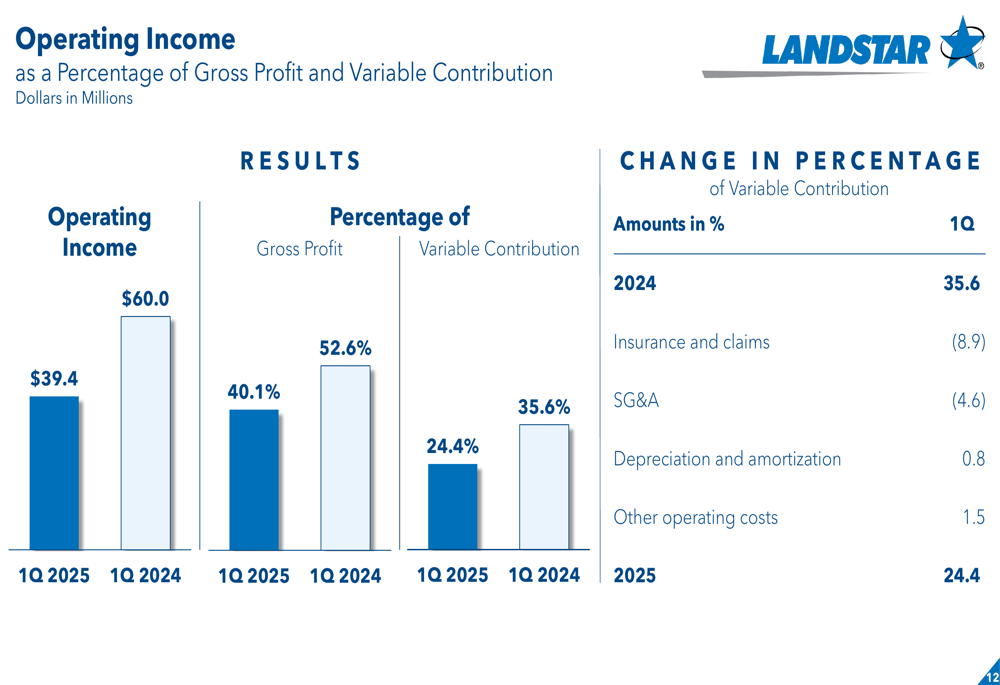
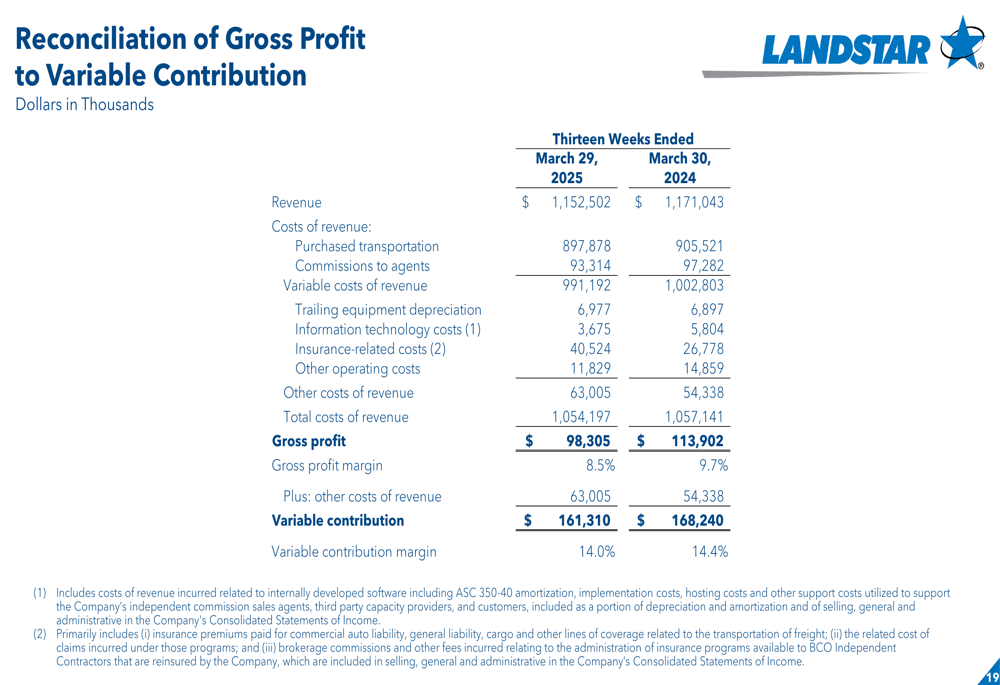
The company’s gross profit margin contracted to 8.5% from 9.7% a year earlier, while variable contribution margin (a non-GAAP measure Landstar uses to evaluate costs and trends) declined to 14.0% from 14.4%. Operating income as a percentage of variable contribution saw an even steeper drop, falling to 24.4% from 35.6% in Q1 2024.
The following chart illustrates the breakdown of these profitability metrics:
Operational Challenges
The primary factors behind Landstar’s profit decline were elevated insurance and claims costs, along with the impact of a previously disclosed supply chain fraud. According to the company’s analysis, insurance and claims costs alone accounted for an 8.9 percentage point reduction in operating income as a percentage of variable contribution.
This breakdown of operating income factors shows the significant impact of these challenges:
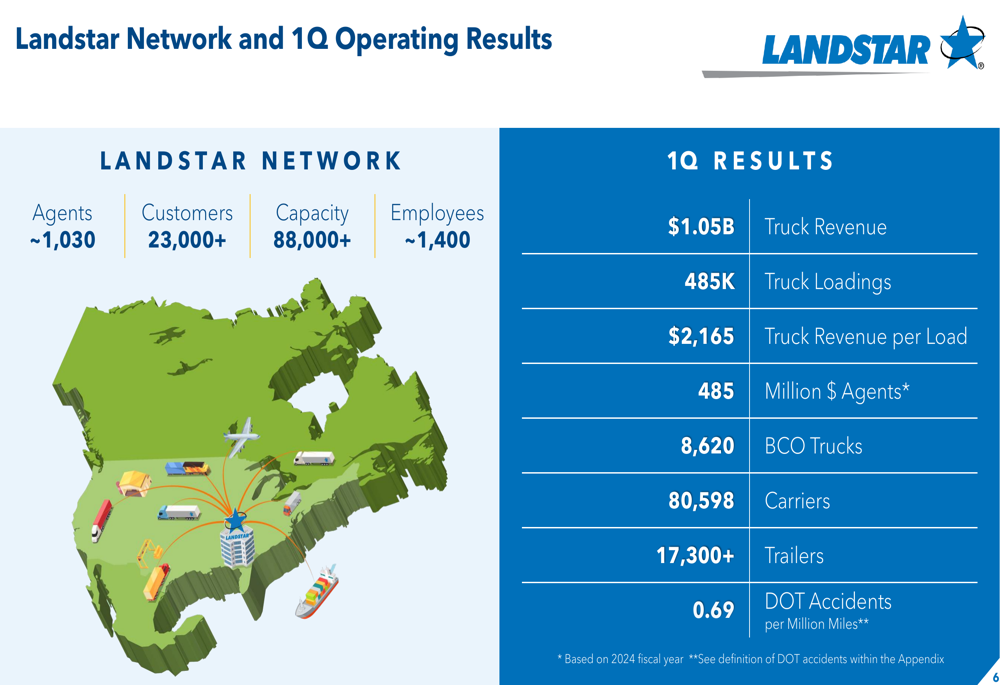
Despite these challenges, Landstar maintained its extensive network of agents, carriers, and customers. The company reported approximately 1,030 agents, 23,000+ customers, and 88,000+ capacity providers in its network, generating $1.05 billion in truck revenue from 485,000 truck loadings during the quarter.
The following slide provides a comprehensive overview of Landstar’s network and operational metrics:
Capital Allocation & Shareholder Returns
Despite the operational challenges, Landstar continued to return capital to shareholders, announcing an 11% increase to its regular quarterly dividend one quarter earlier than its normal cadence. The company also significantly increased share repurchases, spending $60.4 million in Q1 2025 compared to no share repurchases in Q1 2024.
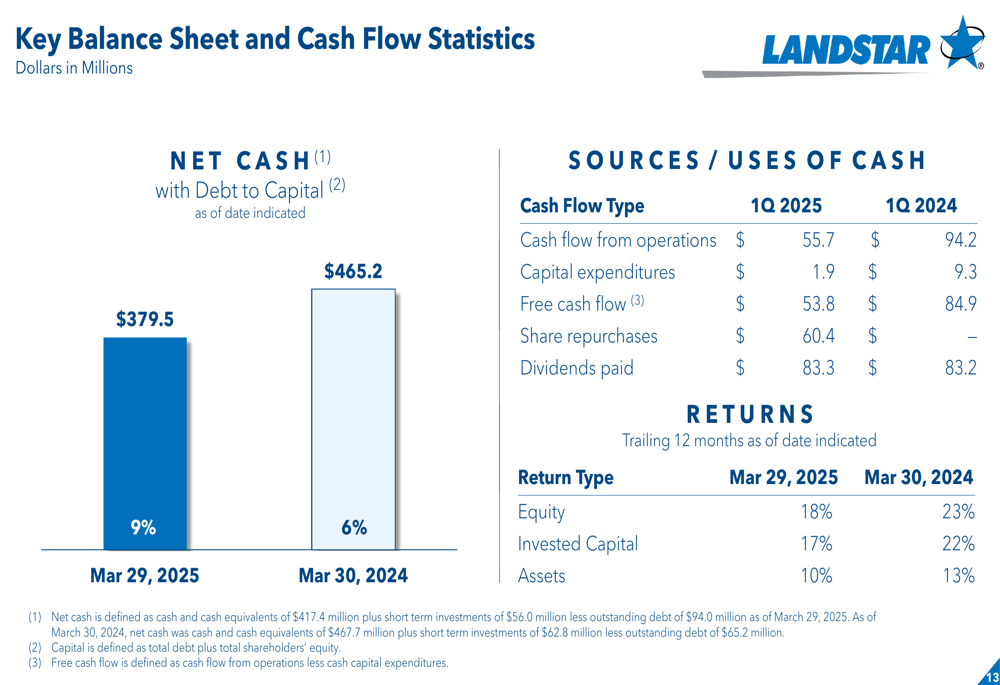
The company’s balance sheet remained strong with $379.5 million in net cash, though this represents a decrease from $465.2 million a year earlier. Cash flow from operations declined to $55.7 million from $94.2 million in Q1 2024, while free cash flow fell to $53.8 million from $84.9 million.
The following chart details Landstar’s key balance sheet and cash flow statistics:
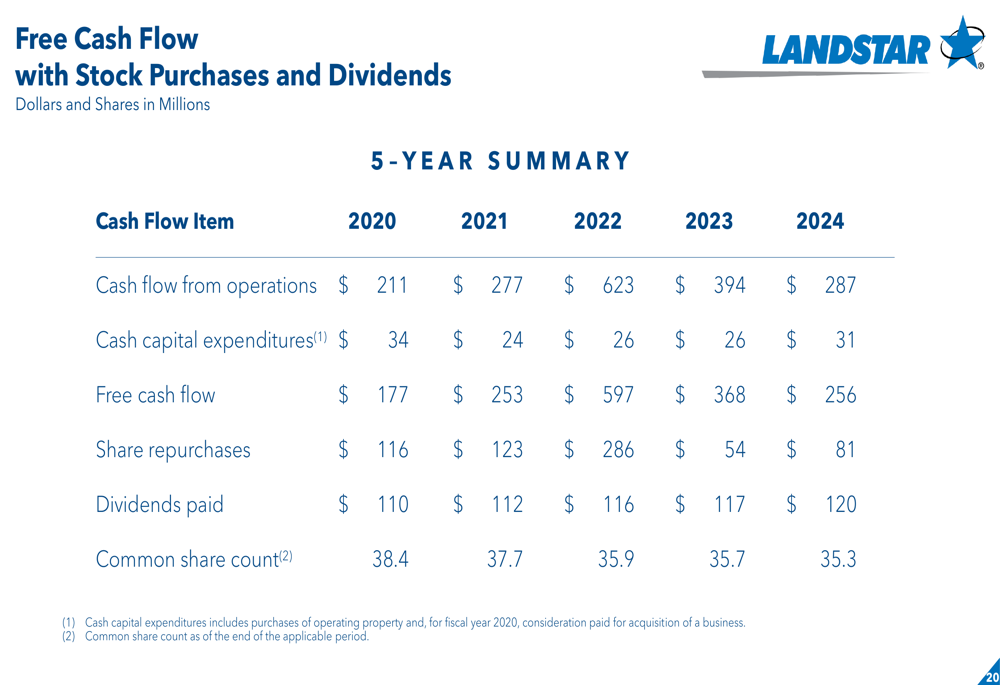
Landstar’s historical pattern of generating and distributing free cash flow demonstrates the company’s consistent approach to capital allocation:
Q2 Outlook & Market Trends
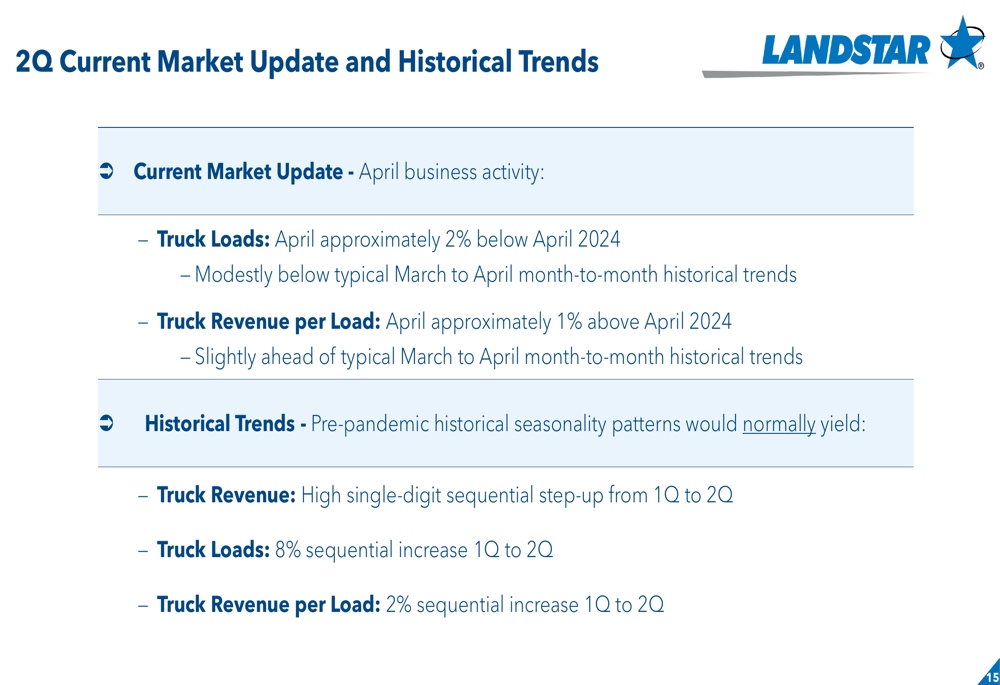
Looking ahead to the second quarter, Landstar provided insights into current market conditions and historical trends. April truck loads were approximately 2% below April 2024 levels and modestly below typical March-to-April historical patterns. However, truck revenue per load in April was approximately 1% above April 2024 and slightly ahead of typical seasonal trends.
The company noted that pre-pandemic historical seasonality patterns would normally yield a high single-digit sequential increase in truck revenue from Q1 to Q2, with truck loads typically increasing by 8% and truck revenue per load rising by 2%.
The following slide summarizes these current market conditions and historical trends:
Industry Position & Revenue Mix
Landstar’s revenue by industry showed mixed performance across sectors. Consumer durables and machinery segments showed year-over-year growth of 2% and 5% respectively, while automotive revenue declined by 23% and hazardous materials shipments fell by 15%. The energy sector showed the strongest growth at 51%, though from a smaller base.
The company’s revenue mix continues to be dominated by truckload transportation, with van equipment accounting for 52% of revenue and unsided/platform equipment representing 29%. Ocean and air cargo services grew to represent 6% of revenue, up from 5% in Q1 2024.
A detailed reconciliation of gross profit to variable contribution provides further insight into Landstar’s cost structure and profitability drivers:
In conclusion, while Landstar faces significant challenges from elevated insurance costs and the impact of supply chain fraud, the company continues to generate substantial cash flow and maintain its commitment to shareholder returns. The mixed signals in early Q2 performance suggest that the recovery in the freight market remains tentative, with the company navigating a still-challenging operating environment.
Full presentation:
This article was generated with the support of AI and reviewed by an editor. For more information see our T&C.