Lisa Cook sues Trump over firing attempt, emergency hearing set

MSCI Inc (NYSE:MSCI) reported solid second-quarter 2025 results on July 22, with operating revenues increasing 9.1% year-over-year to $772.7 million, according to the company’s earnings presentation. Despite strong financial performance across segments, MSCI shares were trading down 3.35% following the announcement.
Quarterly Performance Highlights
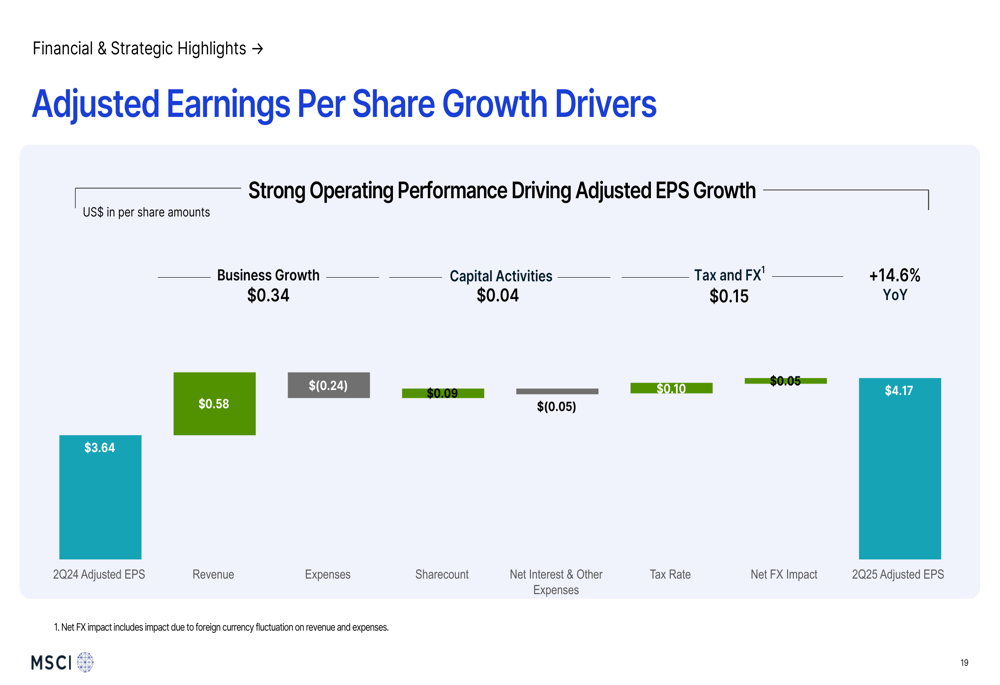
The financial services provider delivered adjusted earnings per share of $4.17, representing a 14.6% increase compared to the same period last year. Operating income grew 11.1% to $425.2 million, with operating margins expanding by 100 basis points to 55.0%.
As shown in the following financial results snapshot, MSCI maintained strong profitability metrics with adjusted EBITDA increasing 10.3% to $474.4 million and adjusted EBITDA margin improving to 61.4%:
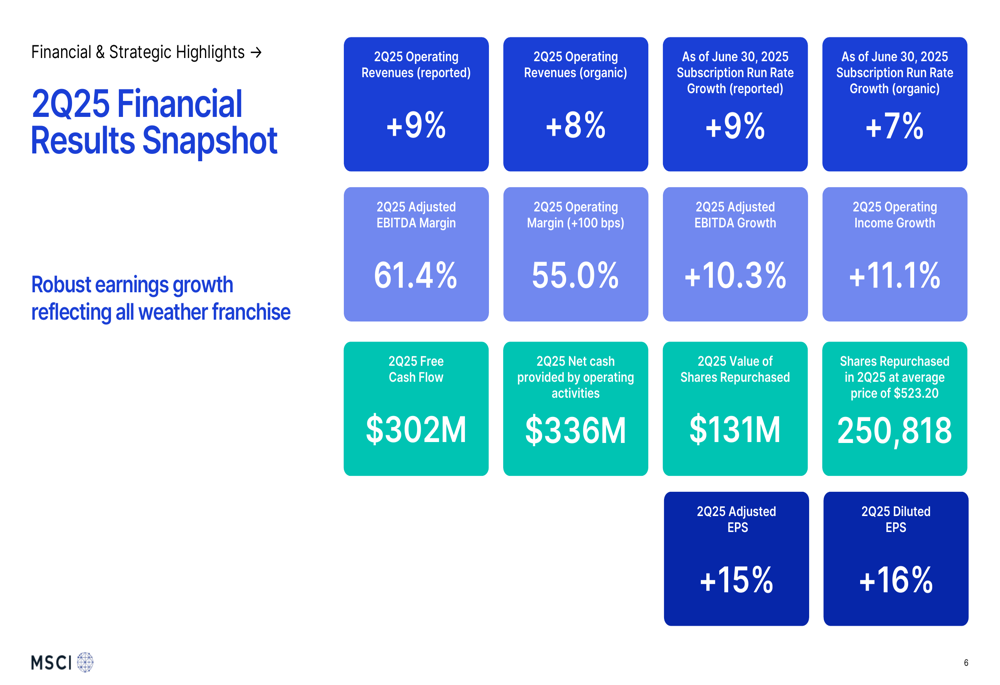
The company’s performance was supported by a high quarterly retention rate of 94.4% and total run rate of $3.1 billion. Free cash flow reached $302 million for the quarter, while the company returned $270.5 million to shareholders through dividends and share repurchases.
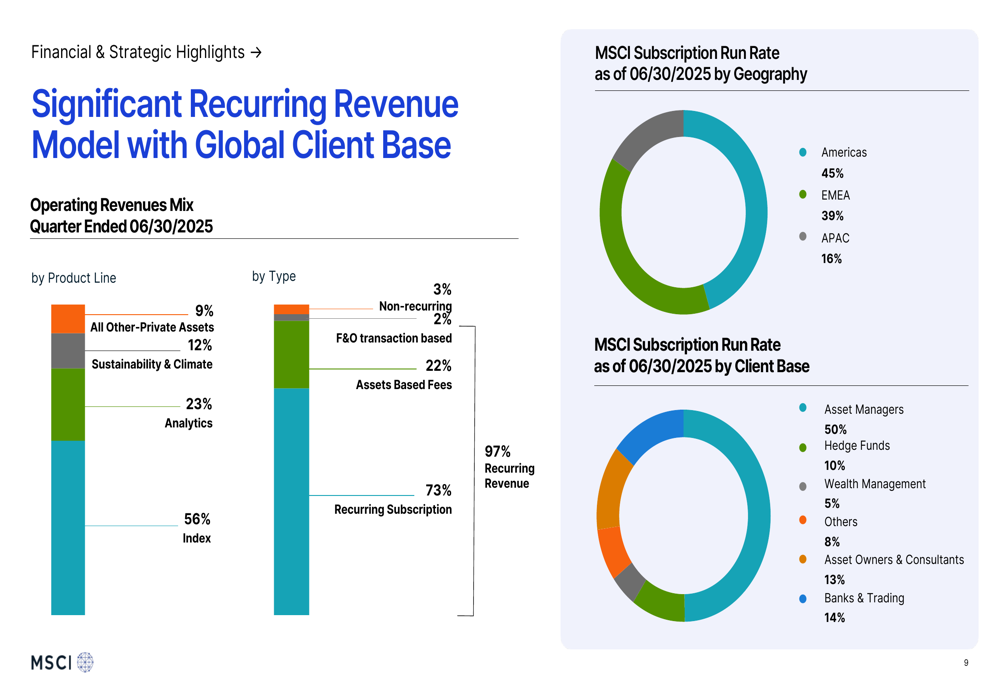
MSCI’s business model continues to be dominated by recurring revenue, which accounted for 73% of operating revenue, with asset-based fees contributing 22%. This revenue stability is reinforced by a diverse global client base, with asset managers representing half of the subscription run rate:
Regional Performance
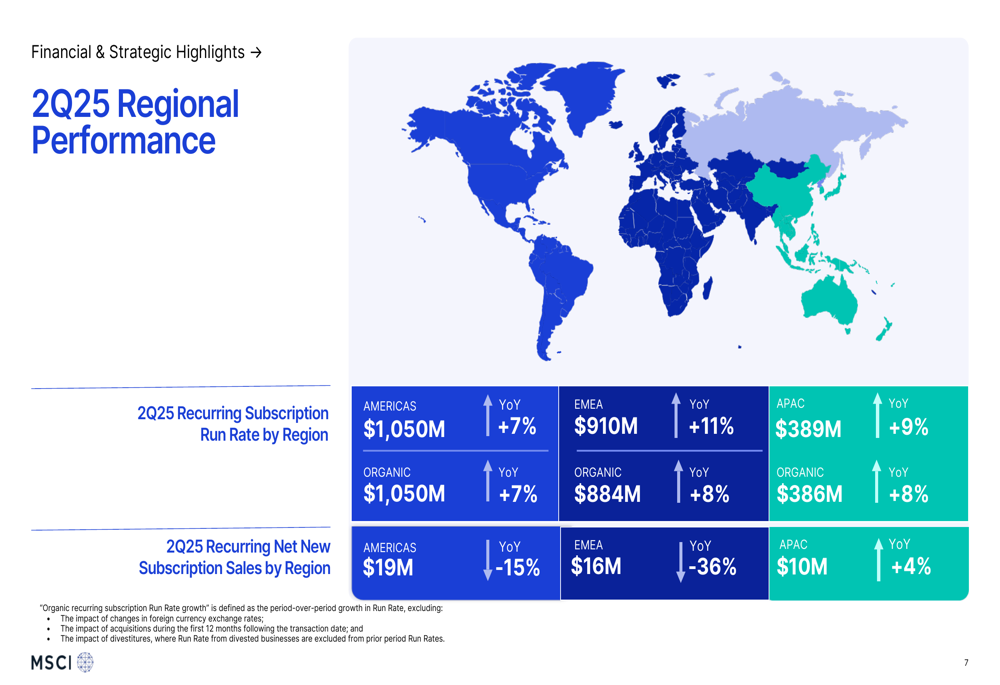
MSCI reported growth across all geographic regions, though with mixed results in new subscription sales. The Americas region, which accounts for 45% of subscription run rate, saw recurring subscription run rate increase 7% year-over-year to $1.05 billion, despite a 15% decline in new subscription sales.
EMEA (Europe, Middle East, and Africa) showed the strongest run rate growth at 11% year-over-year, reaching $910 million, but experienced a significant 36% drop in new subscription sales. APAC (Asia-Pacific) delivered 9% run rate growth to $389 million, with new subscription sales increasing 4%:
ETF and Index Business Performance
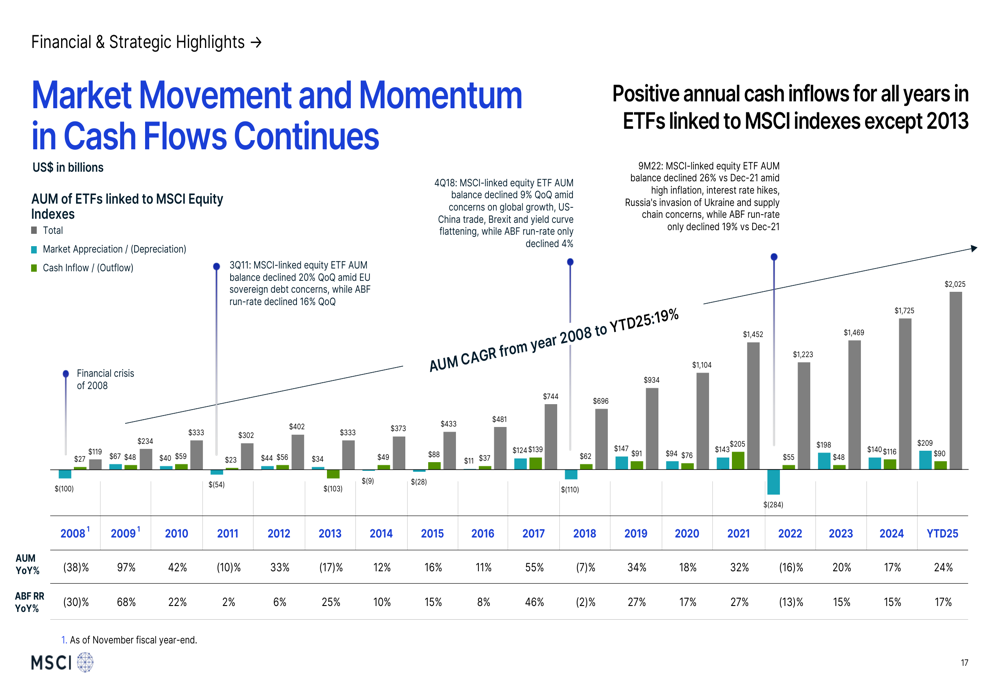
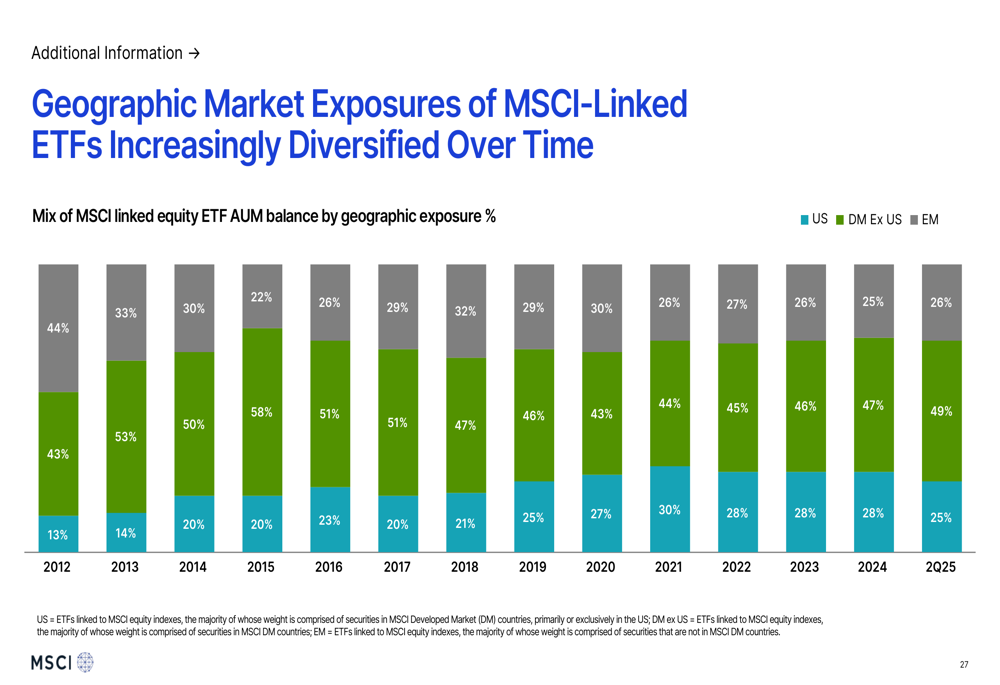
The Index segment remained MSCI’s largest revenue contributor at 56% of operating revenue. Assets under management (AUM) in ETFs linked to MSCI equity indexes reached $2.02 trillion, a 24% increase year-over-year. This growth was driven by market appreciation and continued inflows, with particularly strong performance in emerging markets ETFs, which grew 31% year-over-year.
The following chart illustrates the long-term growth trajectory of MSCI-linked ETFs, which have achieved a compound annual growth rate of 19% since 2008:
Geographic diversification of MSCI-linked ETFs has continued, with emerging markets and developed markets outside the U.S. gaining share over time:
Sustainability and Climate Growth
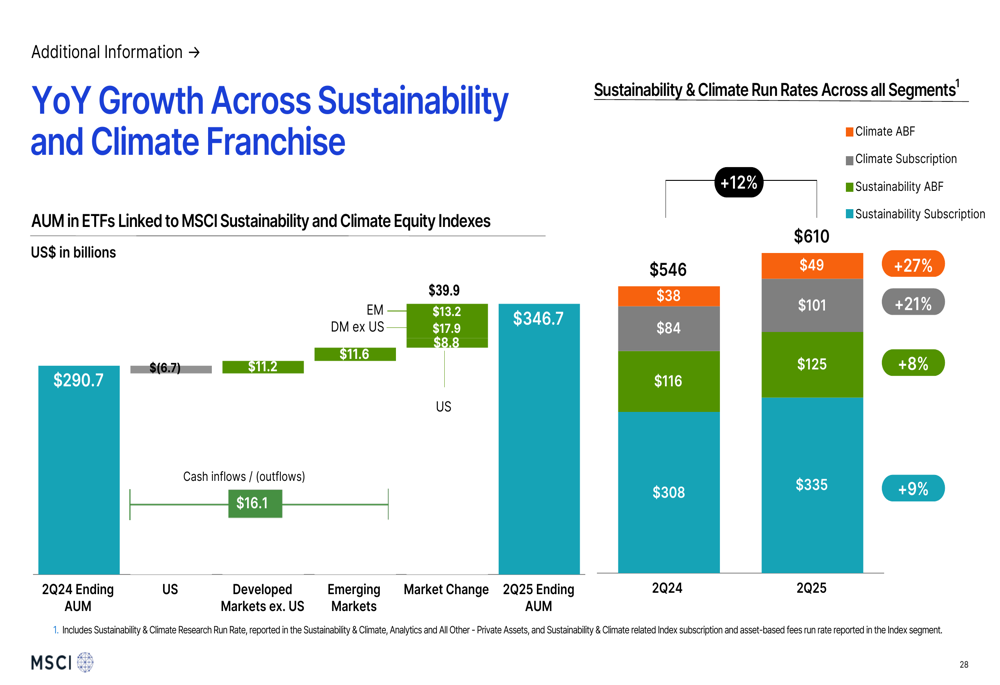
MSCI’s Sustainability and Climate segment (renamed from ESG and Climate) showed continued momentum, with subscription run rate growing 7% organically to $369.8 million. The AUM in ETFs linked to sustainability and climate strategies increased 12% year-over-year to $346.7 billion:
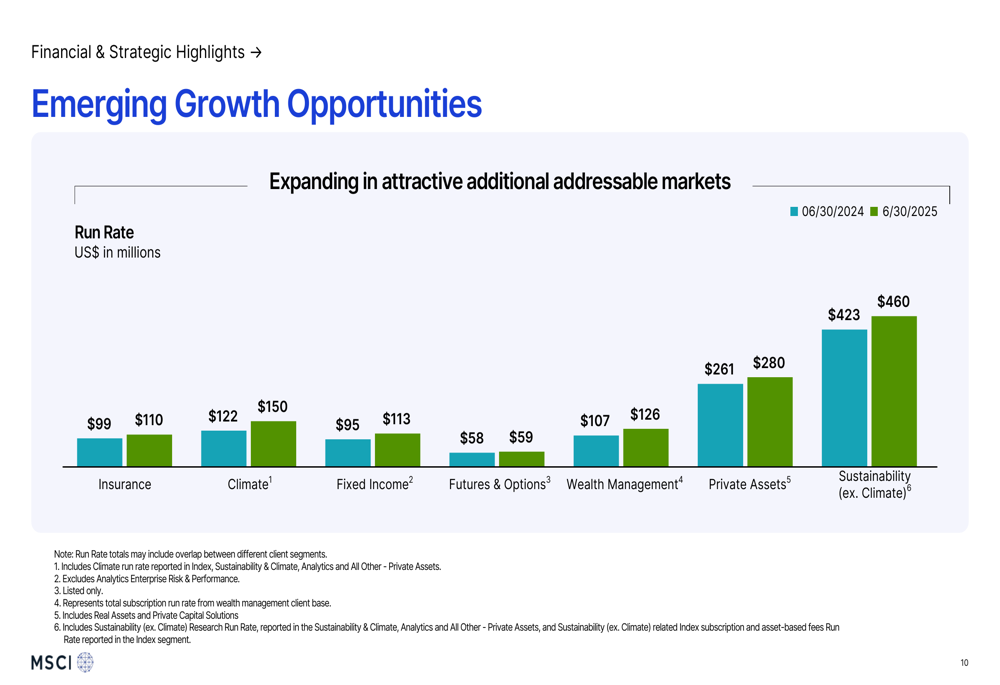
The company highlighted several emerging growth opportunities, including climate, fixed income, and private assets, all showing double-digit run rate growth year-over-year:
Earnings Growth Drivers
MSCI’s adjusted EPS growth of 14.6% was primarily driven by revenue growth, which contributed $0.58 to the year-over-year increase. This was partially offset by higher expenses, which reduced EPS by $0.24. Share count reduction through buybacks added $0.05 to EPS growth:
Outlook and Guidance
For full-year 2025, MSCI maintained its guidance across key financial metrics, projecting operating expenses between $1,405-1,445 million and free cash flow between $1,400-1,460 million:
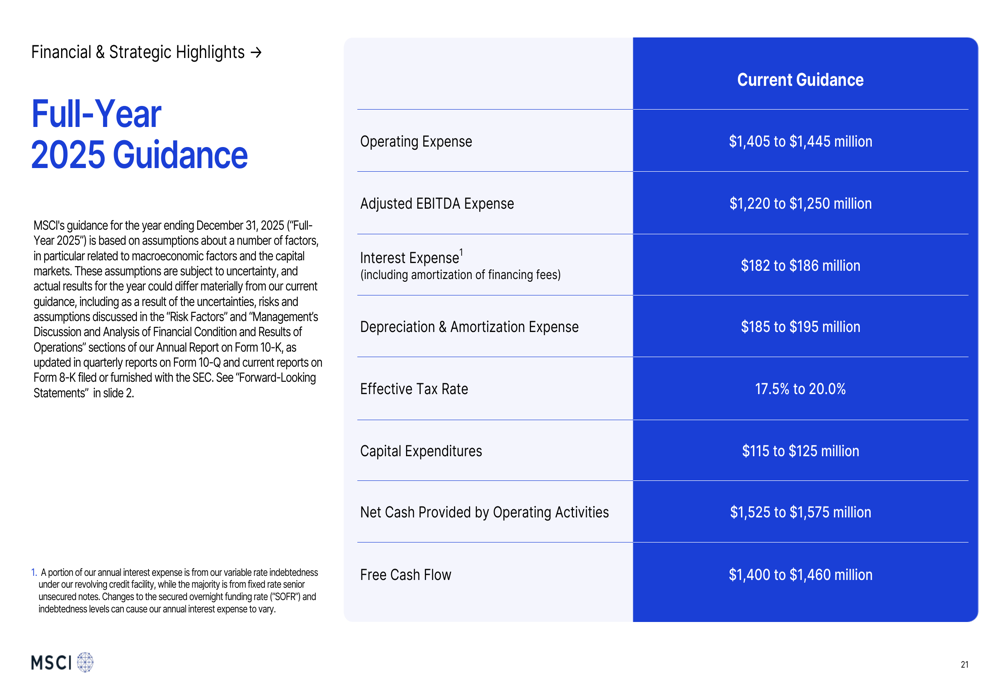
The company also reaffirmed its long-term targets, including low double-digit revenue growth for the overall business and high 50s percentage adjusted EBITDA margin.
Market Reaction and Analysis
Despite the strong financial results, MSCI shares were trading down 3.35% at the time of the earnings release, with premarket trading showing a decline of 2.46%. This negative reaction suggests investors may have had higher expectations or concerns about future growth, particularly given the significant declines in new subscription sales in the Americas and EMEA regions.
The Q2 results build on MSCI’s strong Q1 2025 performance, when the company reported EPS of $4.00, exceeding analyst expectations of $3.93. The sequential EPS growth from $4.00 in Q1 to $4.17 in Q2 represents a 4.25% increase quarter-over-quarter.
While MSCI continues to demonstrate robust financial performance and maintains its full-year guidance, investors may be concerned about the sustainability of growth rates in an increasingly competitive market environment. The significant drop in new subscription sales in key markets could signal potential challenges in maintaining the company’s historical growth trajectory, despite the strong retention of existing clients.
Full presentation:
This article was generated with the support of AI and reviewed by an editor. For more information see our T&C.