Wall St futures flat amid US-China trade jitters; bank earnings in focus

Introduction & Market Context
PennyMac Financial Services, Inc. (NYSE:PFSI) reported first quarter 2025 results showing resilience in a challenging mortgage environment, with net income of $76 million and diluted earnings per share of $1.42. The company’s presentation highlighted its balanced business model that continues to deliver solid returns despite elevated mortgage rates, which stood at 6.83% for 30-year fixed mortgages as of mid-April 2025.
The Q1 performance represents a decline from the previous quarter, where the company reported net income of $104 million and EPS of $1.95, reflecting the impact of higher mortgage rates on origination volumes. Despite this sequential decline, PennyMac maintained an annualized operating return on equity of 15%, demonstrating the company’s ability to generate attractive returns across different market environments.
Quarterly Performance Highlights
PennyMac’s first quarter results showed the company’s continued focus on operational efficiency and portfolio growth. Key metrics included an annualized return on equity of 8%, book value per share of $75.57, and a quarterly dividend of $0.30 per common share.
As shown in the following comprehensive summary of first quarter results, the company’s performance was driven by both production and servicing segments:
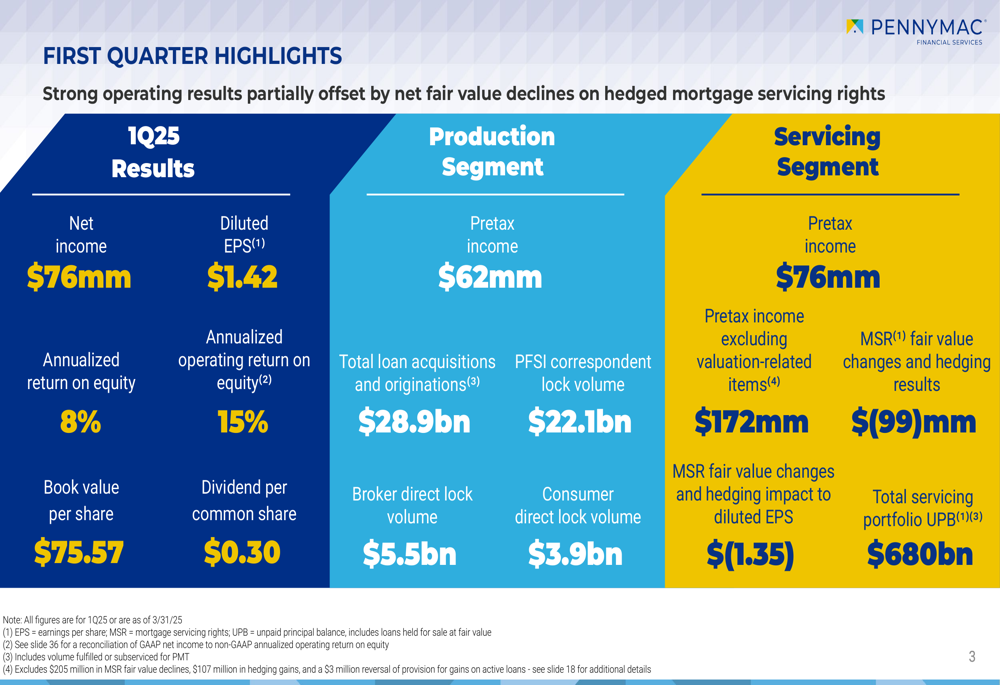
The production segment generated pretax income of $62 million, with total loan acquisitions and originations of $28.9 billion. This included $22.1 billion in correspondent lock volume, $5.5 billion in broker direct lock volume, and $3.9 billion in consumer direct lock volume.
The servicing segment continued to be a strong contributor with pretax income of $76 million. However, this figure was impacted by MSR fair value changes and hedging results of $(99) million, which had a negative impact of $(1.35) on diluted EPS. Excluding these valuation-related items, the servicing segment generated pretax income of $172 million, highlighting the strong underlying performance of this business.
Strategic Initiatives
A significant announcement in the quarter was PennyMac’s partnership as the official mortgage supporter of the 2026 and 2028 U.S. Olympic and Paralympic Teams. This partnership represents a major milestone in the company’s brand-building efforts and aligns with its core values.
The company highlighted several benefits of this Olympic partnership, including increased brand awareness and engagement with a U.S. fan base of over 170 million. The partnership is expected to elevate PennyMac’s positioning and foster a stronger employment brand.
PennyMac also continues to expand its subservicing business, with three clients already signed and $65 billion in unpaid principal balance. The company is targeting a broader market of MSR owners seeking best-in-class and low-cost subservicing solutions, with white-label subservicing on track for release in Q2 2025.
Market Outlook and Origination Trends
The U.S. mortgage origination market is projected to reach $2.0 trillion in 2025 and $2.3 trillion in 2026, showing growth despite continued high mortgage rates. This outlook suggests improving conditions for mortgage originators, particularly those with large servicing portfolios like PennyMac.
As illustrated in the following chart, while mortgage rates remain elevated, the industry expects modest growth in both purchase and refinance volumes:
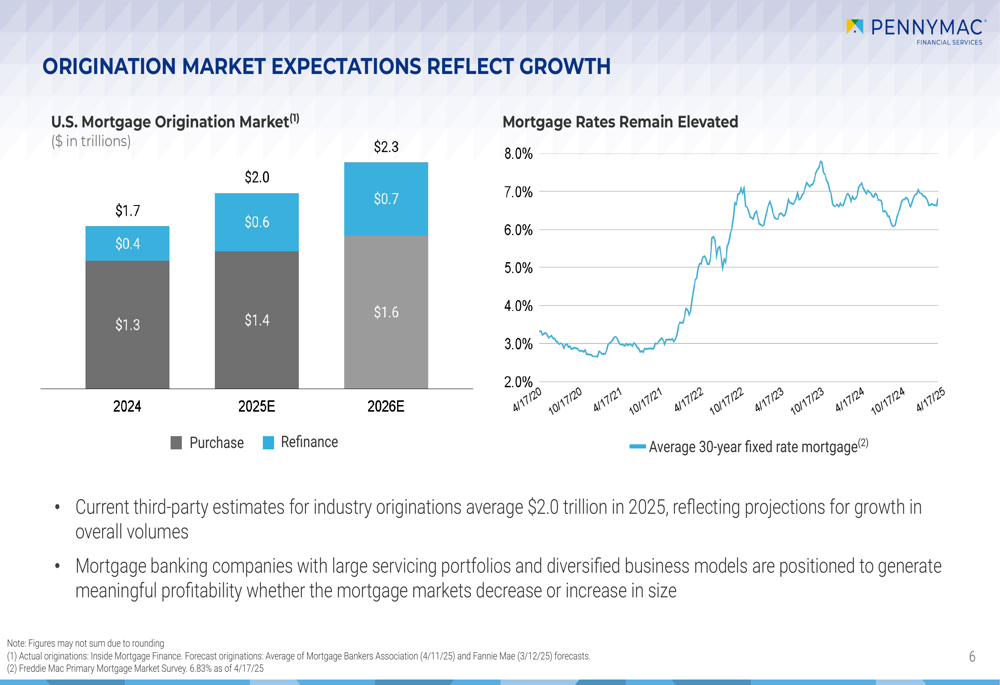
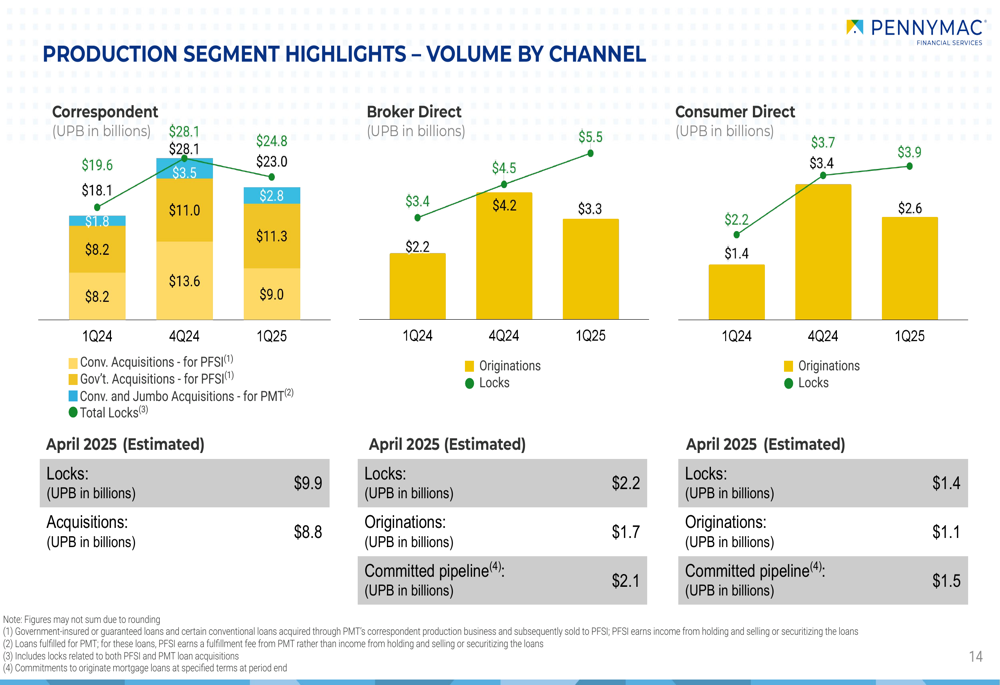
PennyMac’s multi-channel origination strategy positions it well to capitalize on this market. The company’s correspondent channel remains the largest, with $28 billion in volume during Q1 2025. The broker direct channel saw $5.5 billion in volume, while the consumer direct channel contributed $3.9 billion.
The following chart shows the breakdown of production volume by channel, along with April 2025 estimates:
Servicing Portfolio Growth and Efficiency
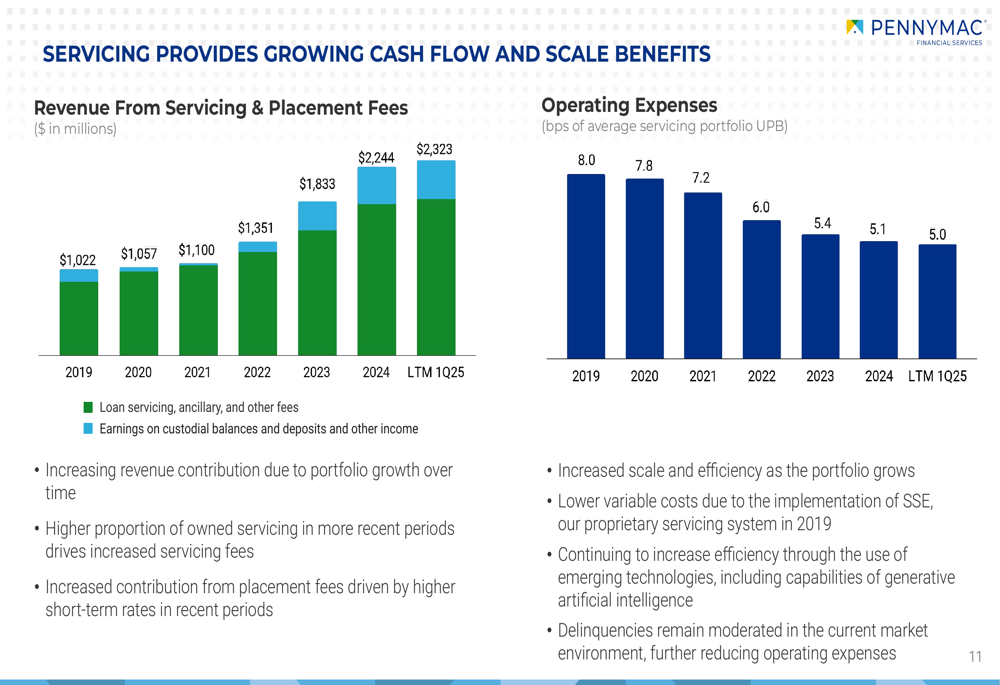
PennyMac’s servicing portfolio reached $680.2 billion in unpaid principal balance as of March 31, 2025, representing a 2% increase quarter-over-quarter and a 10% increase year-over-year. This growth in servicing assets provides increasing cash flow and scale benefits for the company.
The company has made significant progress in reducing servicing costs, from 8.0 basis points in 2019 to 5.0 basis points in the last twelve months ending Q1 2025. This efficiency improvement, combined with growing servicing revenue, has enhanced the profitability of the servicing segment.
As shown in the following chart, revenue from servicing and placement fees has grown substantially, while operating expenses as a percentage of the portfolio have decreased:
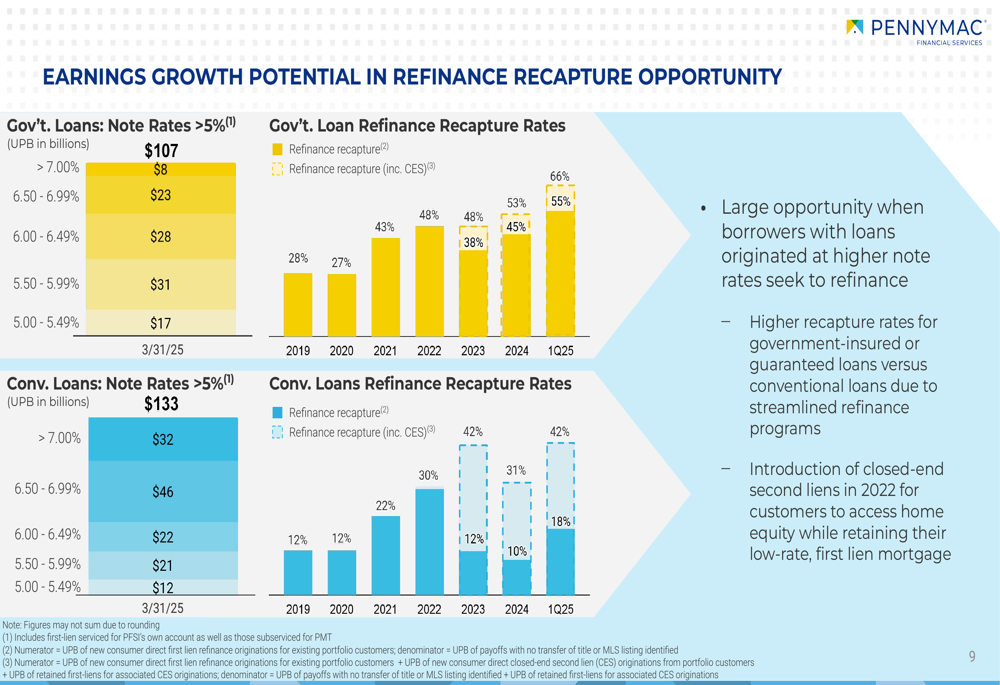
The servicing portfolio also represents a significant opportunity for future refinance activity. PennyMac has approximately $220 billion in unpaid principal balance of loans with note rates above 5%, which could drive substantial refinance volume when interest rates eventually decline.
The following chart illustrates this refinance recapture opportunity:
Market Share and Competitive Position
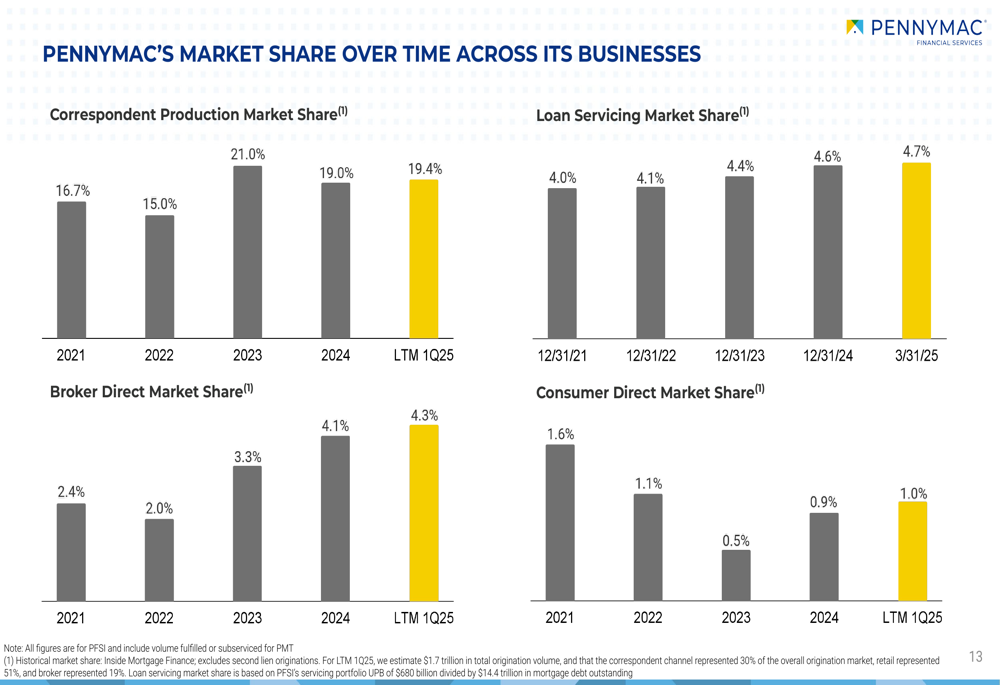
PennyMac has consistently grown its market share across most of its businesses. The company’s correspondent production market share increased from 16.7% in 2021 to 19.4% in the last twelve months ending Q1 2025. Similarly, its loan servicing market share grew from 4.0% at the end of 2021 to 4.7% as of March 31, 2025.
The broker direct channel has shown particularly strong growth, with market share increasing from 2.4% in 2021 to 4.3% in the last twelve months ending Q1 2025. However, the consumer direct market share decreased from 1.6% in 2021 to 1.0% in the same period.
The following chart shows PennyMac’s market share trends across its businesses:
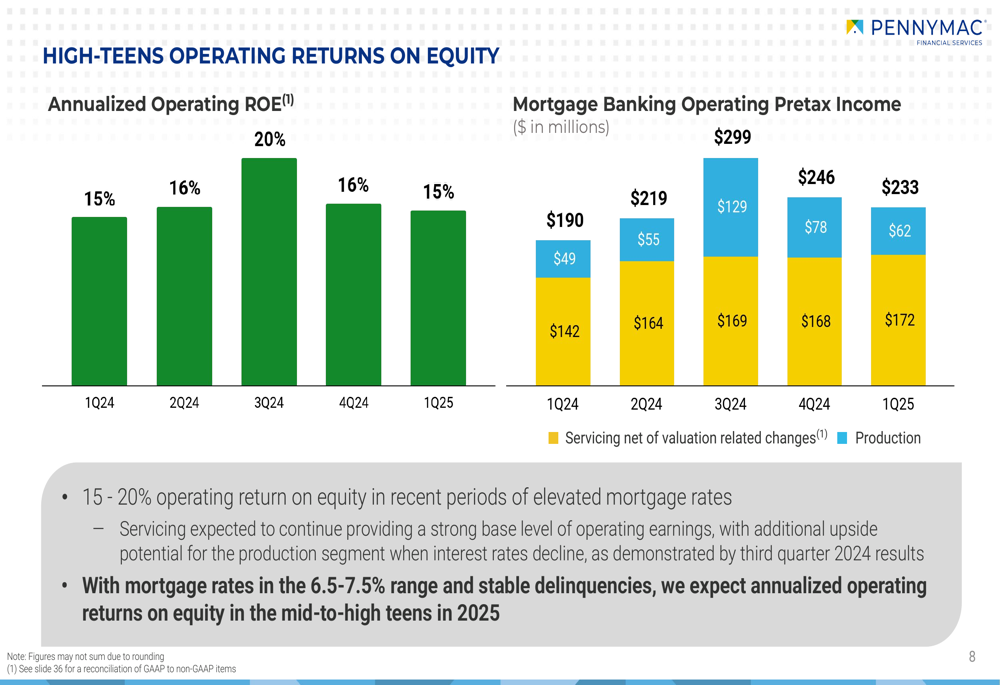
PennyMac’s balanced business model, with strength in both production and servicing, has enabled it to generate attractive returns across different interest rate environments. The company’s annualized operating ROE has consistently been in the 15-20% range, demonstrating the resilience of its business model.
The following chart shows the company’s operating ROE and mortgage banking pretax income over recent quarters:
Forward Outlook
Looking ahead, PennyMac expects to continue generating annualized operating returns on equity in the mid-to-high teens in 2025. The company is well-positioned to benefit from its large servicing portfolio, which provides stable cash flow in the current high-rate environment and positions it for growth when rates eventually decline.
The company’s hedging approach is designed to moderate the volatility of its results, protecting against significant interest rate fluctuations. While the hedging strategy resulted in a net cost of $99 million in Q1 2025, it provides important protection for the company’s MSR portfolio.
PennyMac’s strong balance sheet and diverse capital structure support its growth initiatives. The company targets a debt-to-equity ratio near 3.5x to provide higher returns, and as of March 31, 2025, it had approximately $4 billion available in cash and other assets.
The macroeconomic environment remains challenging, with the 30-year fixed mortgage rate at approximately 6.65% as of March 31, 2025. However, PennyMac’s track record of strong performance across different market environments positions it well to navigate these challenges and capitalize on opportunities as they arise.
Full presentation:
This article was generated with the support of AI and reviewed by an editor. For more information see our T&C.