InvestingPro’s Fair Value model captures 63% gain in Steelcase ahead of acquisition

Introduction & Market Context
Science Applications (NASDAQ:SAIC) International Corp (NYSE:SAIC) released its first quarter fiscal year 2026 financial results on June 2, 2025, revealing a mixed performance that sent shares tumbling in premarket trading. Despite posting a 2% year-over-year revenue increase, the government technology services provider faced challenges with declining margins and negative free cash flow.
SAIC shares were down 6.53% in premarket trading to $108, a significant reversal from the 8.36% surge that followed its strong Q4 FY25 results. Today’s reaction suggests investors are concerned about the company’s ability to maintain its margin improvement trajectory despite management’s reaffirmation of full-year guidance.
Quarterly Performance Highlights
SAIC reported Q1 FY26 revenue of $1.877 billion, a 2% increase from $1.847 billion in the same period last year. However, adjusted EBITDA declined to $157 million (8.4% margin) from $166 million (9.0% margin) in Q1 FY25. Adjusted diluted earnings per share remained flat at $1.92.
The most concerning metric was free cash flow, which turned sharply negative at -$44 million compared to positive $13 million in the prior-year quarter. This represents a significant deviation from the company’s emphasis on "compounding free cash flow per share growth" as a key investment thesis.
As shown in the following financial results summary:
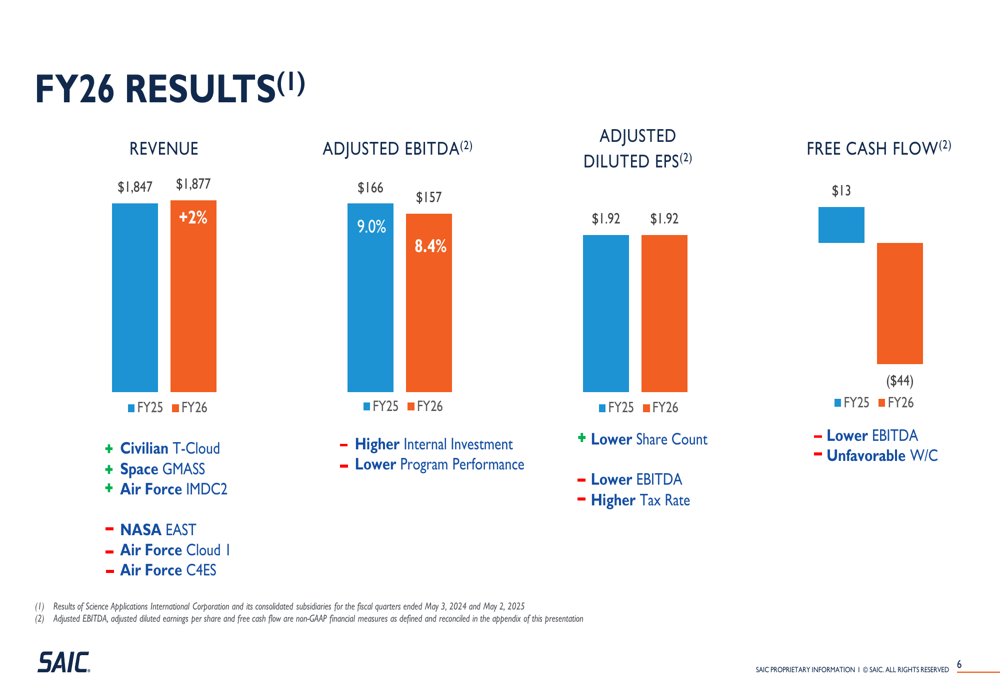
The company highlighted several positive and negative contributors to its quarterly performance. On the positive side, Civilian T-Cloud, Space GMASS, and Air Force IMDC2 programs supported growth. Conversely, NASA EAST, Air Force Cloud I, and Air Force C4ES programs negatively impacted results.
Full-Year Outlook
Despite the Q1 challenges, SAIC maintained its full-year FY26 guidance across all metrics. The company continues to project revenue between $7.60 billion and $7.75 billion, representing organic growth of 2% to 4%. Adjusted EBITDA is expected to range from $715 million to $735 million, with margins between 9.4% and 9.6%.
The company’s guidance details are illustrated in the following slide:
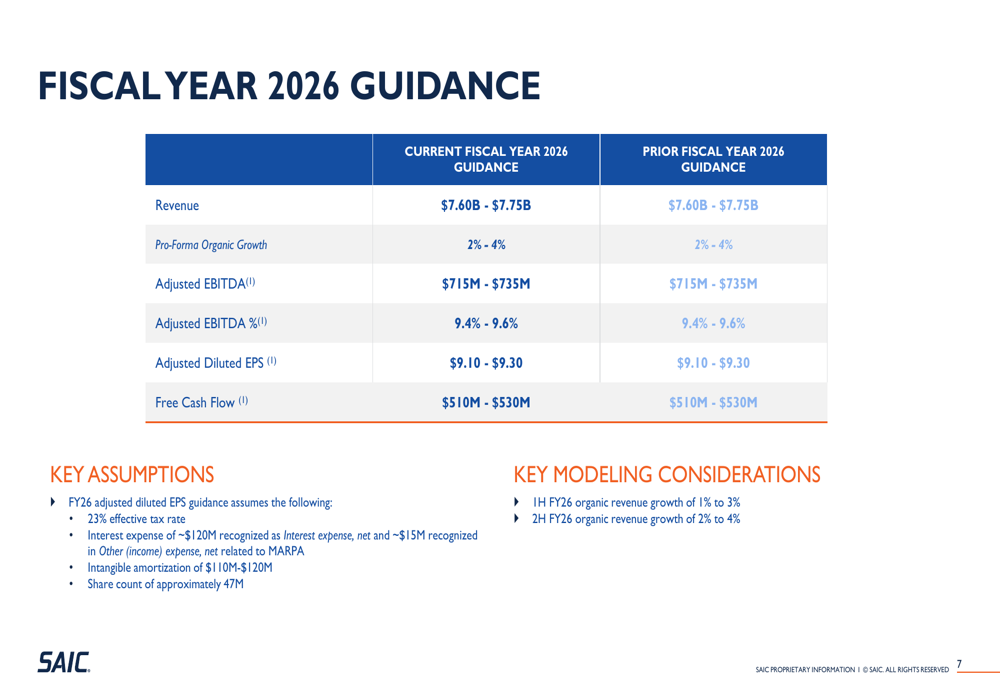
Management’s key modeling assumptions include a 23% effective tax rate, approximately $120 million in interest expense, $15 million related to MARPA, $110-120 million in intangible amortization, and a weighted average share count of approximately 47 million. The company expects slightly stronger organic growth in the second half of FY26 (2-4%) compared to the first half (1-3%).
Strategic Initiatives
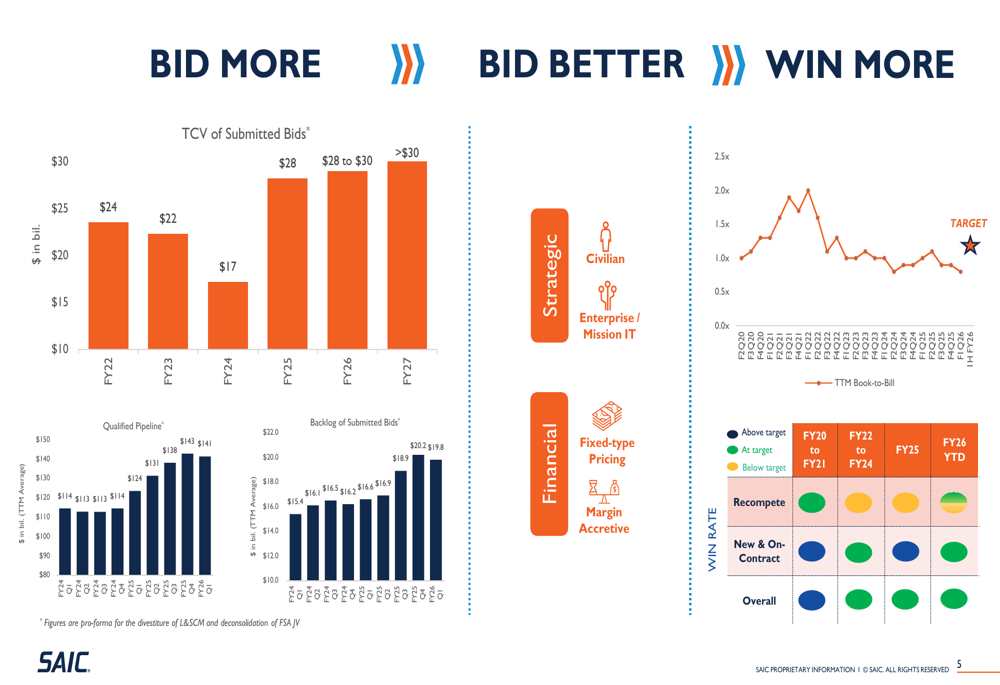
SAIC’s presentation emphasized its "Bid More, Bid Better, Win More" strategy, which has resulted in a significant increase in the total contract value of submitted bids. The company is targeting between $28-30 billion in submitted bids for FY26, up from $17 billion in FY23, with further growth expected in FY27.
The company’s business development metrics show positive momentum:
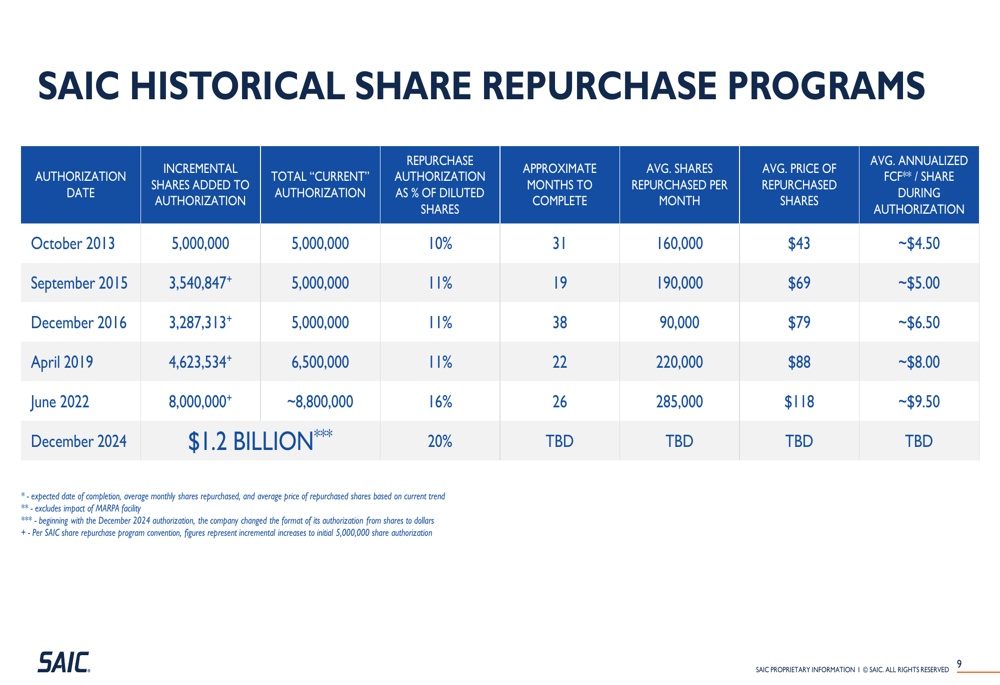
Capital allocation remains heavily focused on share repurchases, with the company announcing a $1.2 billion authorization in December 2024. This represents approximately 20% of diluted shares, continuing SAIC’s trend of aggressive share count reduction. The company has reduced its weighted average shares outstanding from 53.7 million in FY24 to a projected 47 million in FY26, with further reductions to approximately 45 million expected by FY27.
The historical share repurchase programs demonstrate SAIC’s consistent commitment to returning capital to shareholders:
Forward-Looking Statements
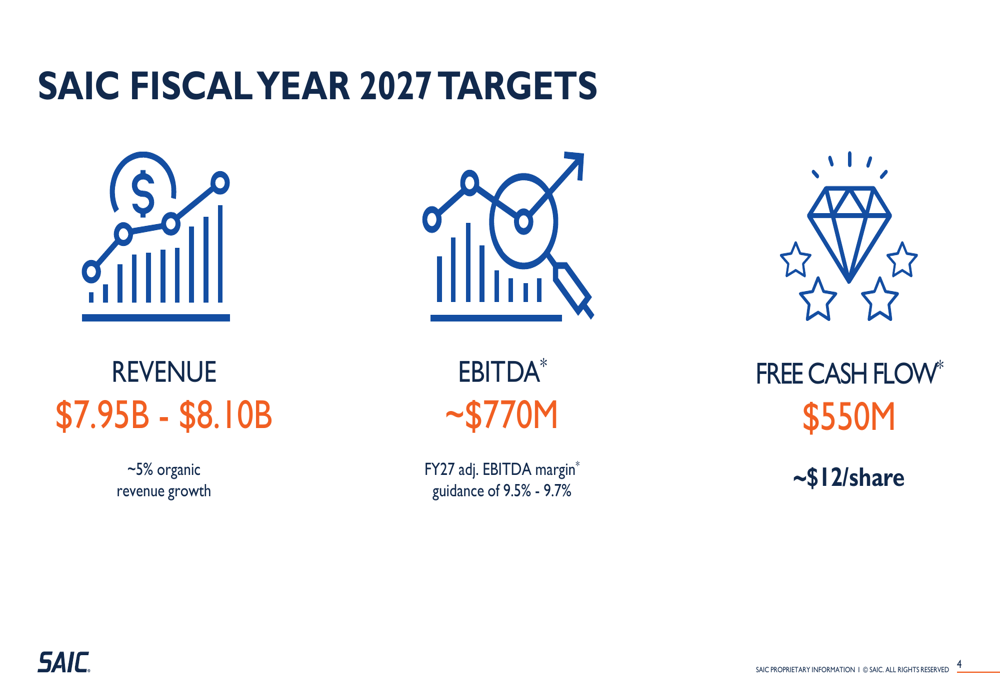
Looking beyond FY26, SAIC outlined ambitious targets for FY27, including revenue of $7.95-8.10 billion (representing approximately 5% organic growth), adjusted EBITDA of approximately $770 million (9.5-9.7% margin), and free cash flow of $550 million (approximately $12 per share).
The company’s multi-year financial trajectory is detailed in this comprehensive overview:
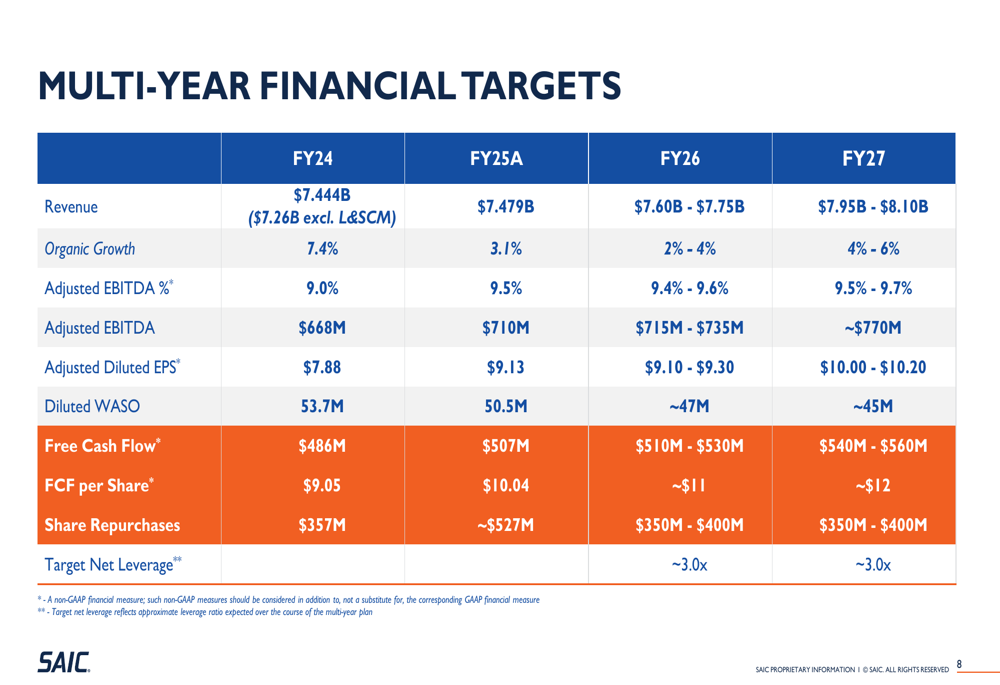
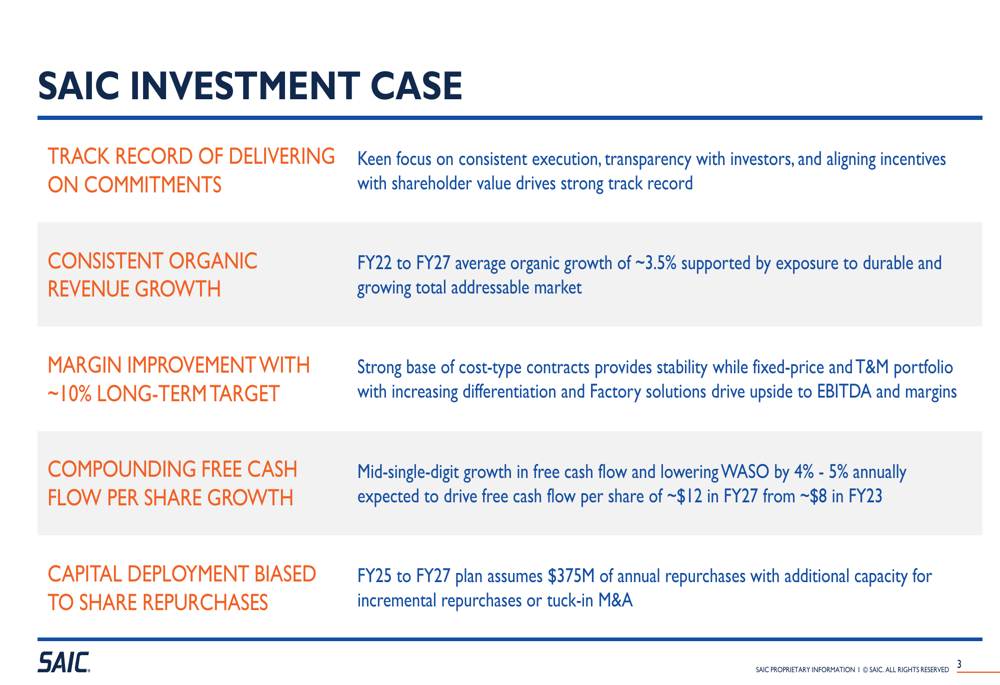
SAIC’s long-term investment case centers on four key pillars: consistent execution and transparency, organic revenue growth averaging 3.5% from FY22-27, margin improvement with a 10% long-term target, and compounding free cash flow per share growth. The company’s capital deployment strategy remains biased toward share repurchases, with $375 million planned annually from FY25-27.
The investment case is summarized in the following slide:
Analyst Perspectives
While the Q1 results fell short of the momentum established in Q4 FY25 (when SAIC reported EPS of $2.57, significantly beating the $2.08 forecast), management’s maintained guidance suggests confidence in the company’s ability to recover throughout the remainder of the fiscal year.
The key question for investors is whether the Q1 margin pressure and negative free cash flow represent temporary challenges or the beginning of a more persistent trend. SAIC’s ability to accelerate organic growth in the second half of FY26 will be crucial to meeting its full-year targets and maintaining credibility for its longer-term FY27 objectives.
SAIC’s FY27 financial targets are illustrated below:
The company’s performance in upcoming quarters will be closely watched for signs of margin recovery and a return to positive free cash flow generation, which would support management’s assertion that the Q1 challenges were temporary rather than structural.
Full presentation:
This article was generated with the support of AI and reviewed by an editor. For more information see our T&C.