German construction sector still in recession, civil engineering only bright spot

U.S. Global Investors Inc. (NASDAQ:GROW) presented its second quarter fiscal 2025 results on May 9, 2025, revealing a challenging financial period despite strong performance from its ETF products. The investment management firm, which specializes in gold, airlines, and other niche sectors, reported declining revenue and a shift to net loss while continuing to focus on shareholder returns and strategic expansion.
Quarterly Performance Highlights
The company reported total operating revenues of $2.2 million for the quarter ended December 31, 2024, representing a 21% decrease from $2.8 million in the same period last year. Operating expenses increased by 5.5% to $2.77 million, resulting in an operating loss of $539,000 compared to operating income of $192,000 in Q2 2024.
U.S. Global Investors posted a net loss of $86,000 or $0.01 per share, a significant decline from net income of $1.23 million or $0.09 per share in the prior year’s quarter. The company maintained average assets under management of $1.5 billion during the period.
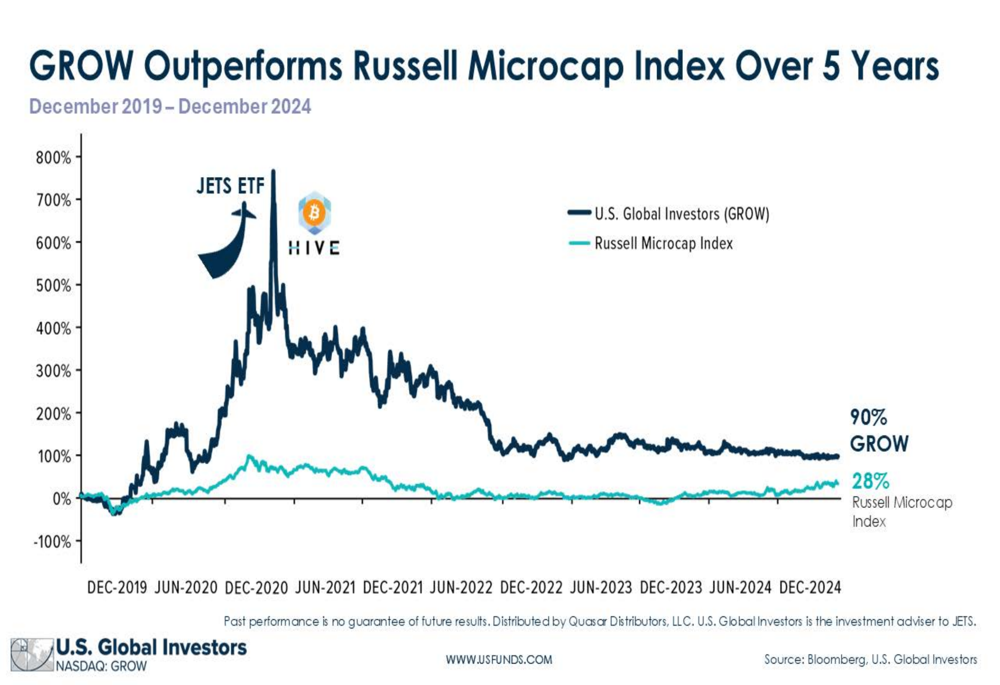
As shown in the following chart, GROW has outperformed the Russell Microcap Index over the past five years, delivering a 90% return compared to the index’s 28% gain, despite the recent quarterly challenges:
ETF Performance & Strategic Initiatives
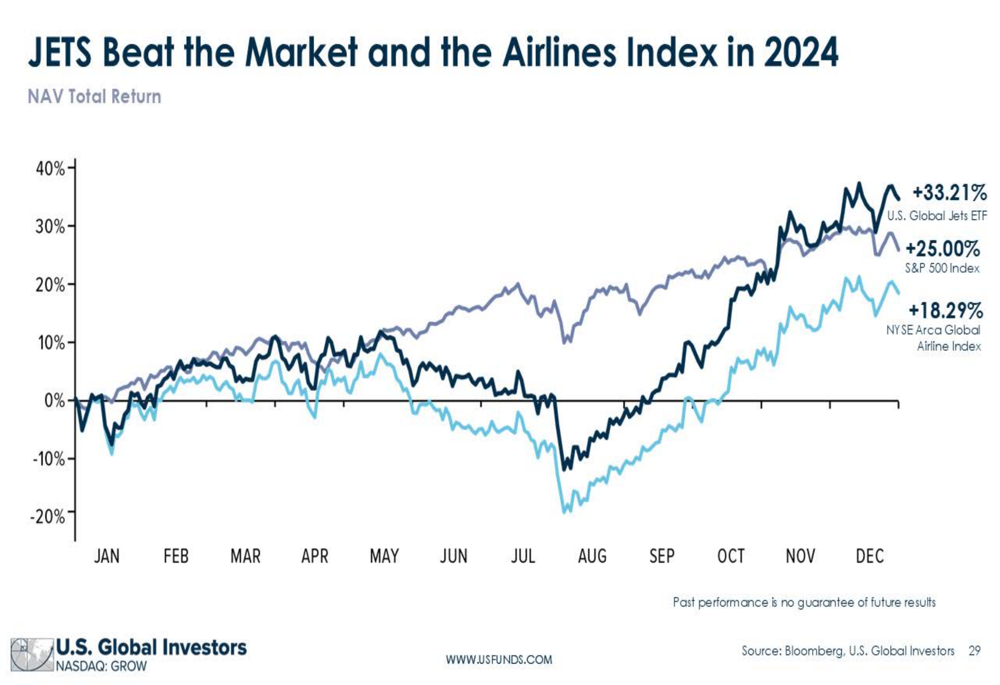
Despite the company’s overall financial challenges, its ETF products demonstrated strong performance. The U.S. Global Jets ETF (NYSE:JETS) delivered a 33.21% return in 2024, outperforming both the NYSE Arca Global Airline Index (18.29%) and the S&P 500 Index (25.00%).
The following chart illustrates JETS’ outperformance relative to its benchmark and the broader market:
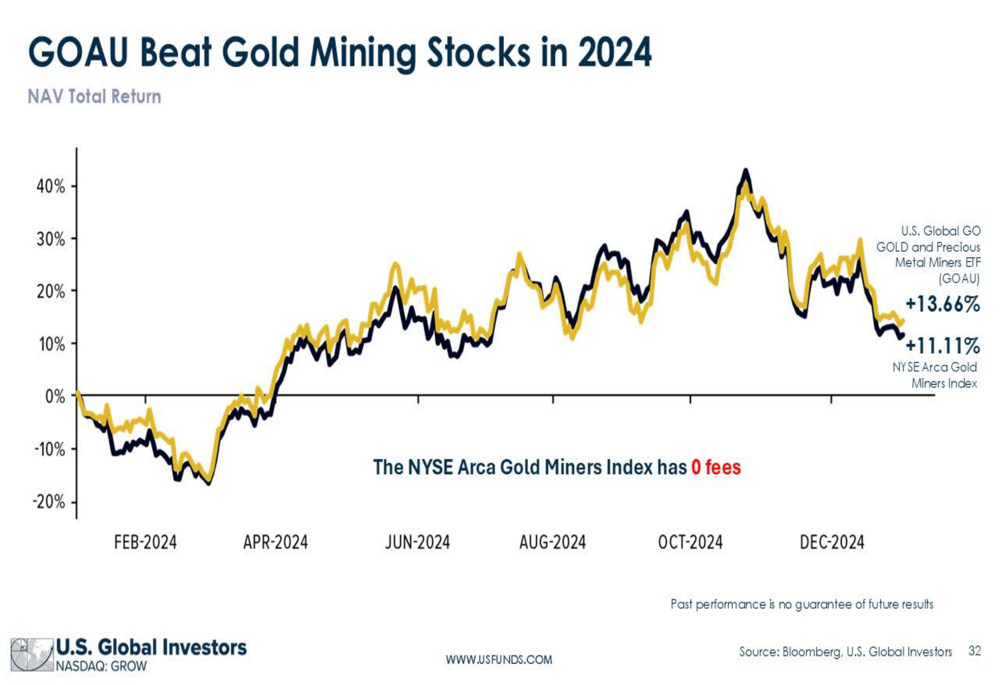
Similarly, the company’s U.S. Global GO GOLD and Precious Metal Miners ETF (NYSE:GOAU) achieved a 13.66% return in 2024, exceeding the NYSE Arca Gold Miners Index’s 11.11% return:
CEO Frank Holmes emphasized the company’s "Smart Beta 2.0" investment strategy, which combines quantitative and fundamental approaches to optimize portfolio construction. This strategy has been applied to the company’s newest offering, the U.S. Global Technology and Aerospace & Defense ETF (NYSE:WAR), launched on December 30, 2024.
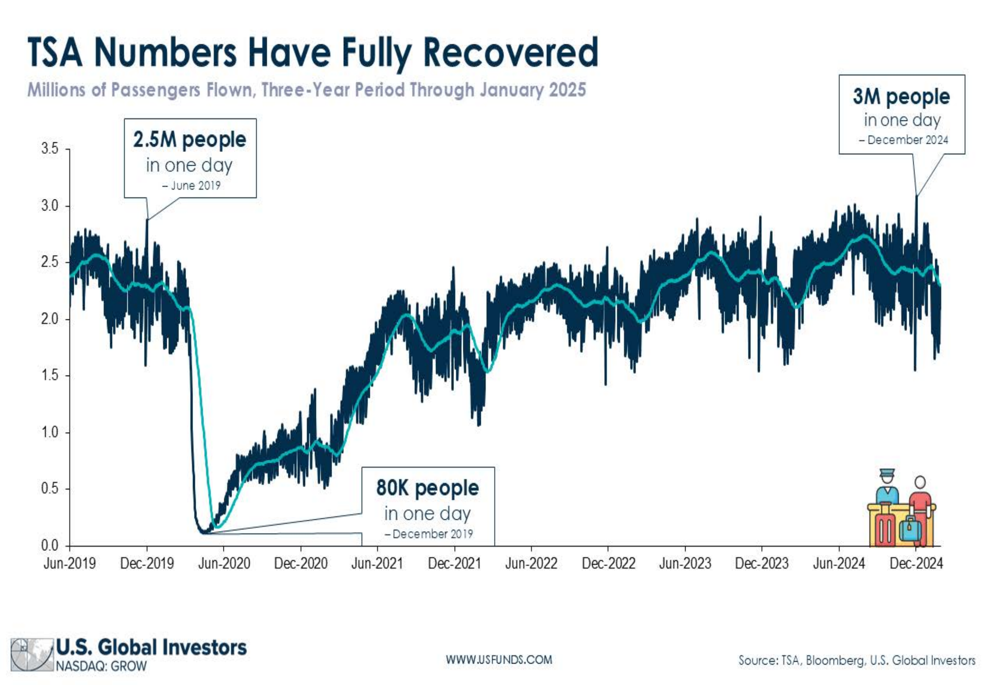
The company highlighted the recovery in airline passenger volumes as a positive trend supporting its JETS ETF. TSA passenger numbers have fully recovered from pandemic lows, with daily throughput reaching 3 million passengers by December 2024:
Competitive Positioning
U.S. Global Investors presented a comparative analysis against key competitors WisdomTree and Invesco, highlighting its lower price-to-book ratio and competitive dividend yield:
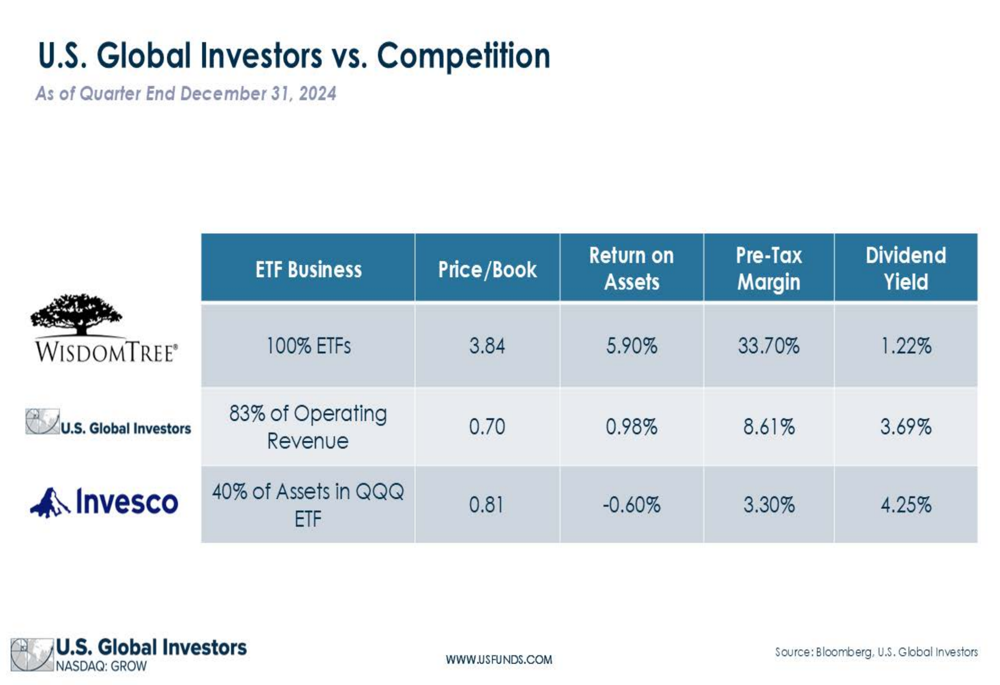
The company derives 83% of its operating revenue from ETFs, positioning it between WisdomTree (100% ETFs) and Invesco (40% of assets in QQQ ETF). While GROW’s return on assets (0.98%) and pre-tax margin (8.61%) lag behind WisdomTree’s metrics, they exceed Invesco’s performance in these areas.
Shareholder Value & Capital Allocation
Despite the challenging quarter, U.S. Global Investors maintained its focus on returning value to shareholders through dividends and share repurchases. The company has paid a monthly dividend since June 2007, currently at $0.0075 per share, representing a 3.67% yield at the February 7, 2025 share price of $2.45.
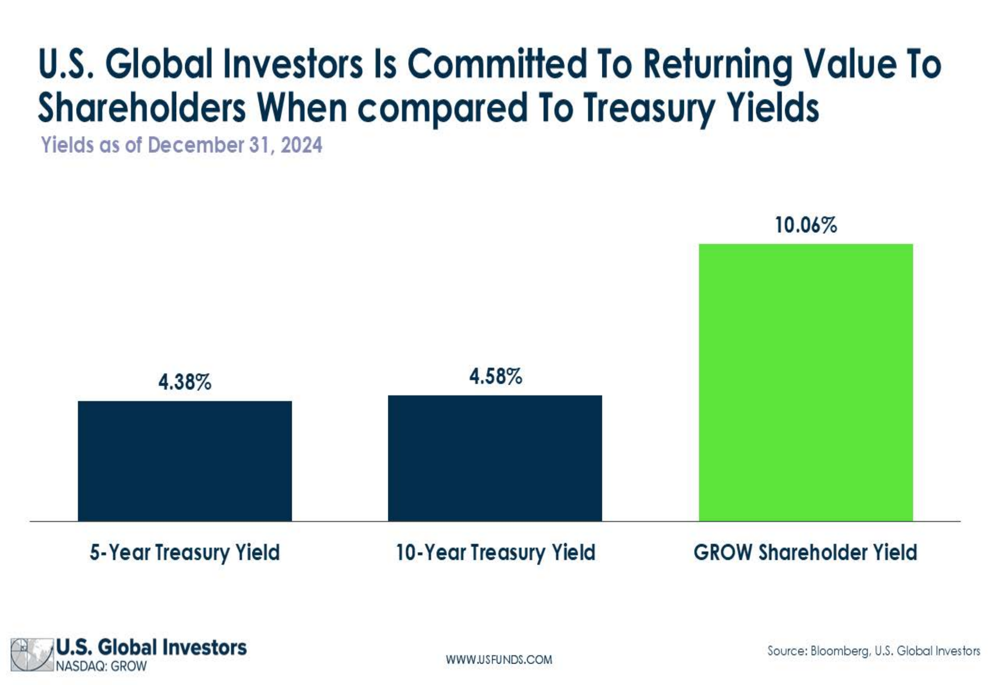
The company highlighted its shareholder yield of 10.06%, which compares favorably to the 5-Year Treasury Yield of 4.38% and 10-Year Treasury Yield of 4.58%:
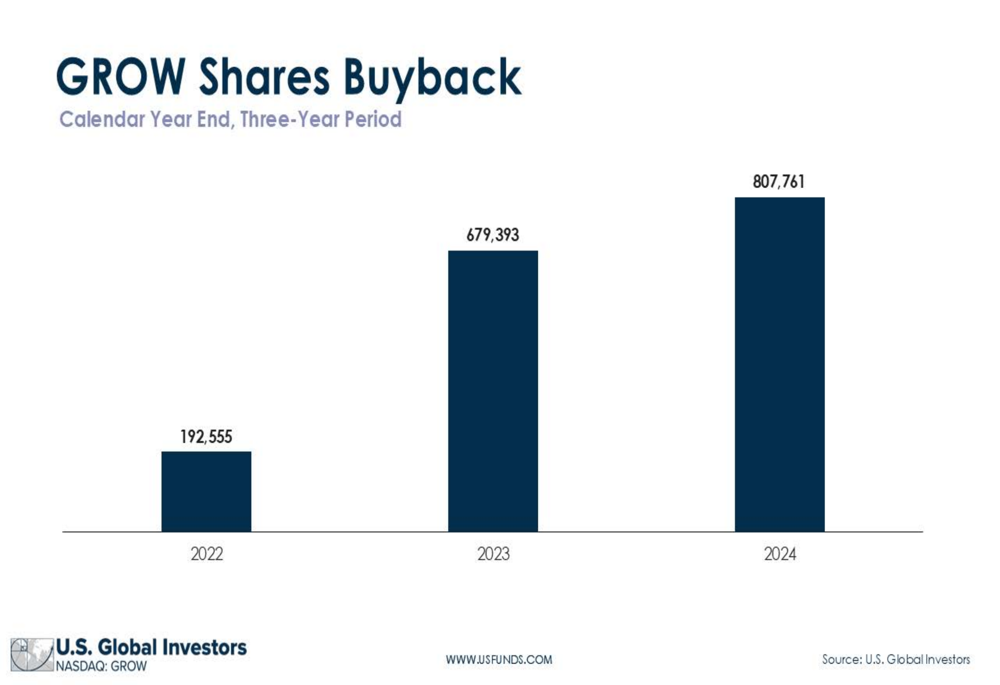
U.S. Global Investors has consistently increased its share buyback activity, repurchasing 807,761 shares in calendar year 2024, up from 679,393 shares in 2023 and 192,555 shares in 2022:
For the three months ended December 31, 2024, the company repurchased 236,731 class A shares using approximately $587,000 in cash. Frank Holmes, who owns approximately 19% of the company with 99% voting control, emphasized the company’s belief that its stock is undervalued.
Balance Sheet Strength & Forward Outlook
Despite the revenue and earnings challenges, U.S. Global Investors maintained a strong balance sheet with $39.97 million in current assets as of December 31, 2024, and total assets of $50.11 million. The company’s current ratio stands at approximately 20:1, reflecting substantial liquidity.
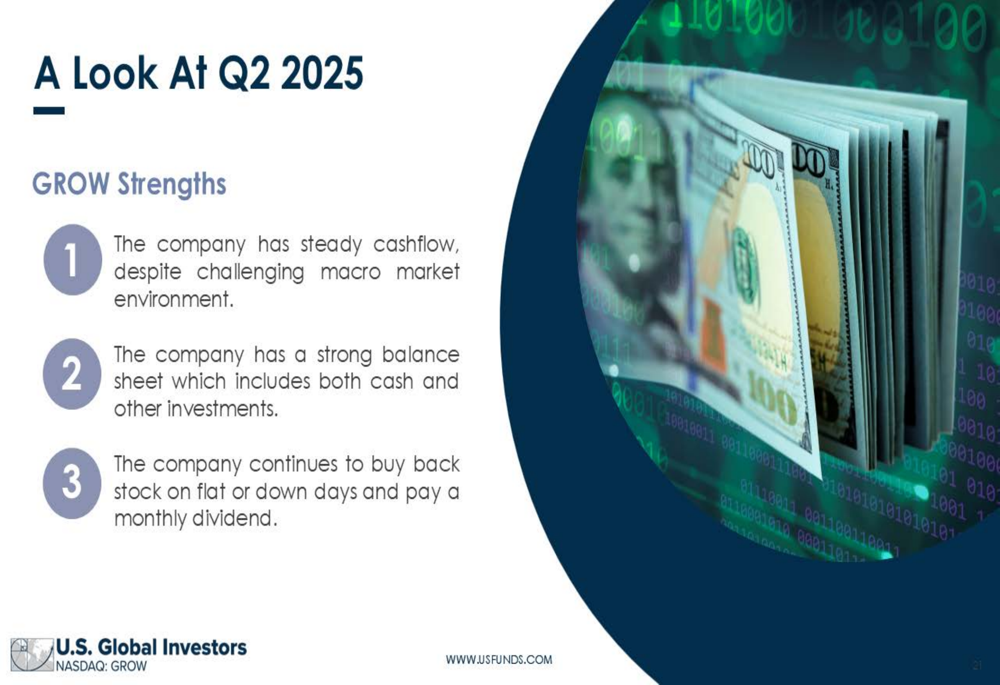
Looking forward, the company identified three key strengths: steady cash flow despite challenging market conditions, a strong balance sheet with cash and investments, and continued commitment to stock buybacks and monthly dividends:
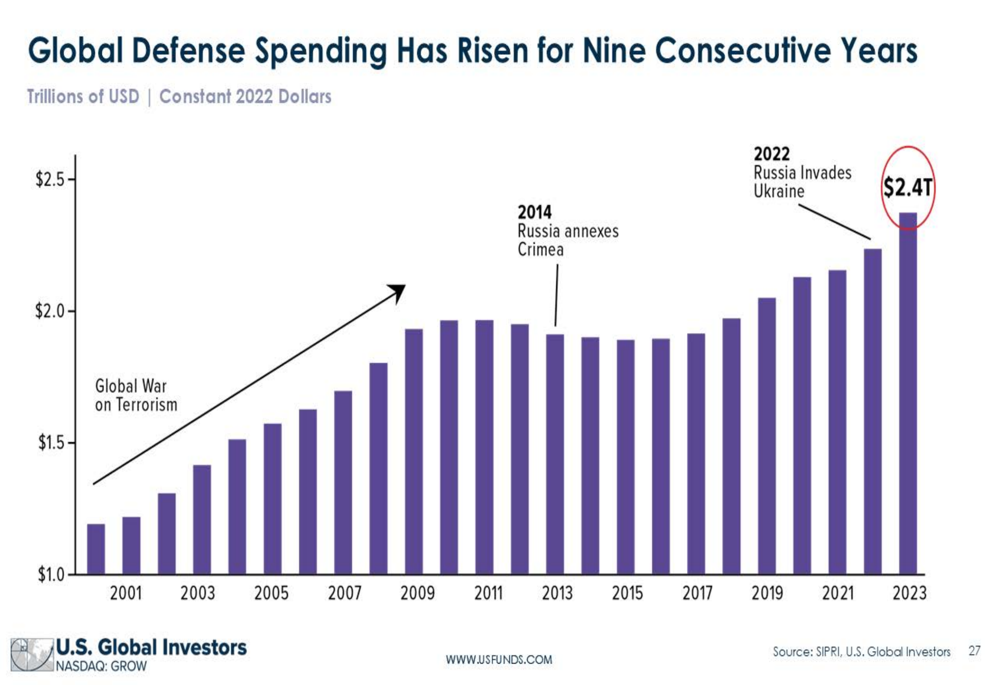
The company also highlighted global defense spending trends as a tailwind for its new WAR ETF, noting that worldwide defense expenditures have risen for nine consecutive years, reaching $2.4 trillion in 2023:
U.S. Global Investors remains focused on its long-term strategy of creating thematic products, pursuing M&A opportunities to acquire fund assets, and growing its subscriber base, while navigating the current challenging revenue environment.
Full presentation:
This article was generated with the support of AI and reviewed by an editor. For more information see our T&C.