SoFi stock falls after announcing $1.5B public offering of common stock
This article was written exclusively for Investing.com. Part I}} was published yesterday.
On Monday I discussed the fact that there is no single “Market” that represents your portfolio, but that does not stop the media from selecting one when discussing the day’s action in the various securities markets. The Dow is usually the index most often used, if for no other reason than the fact the big numbers get people’s attention.
At first blush, the Standard & Poors 500 Index looks like a far better choice to measure your results against. Unless, of course, you have a well-balanced portfolio that includes smaller but still-listed companies with market capitalizations only up to $2.5 billion or so. Or your holdings also include some mid-capitalization companies in the $2.5 billion to $10 billion range. Or a number of bonds, bunds, REITs or defensive income holdings. Should this be the case, you may have just created a well-diversified portfolio that offers downside protection and growth at all levels.

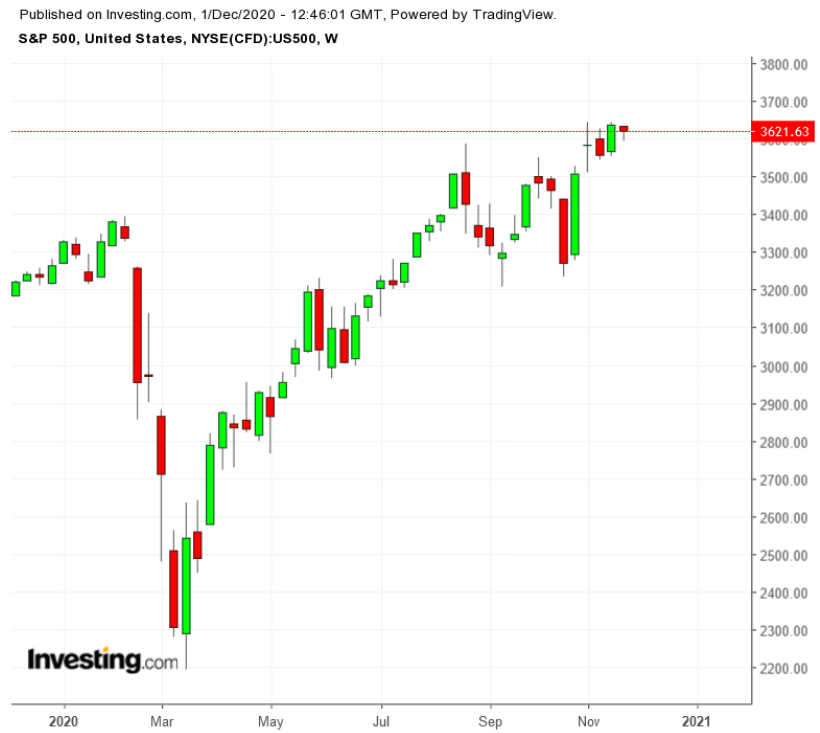
But that would not be what the S&P 500 measures! 'The S&P' is a capitalization-weighted index that takes into account not just price, but price times the number of shares outstanding. This feature means that it's an index that seeks the 500 largest corporations in the U.S. by market capitalization. It was begun in 1923, but only became a 500-stock index in 1957.
For investors, it has evolved that indexing "the market" with the cap-weighted S&P 500 still means putting most of your money into only a certain slice of what most people choose to invest in. This is because the companies with the highest prices and the largest number of shares outstanding make up a bigger portion of the index’s value and therefore affect its performance much more than the smaller (but still big enough to be among the 500 largest) do.
Some S&P 500 companies have market caps in excess of $1 trillion, which is some 200 times larger than the smallest S&P 500 components, which are still pretty big (though not by comparison), having market caps of $6 billion or $7 billion.
The S&P 500 is the index most professionals use as their benchmark when comparing their own investing performance, since it is considered the most representative of American business and industry, manufacturing and services. An investment in the S&P index gives you about an 80% share of US business revenues. But it is all about price appreciation and dividends paid, though the average dividend of the entire S&P today is less than 2%—hardly a factor for retirees (or non-retirees) looking for income.
If the S&P 500 plunges one day, your portfolio, if comprised of the aforementioned defensive securities, REITs or income stocks and income funds, will likely do better than the S&P (and the also very large-capitalization Dow, for that matter.)
On the other hand, if the S&P 500 were to roar ahead the next day, this very same portfolio might leave you confused—or angry at whoever advised you on the benefits of being more the tortoise than the hare in your investing. Just remember, it's no fable; in investing, the tortoise usually wins over time.
The S&P 500, like the Dow, is also rebalanced with some frequency. Underperformers that cannot maintain listing standards should, of course, be booted. But too often, just like the Dow, the committee that decides which companies should be included do not merely boot those firms out and replace them with the next appropriate one in line. Oh, no.
The most recent ‘we really need to stay current in our holdings’ decision—not the original charter of the index—has slotted Tesla (NASDAQ:TSLA) into the benchmark at a point rather higher than #500. The high-flying electric carmaker may or may not be overtaken by far deeper-pocketed rivals in the coming years but certainly, for today, it helps the S&P’s sex appeal by adding a company up more than 900% in the last 12 months.
While you dwell upon that, allow me to move on to the third of the most popular stock benchmarks, the NASDAQ Composite. The NASDAQ is also a market capitalization weighted index, this time of the roughly 2000-plus companies which trade on the NASDAQ exchange.
“Relatively” recently founded in 1971, the composition of “the Naz” is heavily weighted towards information technology companies, which were initially too small or too unprofitable to be considered for listing on the older, at-that-time-bigger exchanges.

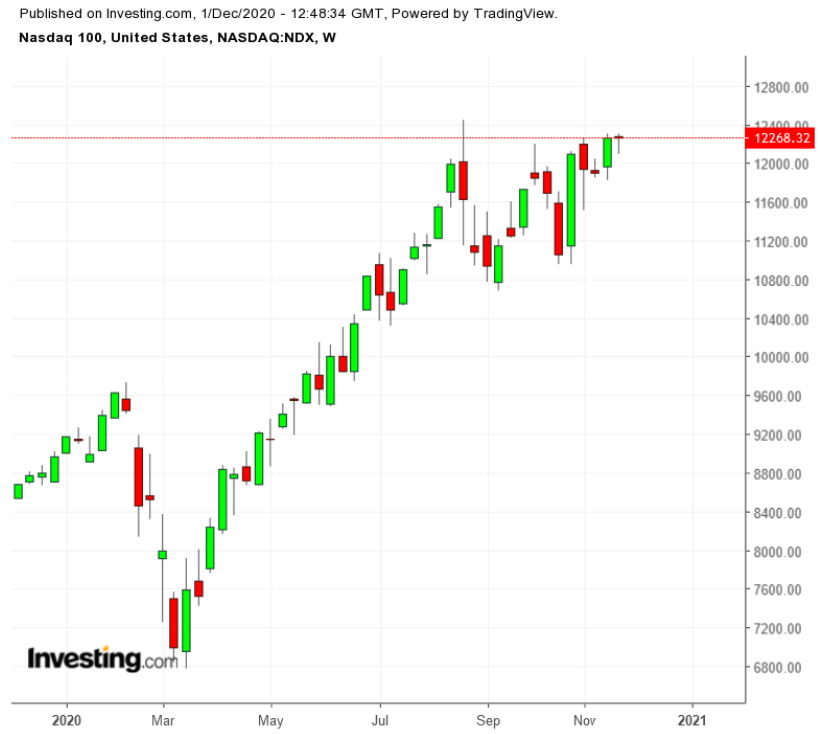
While the Composite represents more than 2000 separate companies, the NASDAQ 100, a subset of the NASDAQ Composite, accounts for over 90% of the NASDAQ Composite's movement. And the top 10 stocks in the NASDAQ Composite by themselves account for one-third of the index’s performance.
All the Big Three indexes mentioned above engage in the practice of exchanging old names for new, often in what is or at least what can seem a rather arbitrary manner. This makes a certain sense as I noted. We often think the powerhouses of our generation are invincible—but in a nation where individual initiative flourishes and people invent whole new industries in less than a decade, progress comes fast and often from unexpected directions.
Remember this 10 years from now (or less?) when operating systems are free for the taking, bandwidth costs virtually nothing and a biocomputer or photon computer renders silicon "old news." Even one of my favorite industries for the next 10-20 years, oil and gas, will one day be supplanted by advances in photovoltaics.
I promised I would also mention the Russell 2000. In 1984 the Frank Russell Company, in an attempt to be more inclusive of more securities, created the Russell 3000. This index represents nearly 98% of the investable U.S. stock market.
It's the benchmark I use to ensure that my portfolios always have some smaller, hopefully up-and-coming companies represented. Lots of other portfolio managers agree with me; many mutual funds and ETFs are tied to or based on the Russell 2000.
And unlike the three previous indexes, especially the Dow and the S&P, the average value for a company on the Russell 2000 today is $2.1 billion. Most of these firms are not big enough to engage in international trade so what some see as a benefit to the R2000 is that it is a better bellwether of the American economy because its components are more domestically focused businesses.
There are scores more indexes out there, some for mid-cap U.S. companies, others are variations on the above themes, and many delve down deeper into the sector or industry level. I always advise clients and readers to notice the various benchmarks but to judge their own portfolio by a far more important measure.
Our personal benchmark should be “Am I closer to reaching my goals than I was x years ago,” not “Did I beat the Dow today? Did I? Did I?”
Investing ideas from the indexes mentioned
I will cite 3 specific issues from my own portfolios with a brief thumbnail sketch. This is just an introduction to these companies. Upon request, I may be able to do a more in-depth analysis here on Investing.com.
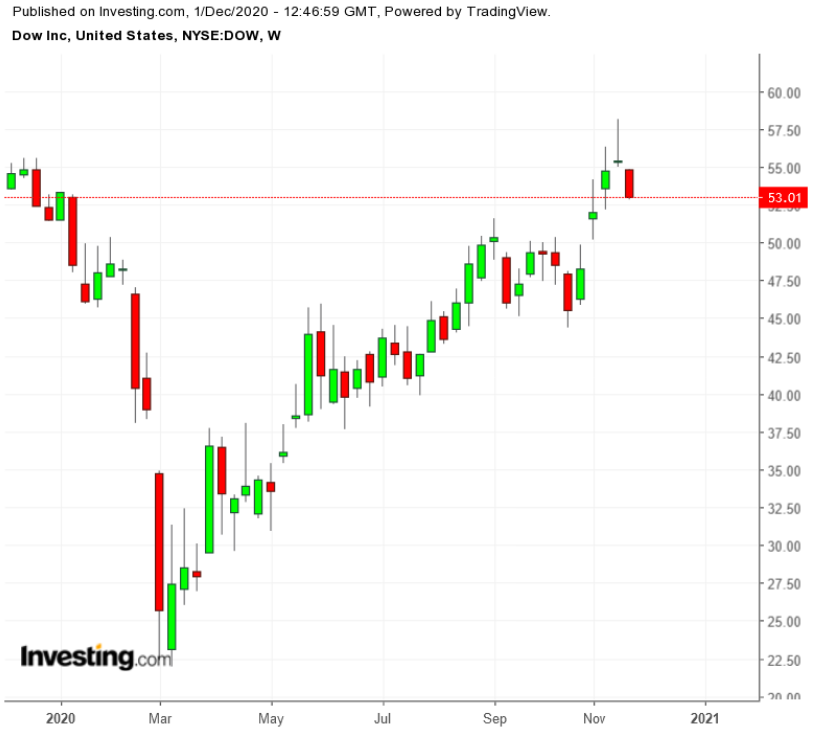
From the venerable old Dow, I have owned many equities over the years and 3 this year. Right now, however, I am long only Dow Inc (NYSE:DOW), no relation whatsoever to the index. I bought it on July 20, 2020 at $41.48. It is currently at $55.40.

One of the smaller components among the 30 Dow giants, I bought Dow Inc because they are a leader in chemicals and materials science. Yet they were quite cheap relative to what I believed their prospects to be. The Midland, Michigan-based company is quite strong internationally, making it less dependent upon any one economy, and it supplies the most basic and essential ingredients for products that hundreds of millions of people around the world need to use every day. The company has 36,000 employees spread over 31 countries with more than 100 plants making their massive array of ingredients and products.
Next up: Comcast (NASDAQ:CMCSA). It's the 19th biggest factor in the S&P 500—and this behemoth still carries a weighting just one-eighth that of Apple! I bought Comcast because I believe media—whether social, unsocial or anti-social—will be a large part of our future. I bought my shares on June 29, 2020 at $38.65. The current price is $51.75.
The cable subsidiary of CMCSA provides high-speed internet, video, voice, wireless, and more to residential and business customers under the Xfinity brand. The company also owns both NBC and Telemundo broadcast networks. Their film division is comprised of such well-known names as Universal Pictures, Illumination, DreamWorks Animation, and Focus Features. Its Theme Parks segment operates Universal theme parks in Orlando, Florida; Hollywood, California; and Osaka, Japan. It also owns the Sky News broadcast network and Sky Sports networks, as well as the Philadelphia Flyers.
Why do I own Comcast? Media, media and more media.
Finally, as of yesterday, I own shares of the Baron Discovery Fund (BDFFX). Baron is one of my go-to mutual fund companies. (I own 5 of their different funds for different goals.) I like Baron’s philosophy that they are absolutely agnostic when it comes to predicting “market” events. You can read 100 different opinions about the vector of the Biden presidency or the likelihood EU regulators will or won’t rein in Big Tech, etc. But really… no one knows. Baron gets that, and buys when the prices are right for the best companies they can find and sells when they are no longer the best companies.
Baron Discovery (NASDAQ:{{6382|DISCA) is one of the company’s three small-cap funds. It is, as the name might imply, the one that looks for the most innovative companies in the small cap universe. In that sense it might be considered a bit more risky than the other two Baron funds in this asset class. I don’t think so.
I believe, while some may fall by the wayside, small caps are overdue for a big rally as we rotate out of the over-priced huge caps. The innovators that survive in this area will more than make up for the occasional ones that do not. BDFFX is up 47% year-to-date. I believe there is much more runway ahead than behind it.
Caveat: Unless you are a client of Stanford Wealth Management, I do not know your personal financial situation. Therefore, I offer my opinions above for your due diligence and not as advice to buy or sell specific securities.
