Fubotv earnings beat by $0.10, revenue topped estimates
(Adds oil settlement prices, comment)
* China push to remove recent U.S. tariffs seen as positive
* Wall Street at all-time high puts damper on stock rally
* Bond yields rising globally as recession fears recede
By Herbert Lash
NEW YORK, Nov 5 (Reuters) - The U.S. dollar and crude prices
rose on Tuesday, spurred by continuing optimism a U.S.-China
trade deal may be near, while a rally in global equity markets
edged higher after China pressed U.S. President Donald Trump to
remove recently imposed tariffs.
MSCI's gauge of global stock markets set a fresh 21-month
high and the Nasdaq and Dow Jones industrial average hit new
intraday record peaks.
U.S. and European government bond yields climbed, lifted by
trade optimism and more upbeat economic data. China's push to
remove more U.S. tariffs imposed in September as part of a
"phase one" trade deal boosted optimism a trade deal was near.
"You're seeing a continuation of optimism around a potential
trade agreement to come with China as referenced by the
potential removal of tariffs in December," said Michael James,
managing director of equity trading at Wedbush Securities in Los
Angeles. "It's just another leg towards a potential agreement."
Solid corporate earnings and upbeat data also provided
equities a lift. More than three-quarters of the S&P 500
companies that have reported results so far have beaten profit
expectations, Refinitiv data showed.
ISM's services data showed a reading of 54.7 in October from
52.6 the prior month, or above expectations of 53.4, according
to economists polled by Reuters. The data was the latest to ease
lingering concerns about a slowdown in the U.S. economy.
MSCI's gauge of stock indexes in 47 countries
.MIWD00000PUS edged higher by 0.05%. The pan-European STOXX
600 index of small, mid-sized and large stocks .STOXX and the
FTSEurofirst 300 index .FTEU3 of leading regional shares both
rose 0.2%.
On Wall Street, the Dow Jones Industrial Average .DJI rose
71.96 points, or 0.26%, to 27,534.07. The S&P 500 .SPX lost
0.31 points, or 0.01%, to 3,077.96 and the Nasdaq Composite
.IXIC added 11.22 points, or 0.13%, to 8,444.42.
In Asia, optimism was helped by the People's Bank of China's
cut in its medium-term lending rate, the first since early 2016.
It was only a token 5 basis points to 3.25%, but it underscored
Beijing's ongoing desire to support the economy.
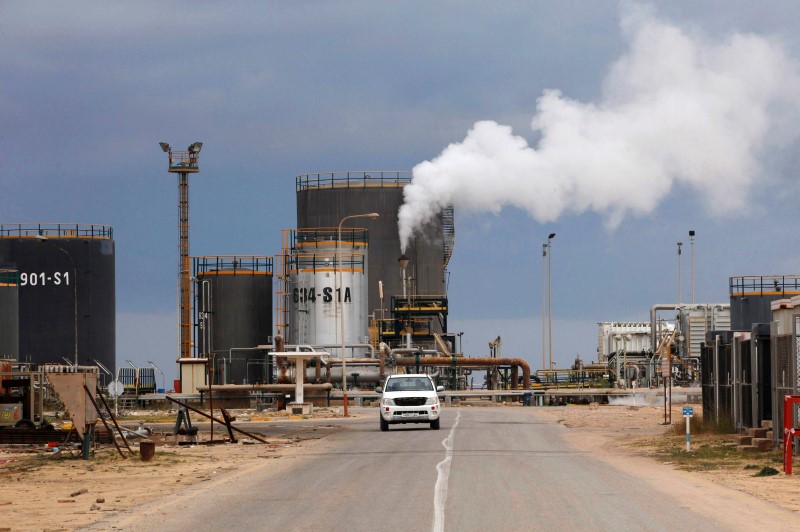
Oil prices rose more than 1% on hopes of a trade deal while
gold fell more than 1%, en route to its biggest one-day dip in
more than a month. O/R
Also driving crude higher were remarks by OPEC
Secretary-General Mohammad Barkindo, who said the oil market
outlook for 2020 may be brighter than previously forecast,
appearing to downplay any need for deeper production cuts.
Brent crude LCOc1 futures for January delivery settled 83
cents higher at $62.96 a barrel, while U.S. West Texas
Intermediate (WTI) crude CLc1 futures rose 69 cents to settle
at $57.23 a barrel.
The safe-haven yen and Swiss franc slid, as did gold.
The dollar index .DXY rose 0.48%, with the euro EUR=
down 0.55% to $1.1065. The Japanese yen JPY= weakened 0.59%
versus the greenback at 109.23 per dollar.
U.S. gold futures GCcv1 settled down 1.8% at $1,483.70.
Benchmark 10-year U.S. Treasury notes US10YT=RR fell 21/32
in price to yield 1.8619%. The S&P financial sector .SPSY was
the biggest gainer of the 11 sectors.
A steady rise in bond yields has been a big tailwind for
financial stocks and has been one of the biggest contributors to
the continued strength in equities, James said.
"Outside some significant macroeconomic downside shock, the
market continues to reluctantly trade higher," he said.
The 10-year U.S. Treasury barely yielded 1.5% in early
October.
Germany's 10-year bond yield rose as high as -0.308%
DE10YT=RR , while the French 10-year hit -0.006% FR10YT=RR to
within striking distance of positive territory.
U.S. non-manufacturers ISM index https://tmsnrt.rs/2JMLMjB
World stocks surge $10 in 2019 https://tmsnrt.rs/2JRIM5J
^^^^^^^^^^^^^^^^^^^^^^^^^^^^^^^^^^^^^^^^^^^^^^^^^^^^^^^^^^^>
