

Metrics to compare | PROC | Sector Sector - Average of metrics from a broad group of related Consumer Non-Cyclicals sector companies | Relationship RelationshipPROCPeersSector | |
|---|---|---|---|---|
P/E Ratio | 35.3x | 44.3x | 11.5x | |
PEG Ratio | −7.70 | 1.77 | 0.03 | |
Price/Book | 37.0x | 9.3x | 1.5x | |
Price / LTM Sales | 6.6x | 6.2x | 0.9x | |
Upside (Analyst Target) | 26.1% | 17.6% | 23.8% | |
Fair Value Upside | Unlock | −1.6% | 14.1% | Unlock |
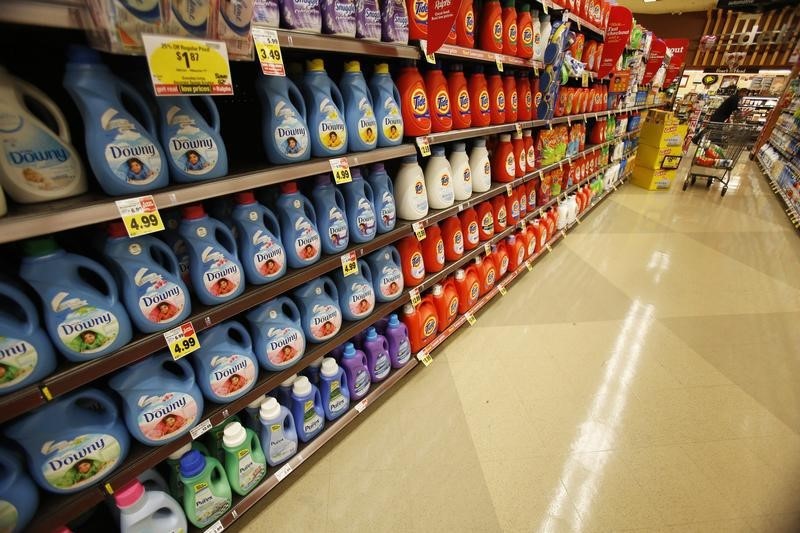
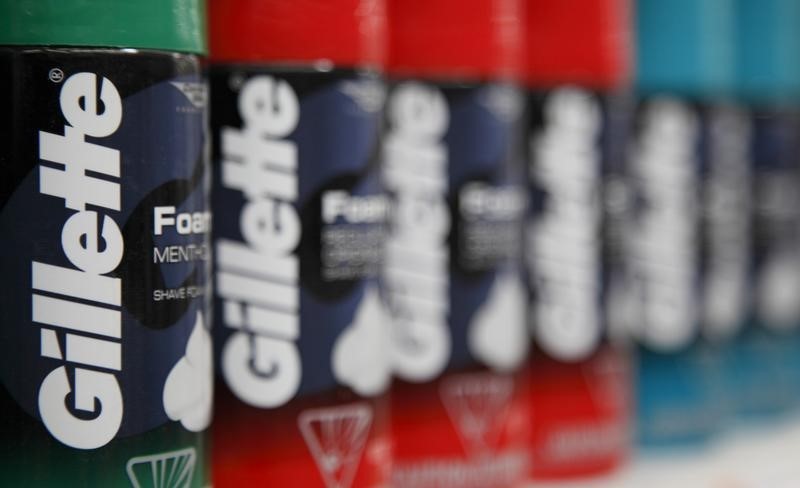
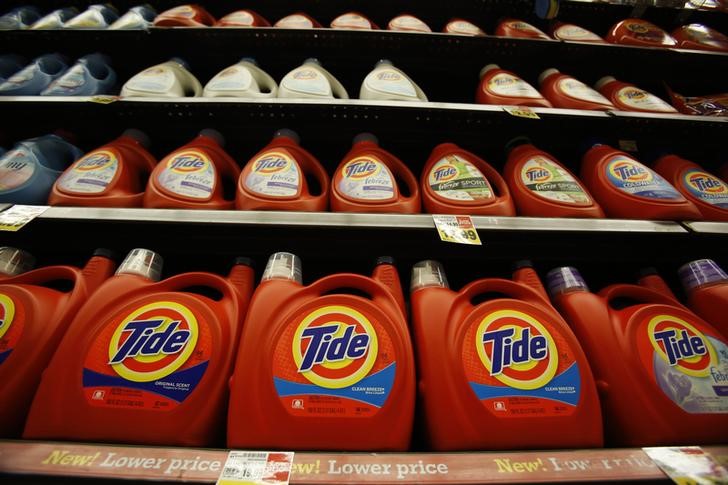
Procter & Gamble Hygiene and Health Care Limited manufactures and sells branded packaged fast-moving consumer goods in the feminine care and healthcare businesses in India and internationally. It operates through Health care Products and Hygiene Products segments. The company offers health care products, including ointments and creams, cough drops, and tablets; and hygiene products, such as feminine hygiene and other skin care hygiene products, as well as feminine care pads. It also provides baby care products comprising nappies, pants, and baby wipes; grooming products; laundry products; hair care products; home, personal and skin care, and oral products. The company sells its products under the Vicks, Whisper, Pampers, Ariel, Tide, Gillette, Head & Shoulders, Herbal Essences, Pantene, Ambi Pur, Oral-B, Olay, and Old Spice brands through mass merchandisers, as well as grocery, membership club, drug, department, and high frequency stores. The company was incorporated in 1964 and is based in Mumbai, India. Procter & Gamble Hygiene and Health Care Limited operates as a subsidiary of The Procter & Gamble Company.