Renault SA (RENA)

Currency in EUR
32.43
+0.68(+2.14%)
Closed·
RENA Scorecard
Full Analysis
High shareholder yield
High dividend Yield
RENA is included in our AI-picked strategies. See how they work
Fair Value
Day's Range
31.9232.52
52 wk Range
30.8753.26
Key Statistics
Prev. Close
31.75
Open
32
Day's Range
31.92-32.52
52 wk Range
30.87-53.26
Volume
1.21M
Average Volume (3m)
1.29M
1-Year Change
-20%
Book Value / Share
73.57
Fair Value
unlockUnlock
Fair Value Upside
unlockUnlock
RENA Scorecardpro icon
Company’s Health
Unlock
Fair Value
Unlock Price
Fair Price
Upside
Price Target
47.94
Upside
+47.84%
Members' Sentiments
Bearish
Bullish
ProTips
Has raised its dividend for 3 consecutive years

Renault SA News & Analysis

Show more

Technical Analysis

Summary
Strong Sell
Sell
Neutral
Buy
Strong Buy
Strong Buy
Technical Indicators
Strong Buy
Moving Averages
Buy

Renault SA Company Profile

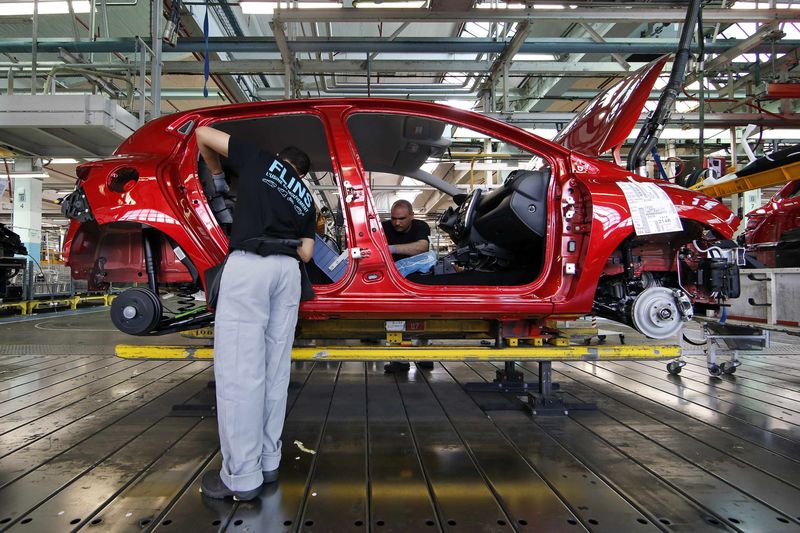
Renault SA engages in the design, manufacture, sale, repair, maintenance, and leasing of motor vehicles in Europe, Eurasia, Africa, the Middle East, the Asia Pacific, and the Americas. The company operates through Automotive, Sales Financing, and Mobility Services segments. The Automotive segment produces, sells, and distributes passenger cars and light commercial vehicles. The Sale Financing segment is involved in the sales financing, rental, maintenance, and service contracts under the Mobilize Financial Services brand. The Mobility Services segment provides mobility and energy solutions for electric vehicle users under the Mobilize Beyond Automotive brand. In addition, it offers used vehicles and spare parts; and engages in the business-to-business powertrain activities, and research and advanced engineering activities. Further, the company engages in the design and production of parts and equipment used for manufacturing and operation of vehicles. It offers commercial, light commercial and passenger vehicles, tractors, farm machinery and construction equipment under the Renault, Dacia, Alpine, Renault Korea Motors, and the Mobilize brands. The company was founded in 1898 and is based in Boulogne-Billancourt, France.

Employees
98636
Market
France

Compare RENA to Peers and Sector

Metrics to compare
RENA
Peers
Sector
Relationship
P/E Ratio
−0.7x10.4x11.3x
PEG Ratio
0.00−0.210.02
Price/Book
0.4x1.4x1.4x
Price / LTM Sales
0.2x0.4x1.0x
Upside (Analyst Target)
44.9%9.1%20.2%
Fair Value Upside
Unlock10.5%9.1%Unlock

Analyst Ratings

12 Buy
6 Hold
0 Sell
Ratings:
18 analysts
Overall Consensus
Buy

Analysts 12-Month Price Target:

Average 47.94
(+47.84% Upside)

Dividends

Payout Ratio
Payout ratio (TTM)
Earnings retained
EPS -42.98%
Dividend Yield
6.78%
Industry Median 6.55%
Annualised payout
2.20
Paid annually
5-Years Growth
-
Growth Streak

Earnings

Latest Release
Jul 31, 2025
EPS / Forecast
-40.90 / 7.07
Revenue / Forecast
15.97B / 16.04B
EPS Revisions
Last 90 days

RENA Income Statement

People Also Watch

8.086
STLAM
+2.41%
215.65
PRTP
+1.20%
461.35
LVMH
+0.05%
80.93
SASY
+0.11%
42.790
ITX
+1.09%

FAQ

What Stock Exchange Does Renault Trade On?

Renault is listed and trades on the Paris Stock Exchange stock exchange.

What Is the Stock Symbol for Renault?

The stock symbol for Renault is "RENA."

What Is the Renault Market Cap?

As of today, Renault market cap is 8.75B.

What Is Renault's Earnings Per Share (TTM)?

The Renault EPS (TTM) is -42.98.

When Is the Next Renault Earnings Date?

Renault will release its next earnings report on 22 Oct 2025.

From a Technical Analysis Perspective, Is RENA a Buy or Sell?

Based on moving averages and other technical indicators, the daily buy/sell signal is Strong Sell.

How Many Times Has Renault Stock Split?

Renault has split 0 times.

How Many Employees Does Renault Have?

Renault has 98636 employees.

What is the current trading status of Renault (RENA)?

As of 10 Aug 2025, Renault (RENA) is trading at a price of 32.43, with a previous close of 31.75. The stock has fluctuated within a day range of 31.92 to 32.52, while its 52-week range spans from 30.87 to 53.26.
Risk Disclosure: Trading in financial instruments and/or cryptocurrencies involves high risks including the risk of losing some, or all, of your investment amount, and may not be suitable for all investors. Prices of cryptocurrencies are extremely volatile and may be affected by external factors such as financial, regulatory or political events. Trading on margin increases the financial risks.
Before deciding to trade in financial instrument or cryptocurrencies you should be fully informed of the risks and costs associated with trading the financial markets, carefully consider your investment objectives, level of experience, and risk appetite, and seek professional advice where needed.
Fusion Media would like to remind you that the data contained in this website is not necessarily real-time nor accurate. The data and prices on the website are not necessarily provided by any market or exchange, but may be provided by market makers, and so prices may not be accurate and may differ from the actual price at any given market, meaning prices are indicative and not appropriate for trading purposes. Fusion Media and any provider of the data contained in this website will not accept liability for any loss or damage as a result of your trading, or your reliance on the information contained within this website.
It is prohibited to use, store, reproduce, display, modify, transmit or distribute the data contained in this website without the explicit prior written permission of Fusion Media and/or the data provider. All intellectual property rights are reserved by the providers and/or the exchange providing the data contained in this website.
Fusion Media may be compensated by the advertisers that appear on the website, based on your interaction with the advertisements or advertisers
© 2007-2025 - Fusion Media Limited. All Rights Reserved.